Keywords
Clinical laboratories; Prognosis; Acceptance; Testing
Introduction
Laboratory tests are among the most important and pervasive aspects of modern medicine. Most health care decisions, from diagnosis through therapy and prognosis, are derived from clinical laboratory tests. Physicians rely on the laboratory for help in diagnosing any number of conditions and for managing their treatment. They trust the results that labs produce. But you have probably seen headlines or heard horror stories about patients who suffered dire consequences, such as unnecessary surgery or even death, as a result of inaccurate lab test results or incorrect interpretation of the results [1]. Dennis G. Smith, in an article for the centers for Medicare and Medicaid services, states that if a clinical laboratory misread a patient’s blood sample as having a normal cholesterol level, when in fact it is high in cholesterol that may not receive the treatment needed to prevent a heart attack [2]. It is also important to note that though waived tests are deemed simple to perform erroneous result are possible and can produce untoward patient outcomes if not acted upon. Practices that reduce laboratory-related error rates or optimize use of laboratory testing can have a substantial effect on patient safety, clinical decision making about treatments and interventions, health outcomes, and costs. When a physician’s practice is compromised by erroneous laboratory results it becomes reflex that he or she loses confidence in that laboratory and finds it difficult to accept result generated as accurate in spite of measures taken to repair the breach.
Mandeville is situated in the parish of Manchester, Central Jamaica; its geographical coordinates are 18° 2' 0" North, 77° 30' 0" West. Mandeville is a major business district, and one of few parish capitals not located on the coast. Mandeville boasts two hospitals (one public and one private), medical centres and many doctors. This quiet town is also believed to provide the best medical services in the island. Medical technologist operating in Mandeville often express concerns about the physicians’ response to result they generate. The general impression given is that the physicians express vacillating confidence in the result they provide and ultimately indicating seeming lack of acceptance. This issue of confidence and acceptance is critical to patient care and has far reaching implications wherein there is a deficit.
The general purpose of the study is to evaluate the acceptance and confidence in results generated by the laboratories in Mandeville from the perspective of medical professionals operating in Mandeville. Physicians are one of the primary customers of laboratory services and obtaining their feedback provides laboratories with opportunities to identify areas for improvement. Physicians in Mandeville request innumerable and varying tests in any given month. The consequences of mistrusting result have grave implication on those to who they seek to provide optimal care. Then there are other issues such as the trauma of the patient having to be stuck when repeat tests are order; the additional cost to the patient were travelling, visits and test rerun are computed; and the possible mistrust imputed on the person(s) who initially carry out the tests. An assessment of the level of acceptance and confidence in the reports generated by the laboratories could go a far way in Mandeville been among the top provider of health care.
Literature Review
Laboratories are complex systems, multi service firms with an ultimate goal to provide results which are true indication of the patient’s pathology. Ever increasing physicians’ expectations to enhance the information content of lab data and to couple cost- reduction measures with improvement in efficiency, particularly in regard to turn around time for reporting lab results has intensified pressure on clinical labs [3]. Physicians depend heavily on reports generated by Medical Technologist also called Clinical Laboratory Scientist who in turn rely on their skills to generate quality reports. According to Reiser, “Medical technology is a double-edged sword. On one hand, it can help physicians better understand and treat disease. On the other hand, it erodes a physician's confidence in his or her own professional judgment. When a physician begins to mistrust his own non-technical, diagnostic abilities, he reduces himself to an intermediary” [4]. On the other hand, physicians can mistrust the result they receive, as is more often the case. At the heart of a laboratory report is the test, which according to the ISO/IEC Guide 2 is a "technical operation that consists of the determination of one or more characteristics of a given product, process or service according to a specified procedure” [5]. A test is data result from the performance of a test procedure [6]. Clinical laboratory tests, an extension of the patient's physical assessment, can facilitate, enhance, rule out, or confirm diagnostic or clinical management decisions. Clinicians, using reports generated by clinical laboratories in patient care decisions, need some sense of the reliability of those results, particularly when the testing is being done by an office or hospital ward laboratory operated by staff with little or no technical laboratory training. Testing can be performed by laboratories differing widely in size, legal status, purpose, range of testing services offered, and technical competence. Such laboratories can be government regulatory laboratories, government research laboratories, or government supported laboratories - at the federal, state or local levels. They can also be college/university laboratories, independent private sector laboratories; laboratories affiliated with or owned by industrial firms, or manufacturers' in-house laboratories. Test laboratories can be for profit or non-profit. Laboratories can operate facilities in one or more than one location; and may, in fact, operate laboratories in more than one country. Laboratories can offer a limited range of testing services or may offer services in many fields. There are almost as many different types of laboratories providing testing services as there are different types of users of the test data they produce [6]. It is the work of laboratory personnel to maintain excellent relationships with clinicians by providing quality service thereby positively impacting physicians’ confidence and acceptance of their results. Extreme stress is given upon proper performance of test procedures in order to prevent systematic errors. It is very difficult to establish effective methods for monitoring and controlling pre-analytical variables that occur outside the lab domains. Though constant contact with the wards is kept on telephone, support from outside the lab is still required to maintain a high quality of service. Good technical procedures are necessary to control and monitor pre-analytical variables such as test requests, patient preparation, patients and specimen identification, specimen acquisition, specimen transport, specimen processing and specimen distribution. An error in any one of these steps can invalidate the quality of analyses and causes the laboratory to fall short of its quality goals [7]. Practices that reduce laboratory-related error rates or optimize use of laboratory testing, can have a substantial effect on patient safety, clinical decision making about treatments and interventions, health outcomes, and costs [8]. Clinicians find it challenging especially when unnecessary investigations, secondary questionable report and subsequent reruns, results in financial stress on poor patients. A high-quality organization aims to meet customers' needs. Physicians are one of the primary customers of laboratory services and obtaining their feedback provides laboratory managers with opportunities to identify areas for improvement. Most clinical laboratory managers believe that customers want accuracy, precision, speed, economy, etc. and set out to directly measure laboratory performance in each specific area. But there is another integral approach to measuring quality that of assessing customer satisfaction with services, without making any assumptions about the relative importance of specific functions. Laboratories in the United States are required to assess customer satisfaction with services offered which is considered an important component of a laboratory quality assurance program and is required for accreditation by the College of American Pathologists (CAP) and The Joint Commission on Accreditation for Healthcare Organizations [8]. Satisfaction in this case, heavily is embedded in their confidence and acceptance of the services, of which test results are paramount. Two studies, performed in 1999 and 2002, reported an overall physician satisfaction score for clinical laboratory services of 4.0 (on a scale of 1 [poor] to 5 [excellent]) for the median laboratory, with the greatest satisfaction in the areas of staff courtesy, critical value notification, and quality of results, and the least satisfaction in the categories of turnaround times [9]. For such an important aspect of healthcare an evaluation on national would provide valuable data for laboratory managers as they seek to improve the quality of service offered.
Method
Questionnaires were distributed to physician both in public and private practices. Twenty – one physicians participated in the survey which provided them with the mechanism to rate their overall acceptance and other aspect of clinical laboratory services. Evaluation used a scale of 1 to 10, one being the lowest and ten the highest. In addition, physicians were asked “How often does your lab result conflict with treatment interventions especially when your patient complies with treatment regime?” and “If it where altogether feasible, would you rather obtain result from the more established laboratories in Kingston?” with a yes or no answer. The statistical analysis of the data was carried out using SPSS version 17.
Results
Approximately 87% of the physicians participating in the study were females. The majority individual participating in the study (n=15/57.7%) had 5-10 years of experience. Approximately 70% of the participants at the time of survey was conducted were practicing in the public hospital, 15% were operating in private facilities and the remainder practice in both private and public medical centres. Most of the participants indicated that they were motivated to send the patients to public laboratories secondary to the fact that cost associated with testing specimen was relatively cheaper when compared with private laboratories. Others who preferred private facilities indicated that the turn-around time was better than that which is observe in public laboratories. A fear of obtaining questionable results was cited as a primary factor with regards to willingness to use other laboratories other than ones preferred. Approximately 89% (n=23) of all participants indicated that they had no significant difficulty interpreting results obtain from laboratories used. However, individuals who indicated that they had rare challenges with results interpretation sited that poorly presented results were the main factor lending to difficulty with respect to interpreting such results. Sixty-five percent (65%) of the participants indicated that they are presented with results which appear conflict with treatment regimen about one in every thirty tests. However, only 62% indicated that they request a test repeat one in every thirty tests, 19% for every one in ten test, 11% for everyone in forty tests and 8% for everyone in fifty tests. All participants indicated that repeated tests were conducted to confirm or disprove questionable results. Forty-six percent (46%) of the participants indicated that they are 80% accepting of personal laboratory results, while approximately 27% were 90% accepting, another 15% were 70% accepting and 11.5% were 60% accepting of such results. On the other hand, 69% of the participant indicated they 90% accepting of laboratory result pertaining to their patients, while 19% were 70% accepting and about 12% were 80% accepting of such results. Approximately 46% of the participants indicated that rarely employ the service of referral laboratories, while another 42% never use such services, and 12% employed the services of referral laboratories sometimes.
Discussion
According to the American Heritage Dictionary acceptance is “the act or process of accepting” [10]. It can be described as a mental attitude that indicates that something is believable and should be accepted as true. Confidence on the other hand is that which helps to cement the belief that something is worth accepting. Confidence is defined by the Collins English Dictionary as, “a feeling of trust in a person or thing” [11]. In this study quality of laboratory service was equated to the level of acceptance and confidence that physicians have in the result the laboratory generate, given that the physicians are the primary customers. The assumption was made that the physicians’ level of acceptance with the laboratory report generated would undoubtedly reflect the laboratories’ ability to meet the need of its secondary customers namely – patients, caregivers and they society at large.
In this study which assessed the level of acceptance of laboratory result by 26 physicians operating in Mandeville, it was found that there was a high level of overall acceptance of laboratory results. One hundred percent of the physicians indicated that their level of acceptance to be between 7 and 9 out of a score of 1-10, one being the lowest and ten the highest, where patient results are concerned. The mean level of acceptance was 8.5 which is a positive indicator for the laboratories. This kind of study could also be an indicator of customer loyalty, as well as a detector of problems. A study of this nature could better correlate with a company's revenue growth than do traditional customer satisfaction questionnaires.
Some physicians were less accepting of result that pertain themselves with a mean level of acceptance of 7.6 out of 10. There is a significant difference between the mean level of acceptance of personal result when compared to the mean level of acceptance of patient result, t=5.494; p<0.05 (Table 1 and Figure 1). This could be primarily because physicians tend to be more cautious when test results are their own.
| Variables |
Paired Differences |
t |
df |
Sig.
(2-tailed) |
| Mean |
Std. Deviation |
Std. Error Mean |
95% Confidence Interval of the Difference |
| Lower |
Upper |
Pair 1
Degree of acceptance of personal results - Degree of acceptance of patient results |
-0.06154 |
0.05711 |
0.01120 |
-0.08461 |
-0.03847 |
-5.494 |
25 |
.000 |
Table 1 Paired samples test.
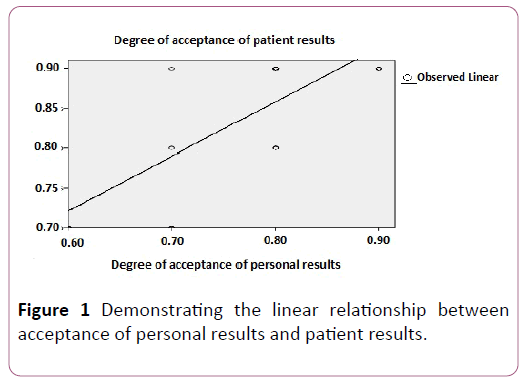
Figure 1: Demonstrating the linear relationship between acceptance of personal results and patient results.
While there is a significant difference between physicians’ acceptance of personal result and their acceptance of patient result, there exist a strong or positive correlation between the two variables, r=1; p<0.05 (Table 2). A physician’s level of acceptance of personal results was a strong predictor of the level of acceptance for patient results, r=0.643, p<0.001 (Tables 1-5).
| Variables |
Degree of acceptance of personal results |
Degree of acceptance of patient results |
| Degree of acceptance of personal results |
Pearson Correlation |
1 |
0.802** |
| Sig. (2-tailed) |
0.000 |
| N |
26 |
26 |
| Degree of acceptance of patient results |
Pearson Correlation |
0.802** |
1 |
| Sig. (2-tailed) |
0.000 |
| N |
26 |
26 |
| **Correlation is significant at the 0.01 level (2-tailed) |
Table 2 Correlations-1.
| Model |
R |
R Square |
Adjusted R Square |
Std. Error of the Estimate |
| 1 |
0.802a |
0.643 |
0.628 |
0.05807 |
| aPredictors (Constant), Degree of acceptance of patient results |
Table 3 Model summary.
| Model |
Sum of Squares |
df |
Mean Square |
F |
Sig. |
| Regression |
0.146 |
1 |
0.146 |
43.179 |
0.000a |
| Residual |
0.081 |
24 |
0.003 |
-- |
-- |
| Total |
0.227 |
25 |
-- |
-- |
-- |
| aPredictors: (Constant), Degree of acceptance of patient results |
| bDependent Variable: Degree of acceptance of personal results |
Table 4 ANOVAb
| Model |
Unstandardized Coefficients |
Standardized Coefficients |
t |
Sig. |
| B |
Std. Error |
Beta |
| (Constant) |
-0.010 |
0.122 |
|
-0.082 |
0.935 |
| Degree of acceptance of patient results |
0.939 |
0.143 |
0.802 |
6.571 |
0.000 |
| aDependent Variable: Degree of acceptance of personal results |
Table 5 Co-efficientsa.
The result study seems to suggest that physician with more experience are more likely to be accepting of their own results as well as patient result (Figures 2 and 3). This could stem from the fact that with years of experience comes with knowledge of the laboratories that operate at the highest standard and ultimately yield a greater quality of results.
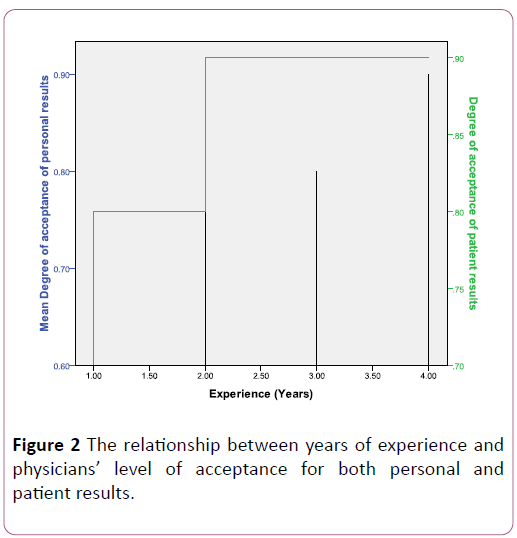
Figure 2: The relationship between years of experience and physicians level of acceptance for both personal and patient results.
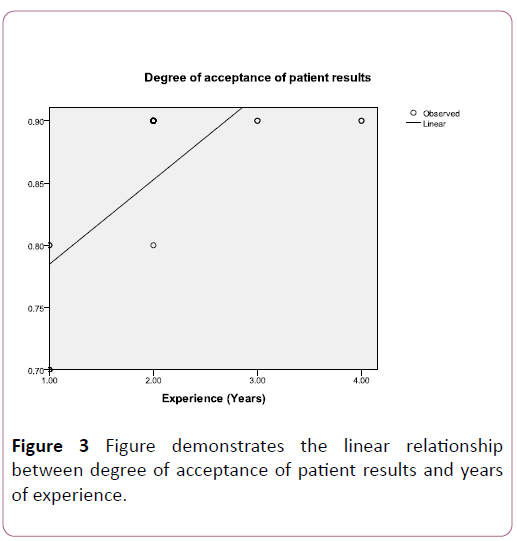
Figure 3:Figure demonstrates the linear relationship between degree of acceptance of patient results and years of experience.
While physicians desire quality laboratory reports, it is evident that the cost of testing plays an important role in the determining which laboratory gets the work. The most popular laboratory in the survey was the public laboratory which offers free healthcare system. Participants indicated that cost and turnaround time were the main reasons for the laboratories they used, turn-around time was better with private laboratories. Laboratories with poor turn-around time should try to improve their services and thereby increase physician’s level of acceptance and confidence, ultimately building better relationships. Investment of resources for analyzing and improving pre-analytic, analytic, and post-analytic processes to improve test turnaround times would clearly be the best focus for most laboratories to improve customer satisfaction [12]. Approximately eighty nine percent of the participants indicated that they never had any challenges interpreting result and the remainder who had occasional challenges was reluctant to cite factors contributing to the difficulty associated with interpreting result. All the physicians indicated that their reason for repeating tests was to confirm or disprove questionable result. There was a strong correlation between the level of acceptance of patient results and the frequency with which tests were repeated, r=1, p<0.001 (Table 6).
| Variables |
Degree of acceptance of patient results |
Frequency of rerun |
| Degree of acceptance of patient results |
Pearson Correlation |
1 |
-0.922** |
| Sig. (2-tailed) |
0.000 |
| N |
26 |
26 |
| Frequency of rerun |
Pearson Correlation |
-0.922** |
1 |
| Sig. (2-tailed) |
0.000 |
| N |
26 |
26 |
| **Correlation is significant at the 0.01 level (2-tailed) |
Table 6 Correlations-2.
Forty-six percent of the participants indicated that they rarely used reference laboratories in Kingston to confirm locally obtained results, very strong indicator of their confidence in the quality of laboratory result they receive from laboratories in Mandeville. One –hundred percent of the participants in the study believed that laboratories in Mandeville generate the quality of results they desire.
In this study no association was made between lack of standardization, non-compliance with standards, question of competence on the part of workers and the level of acceptance. This could stem from the fact that most laboratories, if not all, are gearing up for accreditation which requires the development of standards, implementing quality control and assurance systems.
According to Beasley et al. as medical laboratories work at continuously improving their services, they are also expected to work towards international recognition of the efforts through accreditation [13]. Such a status would provide greater confidence in the test results and ensure that those results would be acceptable locally and abroad. The study seems to indicate that physicians with greater than five (5) years of experience scored higher level of physicians’ acceptance and confidence may imperfectly reflect the view of the patients and other caregivers. Thirdly, non – response to the factor that may have led to the challenges associated with interpreting results could prevent possible resolution of such problems. Finally, the few physicians in Mandeville are very busy and are generally unavailable to participate in this kind of survey.
Conclusion
The principal findings of this study are that physicians in Mandeville have a high level of acceptance for the result that the laboratories generate, be it for themselves or for their patients and that the laboratories have remarkable turnaround and reasonable cost for the services offered. Other findings include the belief that laboratories in Mandeville carry out quality work and subsequently yield quality results which eliminate the need to have tests done by laboratories renown for quality service. It behoves laboratory in Mandeville and Jamaica at large to do embrace opportunities for quality improvement, including obtaining ISO 15189 accreditation, to improve the quality of their service, thereby positively impacting the level of acceptance and confidence physicians have in the result they generate.
24282
References
- Smith DG (2002) Department of health and human services. Centers for Medicare & Medicaid Services. B-302710.
- Sunderman FW (1992) The history of proficiency testing/quality control. Clin chem 30: 1205-1209.
- Reiser SJ (1978) Medicine and the reign of technology. Cambridge: Cambridge University Press; 1978.y between the patient and the laboratory technicians and their machines.
- Westengard S (1998) Measures of dispersion and their use in the hematology laboratory. Laboratory Hematology 4: 130–132.
- Breitenberg MA (1991) Department of Commerce, National Institute of Standards and Technology, Standards Code and Information Program, Office of Standards Services Gaithersburg, MD 20899.
- Shaukat A (2004) Clinical Chemistry Laboratory Testing; Evalaution At Quaid-E-AzamMedical College Bahawal Victoria Hospital, Bahawalpur. Copyright: 12th July, 2004.
- Schuerch C, Selna M, Jones J (2008) Laboratory clinical effectiveness: Pathologists improving clinical outcomes. Clin Lab Med 28: 223-244.
- Comprehensive Accreditation Manual for Laboratory and point-of–care testing. Oakbrook Terrace, III: Joint Commission on Accreditation for Healthcare Organization; 2005-2006. p.110.
- The American Heritage® (2009) Dictionary of the English Language, Fourth Edition copyright ©2000 by Houghton Mifflin Company. Updated in 2009. Published by Houghton Mifflin Company.
- Collins English Dictionary (2003) Complete and Unabridged © Harper Collins Publishers, NY, USA.
- Jones BA (2009) Physician satisfaction with clinical laboratory services. Archives of Pathology & Laboratory Medicine 133.
- Beasley BW, Fromme EK, Farber NJ, Babbott SF, Pickett ME (2008) What do you do when your loved one is ill? The line between physician and family member. Ann Intern Med 149: 825–829.