Keywords
Multivariate linear regression, malaria susceptibility model, GIS, Remote Sensing, Varanasi.
Introduction
The representation and analysis of maps of disease-incidence data is a basic tool in the analysis of regional variation in public health. Tobler’s first law of geography, which states that “things that are closer are more related,” is central to core spatial analytical techniques as well as analytical conceptions of geographic space. In the case of disease spread, individuals near or exposed to a contagious person or a tainted environmental setting are deemed more susceptible to certain types of illnesses [1].
The rapid urbanization in many parts of the world is changing the context for human population and their interaction with the natural ecosystem. To understand the complex nature of the malaria mosquito human relationship, it is required to identify the type of human migration, population growth, socio economic status, behavior and the environmental aspects around them. This requirement underscores the importance of human intervention that may affect the mosquito vector population and the intensity of parasitic transmission in endemic areas, whether in rural or urban settings. The key determinants of the outcome of malaria should be related to the human host, parasite, vector or environmental parameters. However, the relative importance of these factors has yet to be determined [2,3].
Malaria (marsh fever, periodic fever) is a parasitic disease that involves infection of the red blood cells (RBCs). Malaria in humans is caused by the transmission of one or more of four parasitic, class Sporozoa. The severity and clinical presentation of symptoms depend largely on the species of Plasmodium contracted [4]. The four species responsible for infection are Plasmodium falciparum, Plasmodium vivax, Plasmodium ovale and Plasmodium malaria. These species vary widely with respect to geographic distribution, physical appearance and immunogenic potential. Malaria transmission depends on the diverse factors that influence the vectors, parasites, human hosts, and the interactions among them. These factors may include, among others, meteorological and environmental condition etc. The most apparent determinants are the meteorological and environmental parameters, such as rainfall, temperature, humidity and vegetation [5,6]. That there are so few examples of the use of epidemiological maps in malaria control may be explained by the lack of suitable, spatially defined data and of an understanding of how epidemiological variables relate to disease outcome.
However, recent evidence suggests that the clinical outcomes of infection are determined by the intensity of parasite exposure, and developments in geographical information systems (GIS) provide new ways to represent epidemiological data spatially. GIS software is being used to correlate the climatic attributes of the collection localities with the presence or absence of the various species [7,8]. This computer based technology has been available for a number of years but it is only recently that it has been widely appreciated as a powerful new tool to augment existing monitoring and evaluation methods for disease mapping [5,9].
Mathematical and statistical modules embedded in GIS enable the testing of hypotheses and the estimation, explanation, and prediction of spatial and temporal trends.10 Statistical techniques model the relation between parasitaemia risk and risk factors (environmental, possible interventions, socio-economic factors) via a multivariate linear regression model, which is further used for prediction [11]. GIS plays a variety of roles in the planning and management of the dynamic and complex healthcare system and disease mapping. Although still at an early stage of integration into public healthcare planning, GIS has shown its capability to answer a diverse range of questions relating to the key goals of efficiency, effectiveness, and equity of the provision of public health services [12,13]. Unquestionably, GIS will play a significant part in the reorganization of public health and disease planning in the twenty-first century, especially in response to sweeping changes taking place in the handling of health information [14].
Vegetation is often associated with vector breeding, feeding, and resting locations. A number of vegetation indices have been used in remote sensing and Earth science disciplines. The most widely used index is the Normalized Difference Vegetation Index (NDVI). It is simply defined as the difference between the red and the near infrared bands normalized by twice the mean of these two bands. For green vegetation, the reflectance in the red band is low because of chlorophyll absorption, and the reflectance in the near infra-red band is high because of the spongy mesophyll leave structure [1].
Because malaria is vector-borne, there are many remotely sensed abiotic and biotic environmental variables that are relevant to the study of malarial transmission and habitat niches of the vector. For example, the Normalized Difference Vegetation Index (NDVI) is a characterization of vegetative density based on the amount and wavelength of the radiation reflected by the leaves of a plant. When vegetation is photosynthetically active, it has a high reflectance in the near-infrared region of the spectrum and a low reflectance in the red portion of the spectrum. In an environment where vegetation is healthy and green, the leaves of the resident vegetation will absorb a significant percentage of the visible light produced by the sun [15]. The more vigorous and denser the vegetation is, therefore, the higher the NDVI becomes. NDVI has also been used as a surrogate for rainfall estimate. It is an effective measure for arid or semi-arid region. For tropical regions where ample rainfall is normally received, vegetation index is a less sensitive measure for estimating rainfall. The mean vegetation index over a region reflects the degree of urbanization or lack of vegetation. In this sense, NDVI in a grid cell is used as an indicator for the mean level of vegetation present in the cell.
The present study illustrates how GIS allows integration of different data sets to arrive at holistic or aggregative solutions. It shows how the technique can help in generating additional indicators (of discrete and continuous nature) form remote sensing data and incorporate these into the core of the analysis. Indeed, the level of desegregation at which the analysis has been undertaken in the present study is not possible through conventional methods.
Objectives of the Study
The main aim of this study is to develop a malaria distribution map and malaria susceptibility models using multivariate linear regression analysis though Remote Sensing data and GIS techniques.
Study Area
The study is Varanasi district, U.P., extending between the latitude of 25°10’ N to 25°37’ N latitude and longitudes of 82°39’ E to 83°10’ E, lies in eastern Uttar Pradesh. Its major area is stretched towards the west and north of the Varanasi city spread over an area of 1454.11 sq. km (Fig.1). Administrative the district comprises two tahsils namely, Pindra and Varanasi Sadar which are further sub-divided into eight development blocks namely Baragaon, Pindra, Cholapur, Chiraigaon, Harhua, Sevapuri, Araziline and Kashi Vidapeeth altogether consisting of 1336 villages.
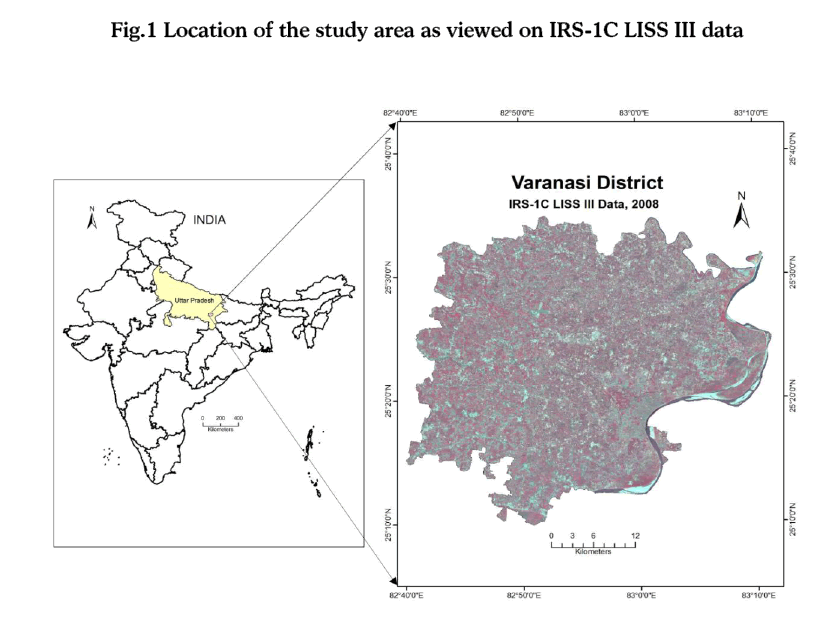
Figure 1: Location of the study area as viewed on IRS-1C LISS III data
Data Collection and Assessment of Used Parameters
Successful prediction of malaria occurrence and the production of a map of the malaria prone areas call for the collection of the relevant spatial data. A number of thematic maps (referred to as data layers in GIS) on specific parameters or parameters which are related to the occurrence of malaria, distance to water bodies, distance to river, distance to hospital, rainfall, temperature, land use/landcover, NDVI etc. have been generated (Fig. 2).
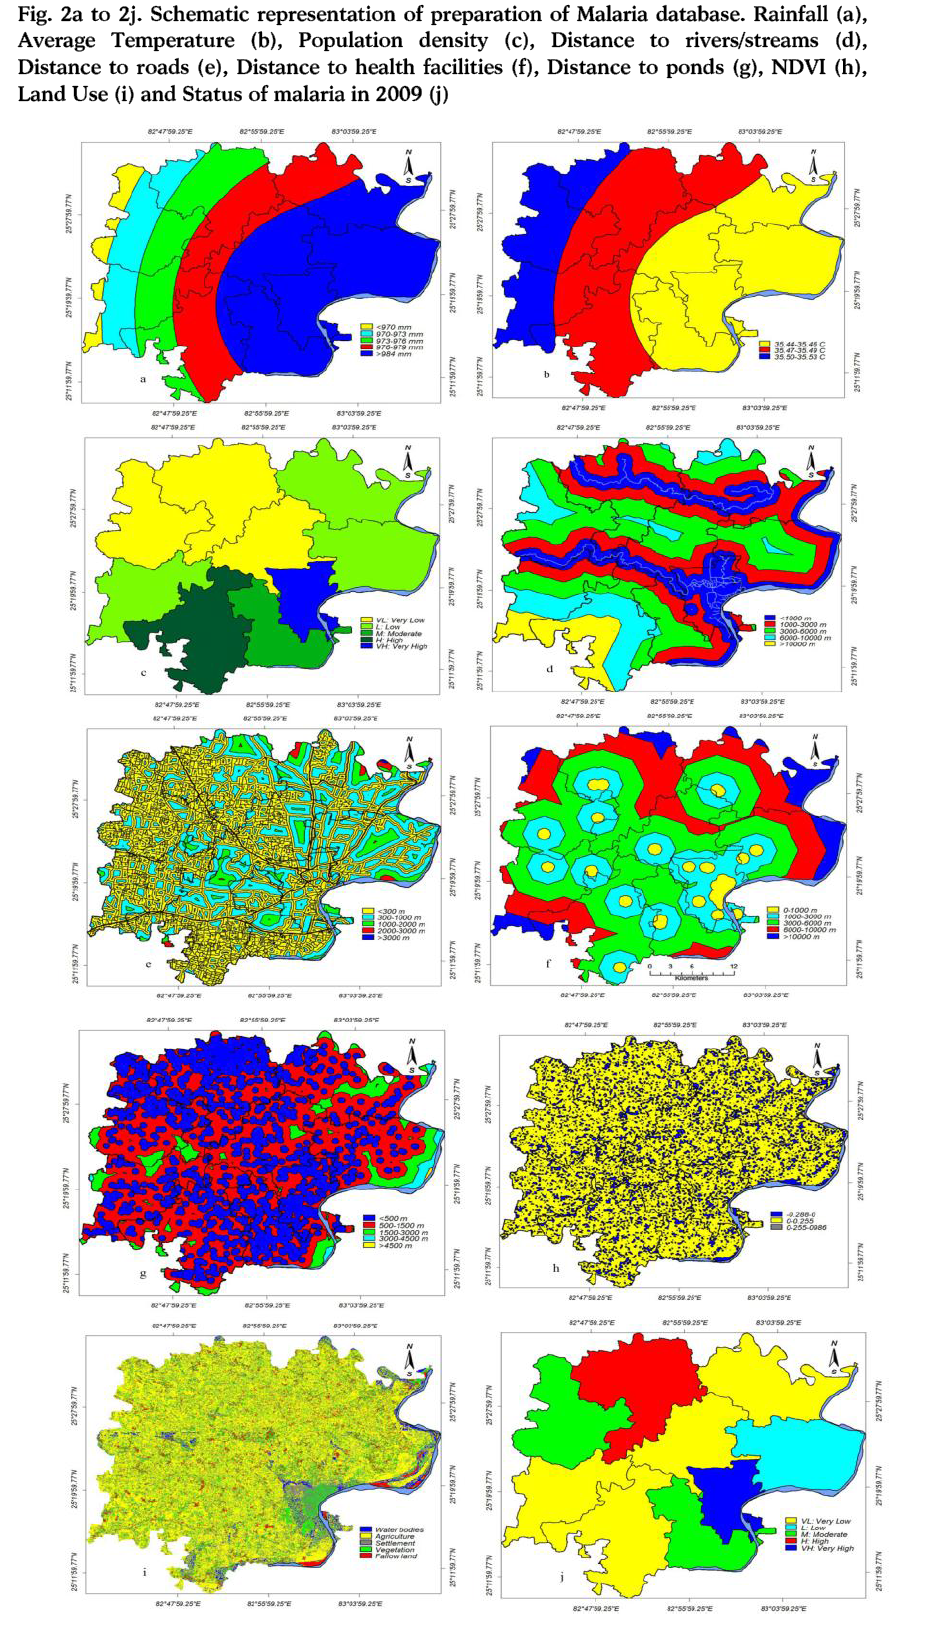
Figure 2a to 2j: Schematic representation of preparation of Malaria database. Rainfall (a), Average Temperature (b), Population density (c), Distance to rivers/streams (d), Distance to roads (e), Distance to health facilities (f), Distance to ponds (g), NDVI (h), Land Use (i) and Status of malaria in 2009 (j)
A malaria susceptibility map (i.e. malaria susceptibility zone and malaria susceptibility index) has also been prepared. The basic data sources that have been used to generate these layers are including IRS-1C LISS III data of year 2008, SOI topographic maps (1:50,000 scale). Census data of year 2001 was also used and using this population data of year 2001, projected population of year 2009 was calculated which was used to calculate population density of year 2009. Besides, field surveys have been carried out for verification and condition of ponds/water tanks, health facilities in PHC’s/CHC’s and government hospitals. Malaria data of year 2009 was used for this study. These data are taken from District Malaria Office, Varanasi. The above data sources have been used to generate various thematic data layers. Climate data not only for Varanasi district but for various neighboring district/places like Patna, Gaya were used for comparative variation and for interpolation in trend of rainfall and temperature from Varanasi district.
Methodology
A number of thematic maps (referred to as data layers in GIS) on specific parameters or parameters which are related to the occurrence of malaria, viz. land use, NDVI, distance to water ponds/tanks, distance to river, distance to road, distance to hospital, rainfall, temperature and expected population density of year 2009 have been generated (Fig 2). In this study, Ilwis Version-3.4 and ArcGIS Version-9.3 GIS and ERDAS Imagine Version-9.1 software were used to produce the layer maps that assist in the production of the malaria susceptibility maps. Topography map of 1:50,000 scale of study area were used to digitize district and development block boundary. The coordinates of important point for geo reference point like road conjunction points and malaria prone area, existing health care facilities units were measured during the field surveys using Global Position Systems (GPS) technology. In the measurement phase, one receiver served as a base station, while the other was used to collect GPS data at the selected ground control points. To establish the relationship between object space and image space, the ground control points were selected in the model area to conduct all measurements in the National Coordinate System. The vector maps were produced from the IRS LISS-III remote sensing data and SOI topographical map. Therefore, land use map, NDVI and vector layers of water bodies and other important parameters used in this study were delineated in ERDA Imagine-9.1 and ARC GIS-9.3 software. For GIS platform georeferenced digital map of development blocks/districts were used. In order to carry out multivariate analysis of data and to determine the all parameters responsible for malaria in the study area, a multiple linear regression has been used. Multiple Linear regression models were built for malaria cases reported in study area, as the dependent variable and various time based groupings of temperature, rainfall and NDVI data as the independent variables. The multiple linear regression method reveals that how the susceptibility of malaria as the standard deviation of independent variables and predictors change.
Furthermore, it will help to make an equation and linear function (model) for malaria susceptibility in intended study area. All these used parameters were analysed in SPSS statistical software using multiple linear regression model and crossed to each other and then finally Malaria Susceptibility Index (MSI) and Malaria Susceptibility Zonation (MSZ) were produced.
In this study equation of the theoretical model will be described as follows.
L=B0+b1X1+b2X2+b3X3+....+bmXM+ε
Where, L is the occurrence of Malaria in each unit, X’s are the input independent variables (or instability parameters) observed for each mapping unit, the B’s are coefficients estimated from the data through statistical techniques, and ε represents the model error.16 To produce malaria susceptibility map in this method, the amounts of quantitative and qualitative variables based on sampling of 50×50 networks in form of a 38622×9 matrix have been transferred from GIS software (ILWIS 3.4 and ARC GIS-9.3) into statistical software (SPSS).
Discussion
Malaria exists in every tropical and subtropical landscape across the globe; sometimes making seasonal excursions into temperate areas as well [15]. The protozoan parasites that cause it have more complex genomes, metabolisms and life cycles than almost any other vector-borne threat. This complexity makes them a difficult target for interventions such as drugs and vaccines because the parasite’s shape-shifting ways allow it to evade chemical and immunological defenses. They pose a moving target as well, intentionally changing their outer coating during each phase of their life cycle, and creating a diverse antigenic and metabolic wardrobe through sexual recombination, an engine of diversity creation unavailable to simpler microbes such as viruses and bacteria [17].
The origin and subsequent spread of malaria diseases have a close relation with time and geographic locations. If disease data are captured in space/location and time and they contain essential disease attributes, the spatial distribution and temporal characteristics of the disease spread may be monitored and visualized for probable intervention. With the availability of disease spread models, the contagious process may be dynamically simulated and visualized in two or three dimensional spatial scales [18]. Consequently; high-risk population groups may be identified and visually located while the spatial distributional patterns and spreading behaviors of a disease may be uncovered. More effective prevention decisions may be made by the government and public health institutions through better allocation of medical resources by using the network analysis models of a GIS [19].
Malaria Influencing Data Layers
The regression coefficients of this model (multiple linear regressions) are given in Table 1.
Rainfall
Rainfall is considered to be the most important malaria triggering parameter causing soil saturation and a rise in pore-water pressure. However, there are not many examples of the use of this parameter in stability zonation, probably due to the difficulty in collecting rainfall data for long periods over large areas. After interpolation between amounts of annual rainfall in the study area stations, the isohyets map created. Finally this map has been grouped into five classes to prepare the rainfall data layer (Fig. 2a). It was verified that approximately maximum 45.82 % of the malaria occurred in >984 mm rainfall class. In >984 mm rainfall class, 30.81% of malaria area comes in very low and low zones whereas 6.29% of malaria area calculated for very high zones but in < 970 mm rainfall class, only very low and moderate zones of malaria area were calculated which is 3.19%. And with this it is proved that increasing amount of rainfall increases the malaria breeding sources (Table 1).
Temperature
To take into account the relationship between the temperatures for malaria transmission, the temperature data were gathered for different periods. The temperature distribution map has been grouped into three main classes i.e. 35.44-35.46°C, 35.47-35.49 C° and 35.50-35.52 C° (Fig. 2b). In Table 1, it is found that, in the study area malaria vectors are basically developed in 35.44-35.46°C category. 43.69% of the malaria area found in this category but in 35.50-35.52 C°, only 17. 98% of malaria area comes in this zone.
Population Density
The overall population distribution in the district is closely related to the physical and socio-cultural factors. Population distribution is a dynamic process which manifests varying nature of man’s adjustment with physical resources. Population density has been encountered under various typological purviews to reveal different aspects of population distribution. Census data of year 2001 was also used and using this population data, projected population of year 2009 was calculated which was used to calculate population density of year 2009, in which area is divided in five categories on the basis of its population density i.e. very low, low, medium, high, very high (Fig. 2c). In the Table1, it was fond that, in very low population density, very high malaria zone is not available but where population density is very high, very high malaria area are calculated (6.29%). This very high malaria zone comes in city area of the Varanasi (Fig. 2c).
Distance to River/Streams
One of important parameter that some time play important role to increase malaria parasites and malaria disease is the distance to river. The closeness of the populated area to drainage structures is an important parameter for malaria vector breeding source. Streams may some time give adversely affect to those area which are comes under low lying area especially villages and settlement area near by Varuna river. A thorough field investigation should be carried out to determine the effects of river/streams on the malaria disease (Fig. 2d). The malaria area percentage in each buffer zone is given in Table 1. This shows that 21.64% of the malaria area are closely located within the 0-1000 m buffer zone in which 8.95% of the malaria area are comes in high and very high categories and 6.88% of malaria are comes in very low categories. In this study, it was found that, 6.69 % of malaria area comes in > 10000m buffer distance of stream and in this zone only very low and moderate categories are available, which is mainly because of influence of some of the other indicators/variables and at this distance malaria indicators or breeding sources are not very much influence on people. One important thing it was also found in this study that as the distance to rivers/stream increases, percentage of malaria effected area in high and very high categories are decreasing, which is 8.95% within the 0-1000m and 2.97% in 6000-9000m buffer zone respectively (Table 1).
Distance to Road
Similar to the effect of the distance to streams, distance to road is also one of important parameters to estimate the distance of road from existing health care facilities in the study area. Five different buffer areas were created on the path of the road to determine the effect of the road on the malaria disease (Fig. 2e). The malaria area percentage in each buffer zone is given in Table 1 and shows that 63.83% of the malaria area are closely located within the <300 m buffer category whereas very nominal 0.77% of malaria areas comes in buffer zone of 2000-3000 m. In >3000m buffer category only very low and low categories calculated, which is 0.03% (Table 1). Here also seen that, as distance to road increases malaria area percentage shown decreasing trend.
Distance to Health Facilities
Health facilities of the Varanasi district are based on mainly modern allopathic of treatment. To know the distributional pattern of health care facilities, data has been collected from CMO office and government hospital located in rural areas of Varanasi district. The existing health facilities both in rural and urban area were surveyed with the help of Leica DGPS. There are different categories of health centre providing infrastructure and treatment in the district. The PHC’s are dotted in the district located at an interval of 10-20 kms and the tahsil hospitals are located about 50 km apart. The hierarchical with the distribution of medical centre’s of the district bears a close relationship with the hierarchy a central places and population size of the settlement. Besides, the transport network has also influenced the growth of health care facilities. Percentage of malaria area is very much related to distance to health facilities (Fig. 2f). In Table 1, it is found that, 4.77% of malaria area is belonging to 0-1000 m buffer distance to health facilities and 24.10% of malaria area comes in 6000-10000 m buffer distance. Table 1 shows that as the distance to health facilities increases, malaria area are also increasing, except in >10000 m buffer zones (7.71% of malaria area only). Here, in these area may be malaria breeding sources are not developed as much than the other areas.
Distance to Water Ponds
Water Ponds in the study area are extracted with the help of IRS- 1C LISS III satellite data of year 2008. Five different buffer areas were created for the water ponds to determine the effect of the water ponds on the malaria disease (Fig.2g). In Varanasi, there used to be many ponds and tanks dating back to ancient time. Besides serving as the holy places for holding Hindu religious rituals, they also played an important role in rainwater collection and thereby served as sources for ground water replenishment. However, due to rapid increase of the population, most of these ponds have been wiped out from the map of the Varanasi or its conditions are deteriorating. Pollution of the ponds in the area is mainly sourced from heaps of garbage. The solid and liquid wastes generated out of the household and industrial activities are dumped and released in uncontrolled sites. These wastes are disposed of in the low lying areas where the tanks and ponds are located and due to this malaria vectors very easily developed and many cases of malaria disease found nearby these polluted pond water. In this it were found that 44.7% of malaria are occurred within <500 m buffer category of ponds and only 0.17% of malaria area exist in the zone of <4500 m buffer category of ponds. In <500 m buffer distance to ponds, 13.53% of malaria area comes in very high and high zones and 20.49% of malaria area comes in very low and low zones whereas in 1500-3000 m buffer distance, only 0.36% of malaria area are identified in very high and high zones and 5.78% of malaria are identified in very low and low category respectively (Table 1).
Normalized Difference Vegetation Index (NDVI)
Vegetation is often associated with vector breeding, feeding, and resting locations. A number of vegetation indices have been used in remote sensing but most widely used index to enhance the vegetation areas and crop field is the Normalized Difference Vegetation Index (NDVI). The NDVI map has been grouped into three main classes and in this study it was found that 18.86 % of malaria area occurred in -0.288 to 0 categories and only 0.05 % of malaria area comes in 0.255-0.986 category (Fig. 2h). In the Table 1, it is shown that 81.09% of malaria area comes in 0-0.255 category, which is class of agriculture and fallow land.
Land Use/Land Cover
Land use/land cover information is also very important parameters to calculate malaria susceptibility map and calculate malaria susceptibility zone using multi linear regression model. The land use/land cover map of the study area has been prepared by IRS-1C LISS III Remote Sensing data of year 2008. Land use map was prepared in Image Processing platform in which five main classes i.e. agricultural field, settlement, vegetation, water bodies and fallow land are highlighted. Here in this study it was found that agriculture and vegetation are very important parameters and play important role for malaria vector breeding source. Those areas in Varanasi district having dense vegetation covered provide favorable condition for malaria vectors. Presence of crop field especially in those areas where rice crop cultivation is also crucial in malaria vector breeding source. Many part of Varanasi district have comes under good type of agricultural field, wherever have good irrigation facilities farmers cultivate rice crop in Kharif season. Thus area with good crop field should be prone to the occurrence of malaria in some cases (Fig.2i). Some analyses were performed using land cover and malaria maps to determine the distribution of malaria, according to the land cover classes, the 54.11% of malaria affected area occurred in agriculture area class whereas18.77%, 16.34%, 7.63%, 3.15% of malaria area occurred in settlement, vegetation, fallow land and water bodies categories respectively. In water body’s class, 0.73% of malaria area comes in very high and high zones and 1.86% of malaria area comes in very low and low zones. For agricultural class, 10.22% of malaria area comes in very high and high categories and 32.43% of malaria area calculated for very low and low zones (Table 1).
Status of malaria in Varanasi district is shown in the fig. 2f and 5j and Table 2, it was found that, 26.07% of the area comes under very low malaria zone where as 17.37% area have high malaria levels.
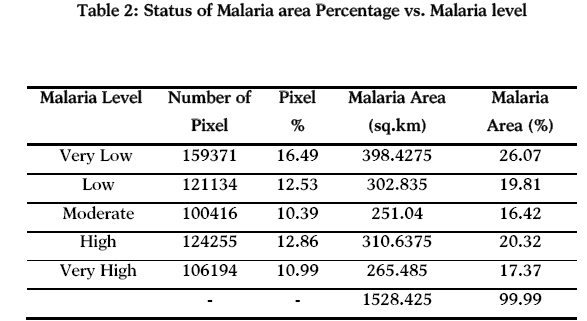
Using all the above indicators, Malaria Susceptibility Index and Malaria Susceptibility Zones are developed. All these indicators are very helpful to develop a relationship between in malaria breeding source. The Malaria Susceptibility Index (MSI) values from the multiple linear regression method are found to lie in the range from 3.2 to 30.8 (Fig. 3). The cumulative frequency curve of MSI values has been segmented into five classes representing near equal distribution to yield five malaria susceptibility zones (MSZ), viz. very low, low, moderate, high and very high (Fig. 4).
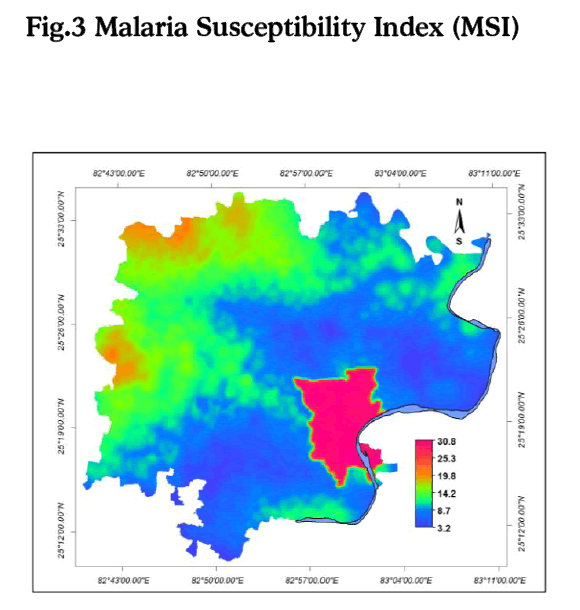
Figure 3: Malaria Susceptibility Index (MSI)
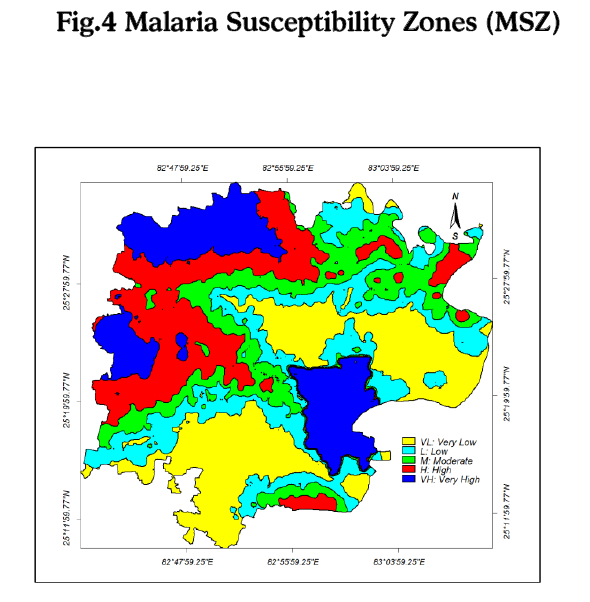
Figure 4: Malaria Susceptibility Zones (MSZ)
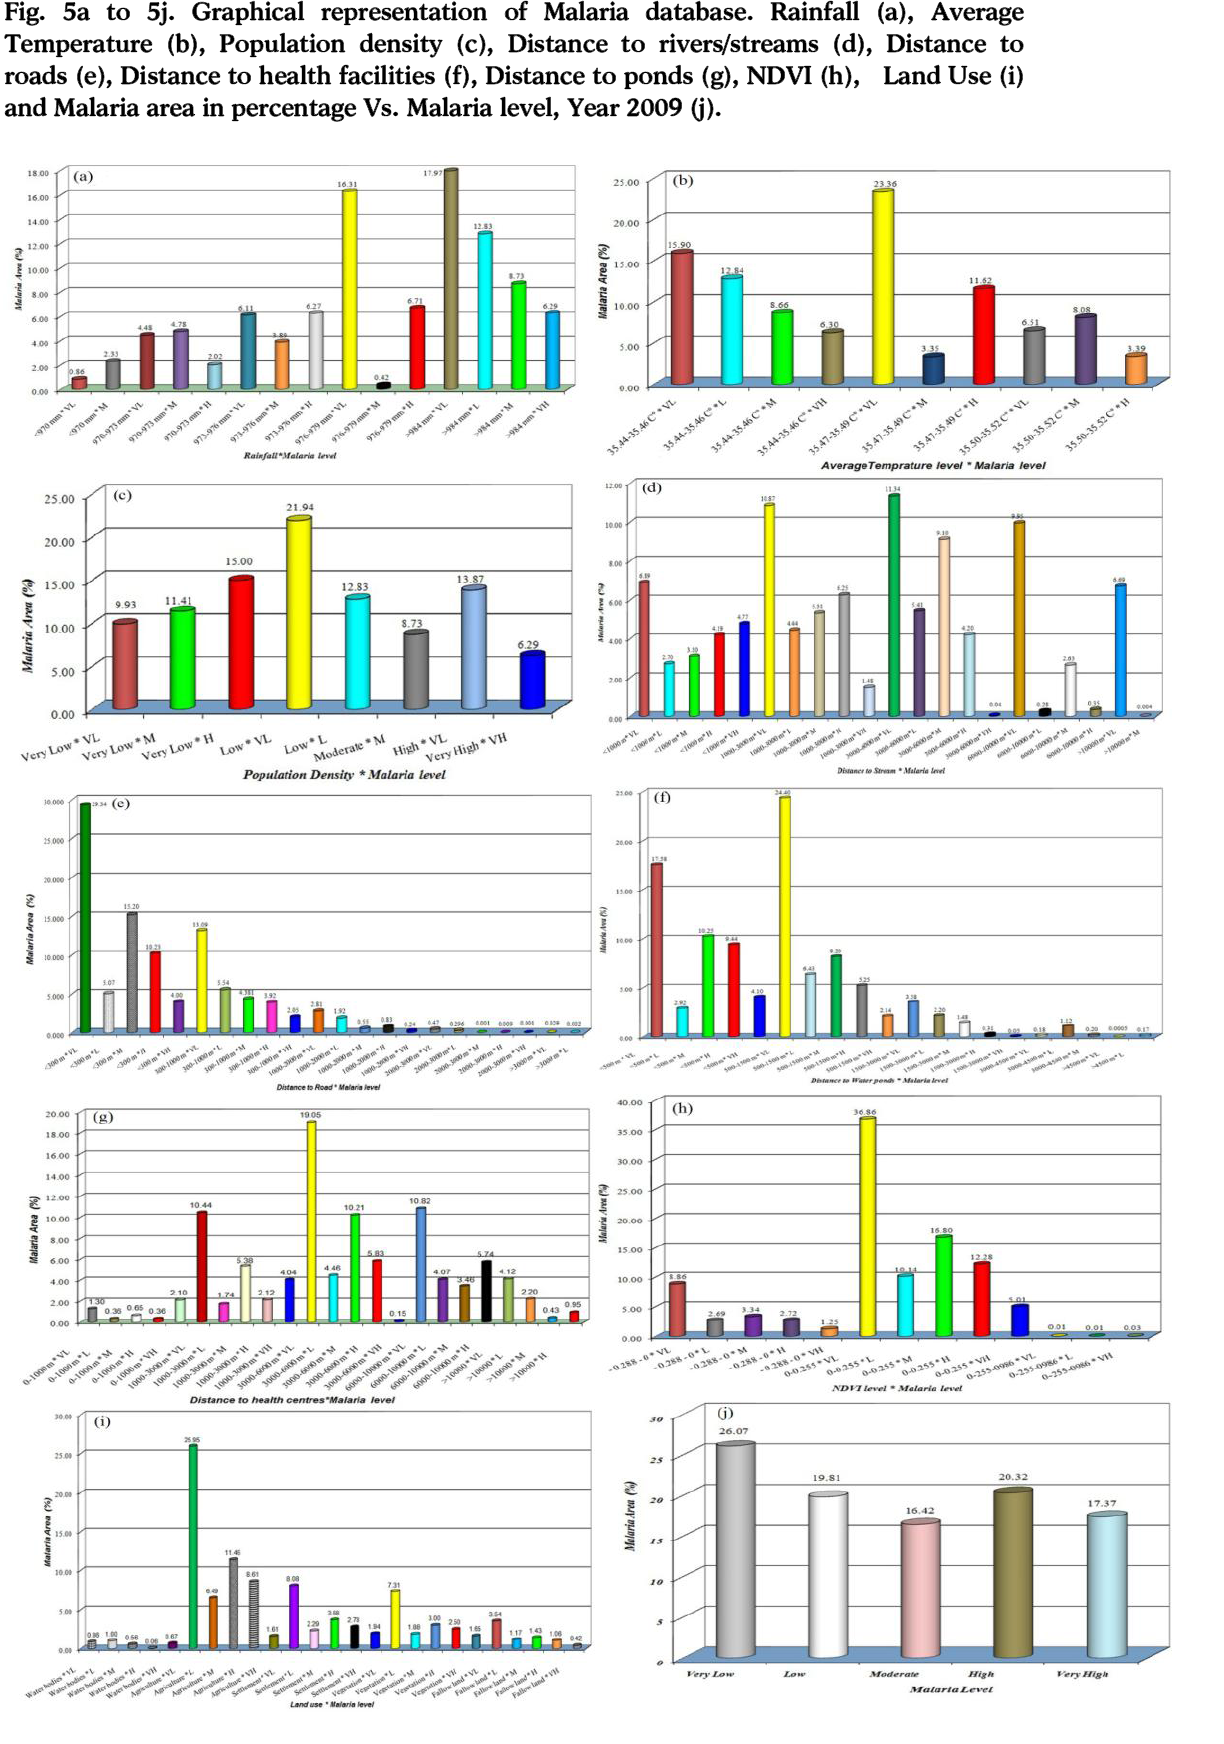
Figure 5a to 5j: Graphical representation of Malaria database. Rainfall (a), Average Temperature (b), Population density (c), Distance to rivers/streams (d), Distance to roads (e), Distance to health facilities (f), Distance to ponds (g), NDVI (h), Land Use (i) and Malaria area in percentage Vs. Malaria level, Year 2009 (j).
M=-1593.04 + (0.62*Pd) + ((-0.663)*Rf) + ((-0.0012)*Dri) + ((0.0019)*Dpo) + (0.0003*Dhf )+ (63.44*Temp.) + (0.119*Lu/Lc) + ((-0.0002)*Dro) + (0.901*NDVI)
Where, M is the occurrence of malaria in each unit.
Then calculated coefficients have been exerted in the matrix of dataset and the equation has been calculated for all of the 38622×9 sample pixels of the study area. Finally column of the equation result for analyzing and creating malaria susceptibility map has been transferred into GIS software (ILWIS 3.4).
Conclusion
From the results, it was inferred that among all parameters, the malaria mosquito proliferation leading to malaria in the study area was found dependent on the major driving parameters and all the parameters directly and indirectly influence for malaria parasites and are important breeding source. In order to carry out multivariate analysis of data and to determine the all parameters responsible for malaria in the study area, a multiple linear regression has been used.
Multiple Linear regression models were built for malaria cases reported in study area, as the dependent variable and various time based groupings of temperature, rainfall and NDVI data as the independent variables. By applying this model in this study, it was found that the closeness of the populated area to drainage structures is an important parameter for malaria vector breeding source. Streams may sometime give adversely affect to those area which are comes under low lying area especially villages and settlement area nearby the Varuna river. 21.64% of the malaria area are closely located within the 0-1000 m buffer zone of the stream in which 8.95% of the malaria area are comes in high and very high categories and 6.88% of malaria are comes in very low categories. 44.7% of malaria area are occurred within <500 m buffer category of ponds and only 0.17% of malaria area exist in the zone of <4500 m buffer category of ponds. In <500 m buffer distance to ponds, 13.53% of malaria area comes in very high and high zones and 20.49% of malaria area comes in very low and low zones. In this study vegetation is often associated with vector breeding, feeding, and resting locations. 81.09% of malaria area comes in 0-0.255 category, which is class of agriculture and fallow land. As the temperature concern, in the study area malaria vectors are basically developed in 35.44-35.46°C category. 43.69% of the malaria area found in this category but in 35.50-35.52 C°, only 17. 98% of malaria area comes in this zone. After interpolation between amounts of annual rainfall in the study area stations, the isohyets map created. Finally this map has been grouped into five classes to prepare the rainfall data layer. Some analyses were performed using land cover and malaria maps to determine the distribution of malaria, according to the land cover classes, the 54.11% of malaria affected area occurred in agriculture area class whereas18.77%, 16.34%, 7.63%, 3.15% of malaria area occurred in settlement, vegetation, fallow land and water bodies categories respectively. It was verified that approximately maximum 45.82 % of the malaria occurred in >984 mm rainfall class. Percentage of malaria area is very much related to distance to health facilities. It is found that, 4.77% of malaria area is belonging to 0-1000 m buffer distance to health facilities and 24.10% of malaria area comes in 6000-10000 m buffer distance. As the distance to health facilities increases, malaria area is also increasing.
3122
References
- Hoek W, Konradson F, Amersinghe PH, Perara D, Piyaratne MK, Amerasinghe FP, Towards a risk map of malaria in Srilanka: the importance of house location relative to vector breeding sites, International Journal of Epidemiology, 2003; 32: 280- 285.
- Greenwood BM, Marsh K, Snow RW, Why some African children develop severe malaria? Parasitol Today, 1991; 7: 277-281.
- Mbogo CNM, Kabiru EW, Gregory EG, Forster D, Snow RW, Khamala CBM, Ouma JH, Githure JI, Marsh, K and Beier JC, Vector related case control study of severe malaria in Kilifi district, Kenya, American Journal Tropical Medical Hygiene, 1999; 60(5): 781-785.
- Gosoniu L, Vounatsou P, Sogoba N, Smith T, Bayesian modeling of geostatistical malaria risk data, Geospatial Health, 2006; 1:127-139.
- Connor SJ, Flasse SP, Perryman AH and Thomson, MC, The contribution of satellite derived information to malaria stratification, monitoring and early warning. World Health Organization mimeographed series, WHO/MAL/1997; 1079.
- Craig MH, Snow RW, Le Sueur D, A climate-based distribution model of malaria transmission in sub-Saharan Africa. Parasitol Today, 1999; 15:105-111.
- Sweeney AW, A spatial analysis of mosquito distribution. GIS User; 1997; 21: 20-21.
- Mitchell A, The ESRI Guide to GIS Analysis, volume 2: Spatial Measurements & Statistics. Redlands, Calif: ESRI Press, 2005.
- Sudhakar S, Srinivas T, Palit A, Kar SK and Battacharya SK, Mapping of risk prone areas of kala-azar (Visceral leishmaniasis) in parts of Bihar state, India: an RS and GIS approach, Journal of Vector Borne Disease, 2006; 43:115–122.
- Lawson, AB, 2001. Disease Mapping: Basic approaches in newdevelopments, in: Maheswaran, R. and Cragilla, M. (Eds.), GIs in public health practice, CRC Press, New York., pp. 31-49.
- Riedel N, Vounatsou P, Miller JM, Gosoniu L, Chizema-Kawesha E, Mukonka V, Steketee RW, Geographical patterns and predictors of malaria risk in Zambia: Bayesian geostatistical modeling of the 2006 Zambia national malaria indicator survey (ZMIS), Malaria Journal, 2010; 9:37.
- Kleinschmidt I, Bagayoko M, Clarke GPY, Craig M, le Sueur D, A spatial statistical approach to malaria mapping. International Journal of Epidemiology, 2000; 29:355-361.
- Boscoe FP, Ward MH, Reynolds P, Current practices in spatial analysis of cancer data: data characteristics and data sources for geographic studies of cancer. International Journal of Health Geography, 2004; 97: 14041-3.
- Donald PA, Wilbert MG, Barbara L, Spatial analysis, GIS and Remote Sensing application in the health, Ann Arbor Press, Chelsea, Michigan, 2006.
- Liebe J, Smith T, Mapping malaria transmission in West and Central Africa. Tropical Medicine Int Health, 2006; 11:1032-46.
- Irigaray C, Ferna´ndez T, El Hamdouni R, Chaco´n J, Evaluation and validation of landslide-susceptibility maps obtained by a GIS matrix method: examples from the Betic Cordillera (southern Spain), Natural Hazards, 2007; 41: 61–79
- Diggle P, Moyeed R, Rowlingson B, Thomson M, Childhood malaria in the Gambia: a case-study in model-based geostatistics, Applied Statistic, 2002; 51:493-506.
- Keating J, Macintyre K, Mbogo C, Githeko A, Regens JL, Swalm C, Ndenga B, Steinberg L, Kibe L, Githure JI and Beier JC, A geographical sampling strategy for studying relationships between human activity and malaria vectors in Urban Africa, American Journal Tropical Medical Hygiene, 2003; 68(3): 357-365.
- Colledge, M, Maxwel, RP and Morse DJ, Geographic Information Systems (GIS) in general practice: a new tool for needs assessment, Journal of Informatics for primary care, 1996; 7-11.


