Morteza A Khafaie1*, Chittaranjan S Yajnik2, Mehdi Mojadam3, Behzad Khafaie4, Sundeep S Salvi5, Ajay Ojha6 and Sharad S Gore7
1Department of Public Health and Environmental Technologies Research Center, School of Health, Ahvaz Jundishapur University of Medical Sciences, Ahvaz, Iran
2King Edward Memorial Hospital Research Center, Pune, Maharashtra, India
3Departement of Public Health, School of Health, Shahid Sadoughi University of Medical Sciences, Iran
4Department of Statistics, Omidieh Branch, Islamic Azad University, Omidieh, Iran
5Chest Research Foundation (CRF), Pune, Maharashtra, India
6Technogreen Environmental Solutions, Pune, Maharashtra, India
7Department of Statistics, University of Pune, Pune, Maharashtra, India
Corresponding Author:
Morteza Abdullatif Khafaie
Head Office of Industrial Relation
Ahwaz Jundishapur University of Medical Sciences
Golestan St., Ahwaz, Khuzestan, 15794_61357, Iran
Tel: 98-61-33362536
E-mail: m.khafaie@live.com
Received date: March 09, 2016; Accepted date: April 11, 2016; Published date: April 18, 2016
Citation: Khafaie MA, Yajnik CS, Mojadam M, et al. Association between Ambient Temperature and Blood Biomarker of Systemic Inflammation in (C-reactive protien) in Diabetes Patients. Arch Med. 2016, 8:3.
Keywords
Air temperature; C-reactive protein; Diabetes patients
Introduction
The association between change in ambient temperatures and health related events has been investigated in several studies [1-3]. However, the mechanisms underlying the temperature-related health effect are still poorly understood. To date, several biomarkers have been reported to be associated with temperature [2]. Many of these markers are implicated in the causal pathway for the development of cardiovascular events, and mortality.
C-reactive protein, is associated with greater risk for adverse CV events [4]. However, the potential for outdoor temperature to affect systemic inflammation (i.e. CRP) as part of the mechanism leading to CV mortality has scarcely been studied [5]. Previously we have shown that air pollution increased the number of inflammatory markers in the circulation [6] and number of metrological variable were important in these association. We therefore studied possible associations between temperature and CRP using data from Wellcome Genetic (WellGen) Study, controlling for personal and environmental confounders.
Material and Methods
Subjects
Type 2 diabetes patients enrolled for Wellcome Genetic (WellGen) study, a clinical based study of genetics of Indian which is ongoing in Diabetes Clinic of the King Edward Memorial Hospital (KEMH), Pune. In brief, type 2 diabetes patients who were not more than 46 years age at time of diagnostic were recruited. Subjects who fulfilled the clinical criteria of fibrocalculous pancreatic diabetes (FCPD), maturity-onset diabetes of the young (MODY), type 1 diabetes, and pregnant women were excluded from the study. The study design and area has been described in detail elsewhere [6,7]. The study was approved by the Institutional Ethics Committee and all patients gave a written informed consent.
Clinical measurements
The patients were appointed for a visit between March 2005 and May 2007. The visits were conducted though out the week except Sunday and national holidays. Patients suffering from acute inter-current illness were reappointed after 4 weeks. At the visit, a standard questionnaire was administrated which provided information regarding medical history, medication intake, and smoking history. In addition clinical examination included measurement of height, weight, waist and hip circumferences were performed. Fasting blood serum sample was drawn to assess C-reactive protein.
Meteorological and air pollution data
The meteorological parameters minimum and maximum air temperature, relative humidity (rh), mean sea level pressure (mslp), dray bulb (dbt) and dew point temperature (dpt) for the city of Pune during the period of the study were obtained from national data center, meteorological department. Arithmetic mean air temperatures were computed from the daily minimum and maximum temperature, also apparent temperature (at) was calculated, as: at = -2.653+(0.994 × dbt)+(0.0153 × dpt^2).
Furthermore, NOX, SOX and PM10 (particulate matter with an aerodynamic profile ≤ 10 μm) from 3 stations situated around city center admissible as per APHEA protocol [8] were used for current study. Missing air pollution data was imputed by linear interpolation technique with respect to nature of missing data (short length of gaps and overlay less than 22% missing variable) [9].
Meteorological and air pollutants parameters for each person’s day of visit or blood collection (lag 0), and upto 5 days before (lag 0 to lag 5) as 24 hours exposure have been computed. Furthermore, moving average of 3 days and 7 days before blood collection were computed as a cumulative exposure.
Statistical analysis
Data was presented as mean (±SD) when normally distributed and median (25th, 75th percentile) when not normally distributed. The plasma CRP needed to be log 10- transformed to fulfil the model assumption of residual normality. Specific confounder models for CRP without meteorological parameter were built separately. Variables considered affecting the average CRP concentration such age, gender, education, Body Adiposity Index (BAI, calculated as (hip )/height^1.5 - 18) [10], medication, duration of diabetes are included. Additionally we adjust for short term time trend (day of week) and long term time trend. Relative humidity and mean sea level pressure with the same day lag and moving average as air temperature terms were used in the models. Final models were built by minimizing Akaik’s Information Criterion (AIC) [11]. After completion of confounder models, the effects of air temperature were investigated using robust linear regression. We present effect estimates as percent changes in CRP for a 5ºC decrease in air temperature. The significance threshold was P=0.05 in all analyses. Sensitivity of our result to possible influence of additional adjustments for air pollutants variable including PM10, NOx, and SO2 were investigated. All statistical analyses were performed using STATA version 11.1 software (STATA Corporation, College Station, TX).
Result
Study Population
The study population comprised 1700 type 2 diabetes patients who fulfilled the inclusion and exclusion criteria and who had results for at least one of blood samples. Table 1 presents the baseline characteristics of the study participants.
| N |
1700 |
| Male sex, n (%) |
943 (55.47) |
| Age (years) |
46.15 (9.20) |
| Body Mass Index (kg/m2) |
26.06 (4.21) |
| Waist-Hip ratio |
0.94 (0.07) |
| Body Adiposity Index |
31.17 (6.59) |
| C-Reactive Protein (mg/L) |
3.59 (1.79, 7.75) |
| Fasting Plasma Glucose (mg/dL) |
153 (125, 203) |
| Hemoglobin(g/dL) |
13.20 (1.83) |
| HbA1c (%) |
8.91 (2.09) |
| Duration of diabetes (yrs) |
7 (3, 14) |
| Current smoking n (%) |
170 (10.06) |
| Current Alcohol usage, n (%) |
345 (20.41) |
| Thiazolidinediones n (%) |
427 (25.12) |
| Statin n (%) |
384 (22.59) |
| Aspirin n (%) |
670 (39.41) |
| SO2 (µg/m3) |
21.81±5.36 |
| NOx(µg/m3) |
39.67±7.63 |
| PM10 (µg/m3) |
114.14±37.20 |
| Relative humidity (%) |
61.19±19.08 |
| Air temperature (°C) |
25.21±3.37 |
| Apparent temperature (°C) |
27.60±4.26 |
| Barometric pressure (hPa) |
1008.69±3.99 |
PM10, particles ≤ 10µm in aerodynamic diameter;SO2, sulfur dioxide; NOx, oxides of nitrogen.
Values are presented as mean ±SD or No (%), except CRP, FPG, and duration of diabetes which presented as median (25th-75thpercentile) |
Table 1: Characteristics of study subject and local levels of environmental variables (air pollutants and meteorological measurment).
Biomarkers
Biomarkers of 1700 collected blood sample, measurements of CRP were available for 1392 patients. Concentrations of biomarkers are shown in Table 1. CRP concentration was significantly associated with fasting plamsa glucose (FPG) (0.13, p<0.01) but not related with Hb concentration (after adjustment for age and gender). FPG and Hb also were inter-correlated (r=0.09, p<0.01).
Metrological and air pollutants data
Meteorological measurements were available for all the days during the study period. Out of the total of 822 days of study, 175 missing air pollution data was imputed. Air temperature was inversely correlated with air pollutants concentration, rs ranging from -0.13 to -0.22 (P<0.001) but positive only with PM10 during monsoon (rs=0.12, P=0.002). Relative humidity showed negative correlations with ambient pollutants, rs ranging from -0.28 to -0.45 (P<0.001) (Table 1).
Regression analysis
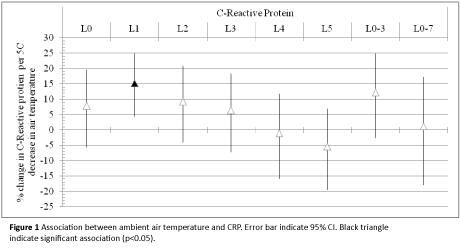
We studied the association between air temperature at lag0-5 and different averaging time periods (3 and 7 days) and concentration of biomarkers (Figure 1). The model and adjustment procedures have been described in the statistical analysis. We found that decrease in ambient air temperature was associated with a significant increase in CRP concentrations. We estimated a 15.26% (CI=4.42% to 24.88%) increase in geometric mean of CRP per 5°C decrease in ambient air temperature (1-day preceding blood collection).

Figure 1: Association between ambient air temperature and CRP. Error bar indicate 95% CI. Black triangle indicate significant association (p<0.05).
Regression analysis
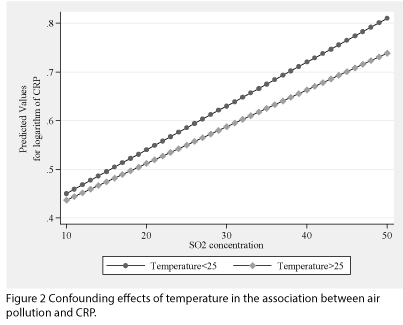
Adjustment for air pollution (i.e. PM10, NOx, and SO2) did not show any significant effect on the results (Figure 2 and supplementary Table 1).

Figure 2: Confounding effects of temperature in the association between air pollution and CRP.
Discussion
More than half of patients had CRP concentrations in the high coronary risk zone (i.e. >3 mg/L). The meteorological factors (temperature and relative humidity) varied with season. The ambient pollutant levels were highest in winter and lowest in monsoon. It would appear that all these factors have a complex effect on circulating CRP which was highest in cool season and lowest in warm season. We showed that levels of air temperature a day preciding blood collection is inversly and significantly associated with CRP concentration and the results were robust to additional adjustment for air pollution
To date, several biomarkers have been reported to be associated with temperature [2]. Many of these markers such CRP [4], Hb (≥17 or <13 g/dL) [12,13], and FPG concentration [14] are implicated in the causal pathway for the development of cardiovascular events, and mortality. However, few studies have investigated the subclinical changes due to air temperature [15-18] also results are inconsitante. For instance unlike our finding which indicate cold stress (lower temperature) could rise CRP, Wilker [18] reported 21.6% (95% CI: 2.5, 44.2; p=0.03) increase in CRP concentration for a 5°C increment in air temperature.
The effect of air pollution on mortality in patients with cardiovascular disease and coexisting diabetes has been shown to be greatest in warm seasons [15]. Short-term effects of air pollution across seasons have not always been well characterized and show inconsistent results [19-23]. Also in our previous study we showed that effect of PM10 was more significant in summer [6]. However we did not observed a seasonal variation in the association for SO2 and NOx. It is unclear whether temperature are confounders or effect modifier of the air pollutants-biomarker association. We found a significant effect of air pollution even in multivariate regression model, after adjustment for temperature and other potential confounding factors. There was no interaction between air pollution and temperature in association with CRP (Supplementary Figures S1 and S2). Therefore we assumed temperature as an important confounding factor and not effect-modifier of air pollution health effect.
The potential of the effect of ambient temperature on levels of systemic biomarkers as part of the mechanism leading to CV mortality has scarcely been studied [3]. It is known that lower temperature is associated with a higher blood pressure [24,25] and an increase of thrombogenic factors, such as C-reactive protein [18]. furthermore CV effects could be mdiated by stimulation of sympathetic nervous activity [26]. Our results suggest that the effects of environmental variables on the cardiovascular system should be investigated in future prospective cohort studies.
Our study is unique in its kind and indicates that change in temperature might lead to increase concentration of CV risk biomarkers (i.e. CRP) suggesting a biological mechanism for the temperature related cardiovascular mortality.
Acknowledgments
The WellGen Study was supported by the Wellcome Trust (London, U.K.). Air pollutants and meteorological data were provided by the Maharashtra Pollution Control Board and Meteorological Department (Pune Office), respectively. No potential conflicts of interest relevant to this article were reported.
M.A.K. researched, wrote, discussed, and edited the manuscript. C.S.Y, S.S.S. and A.O. contributed to the discussion and edited the manuscript. B.K. and S.S.G. contributed to the data analyses and edited the manuscript. The authors acknowledge the contributions of the WellGen Study group and Smita Kulkarni (King Edward Memorial Hospital) in data collection and data management and Dattatray Bhat (King Edward Memorial Hospital) in laboratory measurements.
9582
References
- Tian Z, Li S, Zhang J, Jaakkola JJ, Guo Y (2012) Ambient temperature and coronary heart disease mortality in Beijing, China: a time series study. Environmental health: a global access science source 11:56.
- Kahle JJ, Neas LM, Devlin RB, Case MW, Schmitt MT, et al. (2015) Interaction effects of temperature and ozone on lung function and markers of systemic inflammation, coagulation, and fibrinolysis: a crossover study of healthy young volunteers. Environ Health Perspect 123: 310-316.
- Pattenden S, Armstrong B, Milojevic A, Heal MR, Chalabi Z, et al. (2010) Ozone, heat and mortality: acute effects in 15 British conurbations. Occup Environ Med 67: 699-707.
- Ridker PM (2007) C-reactive protein and the prediction of cardiovascular events among those at intermediate risk: moving an inflammatory hypothesis toward consensus. Journal of the American College of Cardiology 49: 2129-2138.
- Stefanadis C, Toutouzas K, Tsiamis E, Vavuranakis M, Tsioufis C, et al. (2007) Relation between local temperature and C-reactive protein levels in patients with coronary artery disease: effects of atorvastatin treatment. Atherosclerosis 192: 396-400.
- Khafaie MA, Salvi SS, Ojha A, Khafaie B, Gore SS, et al. (2013) Systemic inflammation (C-reactive protein) in type 2 diabetic patients is associated with ambient air pollution in Pune City, India. Diabetes Care 36: 625-630.
- Chandak GR, Janipalli CS, Bhaskar S, Kulkarni SR, Mohankrishna P, et al. (2007) Common variants in the TCF7L2 gene are strongly associated with type 2 diabetes mellitus in the Indian population. Diabetologia 50: 63-67.
- Katsouyanni K, Schwartz J, Spix C, Touloumi G, Zmirou D, et al. (1996) Short term effects of air pollution on health: a European approach using epidemiologic time series data: the APHEA protocol. J Epidemiol Community Health 50 Suppl 1: S12-18.
- Norazian YASMN, Nor AR, Bakri AMMA (2008) Estimation of missing values in air pollution data using single imputation techniques. ScienceAsia 34: 341-345.
- Bergman RN, Stefanovski D, Buchanan TA, Sumner AE, Reynolds JC, et al. (2011) A better index of body adiposity. Obesity (Silver Spring) 19: 1083-1089.
- Akaike H (1973) Information theory and an extension of the maximum likelihood principle.
- Sabatine MS, Morrow DA, Giugliano RP, Burton PB, Murphy SA, et al. (2005) Association of hemoglobin levels with clinical outcomes in acute coronary syndromes. Circulation 111: 2042-2049.
- Tanne D, Molshatzki N, Merzeliak O, Tsabari R, Toashi M, et al. (2010) Anemia status, hemoglobin concentration and outcome after acute stroke: a cohort study. BMC Neurol 10: 22.
- Shaye K, Amir T, Shlomo S, Yechezkel S (2012) Fasting glucose levels within the high normal range predict cardiovascular outcome. Am Heart J 164: 111-116.
- Halonen JI, Zanobetti A, Sparrow D, Vokonas PS, Schwartz J (2010) Associations between outdoor temperature and markers of inflammation: a cohort study. Environ Health 9: 42.
- Hampel R, Breitner S, Rückerl R, Frampton MW, Koenig W, et al. (2010) Air temperature and inflammatory and coagulation responses in men with coronary or pulmonary disease during the winter season. Occup Environ Med 67: 408-416.
- Schneider A, Panagiotakos D, Picciotto S, Katsouyanni K, Löwel H, et al. (2008) Air temperature and inflammatory responses in myocardial infarction survivors. Epidemiology 19: 391-400.
- Wilker EH, Yeh G, Wellenius GA, Davis RB, Phillips RS, et al. (2012) Ambient temperature and biomarkers of heart failure: a repeated measures analysis. Environ Health Perspect 120: 1083-1087.
- Nawrot TS, Torfs R, Fierens F, De Henauw S, Hoet PH, et al. (2007) Stronger associations between daily mortality and fine particulate air pollution in summer than in winter: evidence from a heavily polluted region in western Europe. Journal of epidemiology and community health 61: 146-149.
- Choi JH, Xu QS, Park SY, Kim JH, Hwang SS, et al. (2007) Seasonal variation of effect of air pollution on blood pressure. J Epidemiol Community Health 61: 314-318.
- Diez Roux AV, Auchincloss AH, Astor B, Barr RG, Cushman M, et al. (2006) Recent exposure to particulate matter and C-reactive protein concentration in the multi-ethnic study of atherosclerosis. American journal of epidemiology 164: 437-448.
- Hennessy E (2002) Air pollution and short term mortality. BMJ 324: 691-692.
- Berhane K, Zhang Y, Linn WS, Rappaport EB, Bastain TM, et al. (2011) The effect of ambient air pollution on exhaled nitric oxide in the Children's Health Study. Eur Respir J 37: 1029-1036.
- Li Q, Guo Y, Wei DM, Song Y, Song JY , et al. (2016) Does local ambient temperature impact children's blood pressure? A Chinese National Survey. Environ Health 15: 21.
- Madaniyazi L, Zhou Y, Li S, Williams G, Jaakkola JJ, et al. (2016) Outdoor Temperature, Heart Rate and Blood Pressure in Chinese Adults: Effect Modification by Individual Characteristics. Sci Rep 6: 21003.
- Kawahara J, Sano H, Fukuzaki H, Saito K, Hirouchi H (1989) Acute effects of exposure to cold on blood pressure, platelet function and sympathetic nervous activity in humans. Am J Hypertens 2: 724-726.


