Keywords
Diversity; Rocky estuarine; Structure and composition; Spatial and temporal variation
Introduction
An estuary is a partly enclosed coastal body with constant mixture of marine and freshwater, and dominated by sedimentary material carried from both the open sea and the associated tributaries (Spaccesi and Rodrigues Capitulo, 2012). Estuarine ecosystem has strong seasonal fluctuation in hydrological, morphological and chemical conditions; thus making the adaptability of animals to such a changing environment difficult (McLusky, and Elliot 2004). In addition, hard substrate benthic communities are naturally stressed environments, due to waste water discharges that is close to the estuaries. These waters cause pollution and discourage the settlement of several organisms, that affect these communities thriving in rocky-shores (Arévalo, 2007). Changes in the salinity, the content of organic materials, the depth, the sediment-grain size and the nature of substrate are the most important factors in spatial gradients of benthic invertebrate communities along estuarine (Day et al. 1989; Attrill, and Rundle 2002). In most estuaries of the world, anthropogenic activities such as dredging, shipping, land reclamation, waste drainage from domestic and agricultural activities causes high stress conditions for macroinvertebrates communities (Kiddon et al. 2003). Furthermore, seasonal fluctuations in environmental conditions dramatically influence temporal variation of the macrobenthic communities in estuaries (Reizopoulou, 2014).
The Caspian Sea is rather unique, in that the salinity of the water is much higher than that of freshwater lakes and lower than that of sea water (Karbassi and Nadjafpour, 1996).Many Iranian rivers flowing into the Caspian Sea along southern part and created lengthy estuary zone in this part. Many researchers studied spatial distribution and abundance of soft bottom benthic species throughout estuaries (McLusky, and Elliot 2004; Roohi et al., 2010; Spaccesi and Rodrigues Capitulo, 2012). However, data on information of hard substrate estuaries macroinvertebrates communities in large lakes are scarce.
Benthic fauna are highly correlated with environmental conditions. Organic and nutrient enrichment due to domestic wastes is today one of the main reasons explaining the deterioration of estuaries ecosystems (Flechter, 1996). Hard substrate macrobenthos communities are faced with these waters and affected. The objectives of this work were thus to reveal temporal and spatial changes in the composition of hard substrate macrobenthos communities and identify the environmental conditions that potentially may influence the communities with emphasis on organic and nutrient enrichment.
Materials and Methods
This study was conducted in 5 major estuaries from Caspian Sea basin. Sampling was done seasonally from spring to winter 2014 in the midpoint of each season. Sampling sites were located 100 meter before transition zone from Astra River (S1), Anzali River (S2), Chamkhaleh River (S3), Ramsar River (S4) and Babolsar River (S5) (Figure 1). However, no classical zonation was observed in sampling areas. Macrobenthic communities in all sites were exposed both to air and water spray. In addition, some aquatic plants appear among or above rocky substrates. However, no classical zonation observed in sampling areas. Species area curve method applied for sampling (Sharma, 2005). Therefore, 20×20 cm quadrat (0.04 m2) was performed on rocky substrate to obtain random samples from macrobenthic communities with three replicate and the samples were preserved in 4% formalin. In the laboratory, the macrofauna were sorted, identified up to the species level and counted based on illustrated key books (Birshtain et al., 1968; Kasimov, 2000; James and Covich, 2001) (Figure 1).
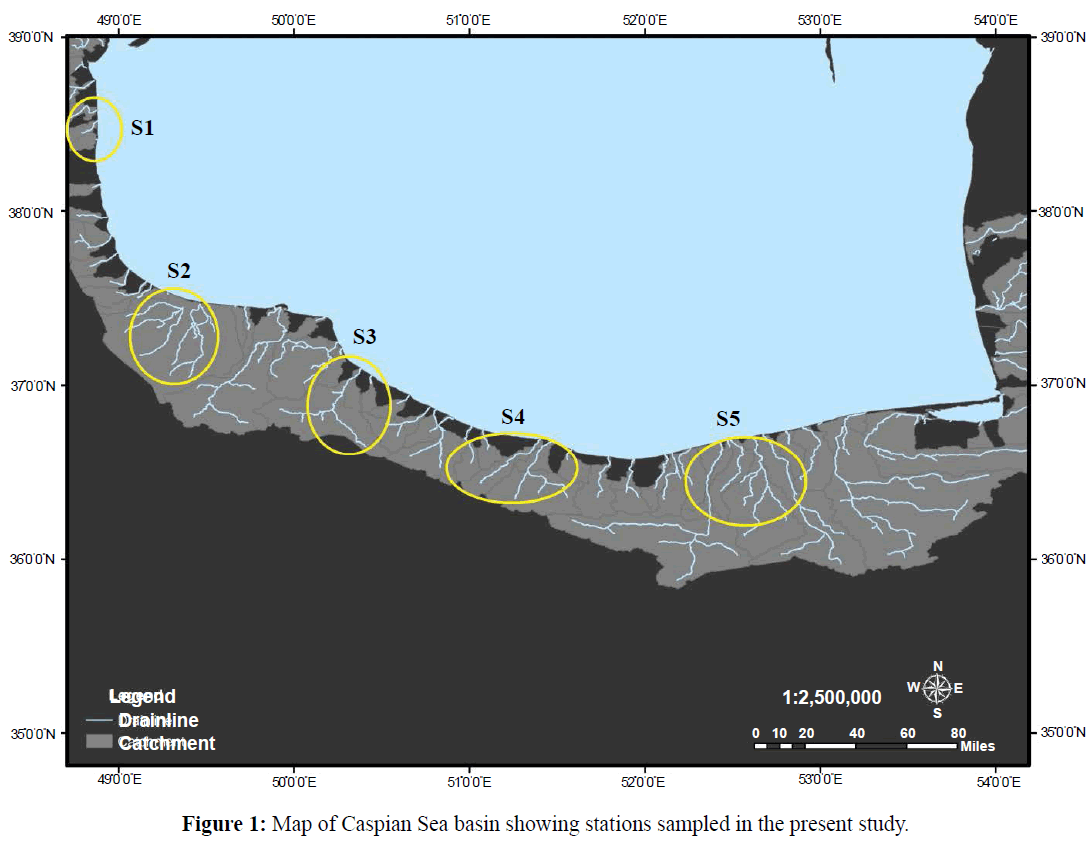
Figure 1: HPLC chromatogram of the nine reference compounds in 50% aqueous methanol, measured at 370nm. Retention times for rutin, sutherlandin A, sutherlandin B, kaempferol-3-O-rutinoside, sutherlandin C, sutherlandin D, quercitrin, quercetin and kaempferol were 11.9, 12.7, 13.8, 15.3, 16.2, 17.0, 18.0, 26.2 and 28.1 minutes, respectively.
Temperature, salinity, dissolved oxygen and pH was measured using the portable multi-meters (HACH 51154, USA) with three replicate in each site. Surface water samples were collected simultaneously from all the selected sampling sites for the analysis of the nutrient contents. Water nutrient concentration was measured according tousing photometric methods. Phosphate was analyzed by a modified ascorbic acid reduction method and silicate was assessed based on calorimeter with the formation of molybdic acid (Strickland and Parsons, 1972). Nitrite was determined by colorimetric and ion chromatographic methods and nitrate was measured based on cadmium-copper reduction to nitrite (Wood et al., 1967).
The non-parametric multidimensional-scaling (nMDS) and similarities (ANOSIM) analyses were used to examine the spatial patterns of macroinvertebrates communities. For parametric analyses the abundance data were square-root transformed to reduce heteroscedasticity before running similarity matrix. Bray-Curtis coefficient used as the measure of similarity. The level of significance was calculated by means 999 permutations between groups. BIO-ENV analysis was used to find the best subset of environmental variables and community-development pattern. Canonical correspondence analysis (CCA) was applied to extracts major gradients among combinations of macrobenthic communities and environmental variables. All the analyses were carried out with R statistical packages Version 3.1.3 (Ihaka and Gentleman, 1996) through vegan package (Oksanen et al., 2007).
Results
Maximum and minimum water temperature observed in S1. The highest value of dissolved oxygen was registered in spring and site S1 while lowest value observed in summer and site S2. Results indicated that all sites had peak water salinity in summer. Water pH was equal in all sites during different seasons. Analysis of water nutrient showed that there was high fluctuation in water nutrient among seasons. However, S1 had lowest fluctuation in nitrate and phosphate. Results of other nutrient were represented in Table 1.
Table 1: Physico-chemical properties of waters in studied area (data represented by Mean ± SD) from spring to winter 2014.
ANOSIM analysis revealed that there was significant difference between benthic community structures and environmental data among the sites (Figure 2). However, R value showed that different between environmental data was not strong. nMDS showed that S1-S3 and S2-S4 were similar in community structure in spring. In summer, S1 and S5 were separated from other sites. Results indicated that S4 and S1 were significantly differenced in macrobenthic community structure from other sites in autumn and winter respectively (Figure 3).

Figure 2: HPLC chromatogram of the nine reference compounds in 50% aqueous methanol, measured at 370nm. Retention times for rutin, sutherlandin A, sutherlandin B, kaempferol-3-O-rutinoside, sutherlandin C, sutherlandin D, quercitrin, quercetin and kaempferol were 11.9, 12.7, 13.8, 15.3, 16.2, 17.0, 18.0, 26.2 and 28.1 minutes, respectively.

Figure 3: HPLC chromatogram of the nine reference compounds in 50% aqueous methanol, measured at 370nm. Retention times for rutin, sutherlandin A, sutherlandin B, kaempferol-3-O-rutinoside, sutherlandin C, sutherlandin D, quercitrin, quercetin and kaempferol were 11.9, 12.7, 13.8, 15.3, 16.2, 17.0, 18.0, 26.2 and 28.1 minutes, respectively.
9 species were identified on the hard substrates at 5 stations. Nereis diversicolor was observed at all stations while Tabanidae hybomitra and Rhithropanopeus harrisii tridentatus were only observed in S4 and S2 respectively. Pontogammarus maeuticus, Balanus improvises, Chironomus albidus and Mytilaster lineatus were observed as high abundant species in S5, S1, S4 and S2-S3 respectively (Table 2).
| Taxa |
Richness % |
| S1 |
S2 |
S3 |
S4 |
S5 |
| Arthropoda |
Pontogammarus maeuticus |
8.807247 |
0.822564 |
1.908397 |
1.977848 |
76.92308 |
| Arthropoda |
Balanus improvisus |
72.01812 * |
6.415998 |
36.25954 |
11.39241 |
0 |
| Arthropoda |
Rhithropanopeus harrisii tridentatus |
0 |
0.22849 |
0 |
0 |
0 |
| Arthropoda |
Simulium kurense |
0.629089 |
0.091396 |
0 |
3.955696 |
0 |
| Arthropoda |
Tabanidae hybomitra |
0 |
0 |
0 |
0.39557 |
0 |
| Arthropoda |
Chironomus albidus |
17.91646 |
2.087484 |
2.453653 |
81.09177 * |
0 |
| Mollusca |
Mytilaster lineatus |
0 |
89.25732 * |
57.57906 * |
0 |
0 |
| Polychaeta |
Nereis diversicolor |
0.629089 |
0.045698 |
0.490731 |
1.186709 |
23.07692 |
| Oligochaeta |
Tubificoides fraseri |
0 |
1.051054 |
1.308615 |
0 |
0 |
| Total |
100 |
100 |
100 |
100 |
100 |
Table 2: Benthic invertebrates on hard substrates at 5 stations in Caspian Sea basin.* shows maximum frequency in each site from spring to winter 2014.
Results of nMDS between species and among sites revealed that Pontogammarus maeoticus and Nereis diversicolor; and Chironomus albidus, Simulium kurense and Tabanidae hybomitra had similar distribution in Caspian Sea basin. However, the stress value was seen to be high for this analysis. In addition, analysis showed that S2 and S3 had the most similarity and S1 and S5 had the most dissimilarity between all sites and Mytilaster lineatus was the important contribution of dissimilarity (Figure 4 and Table 3).
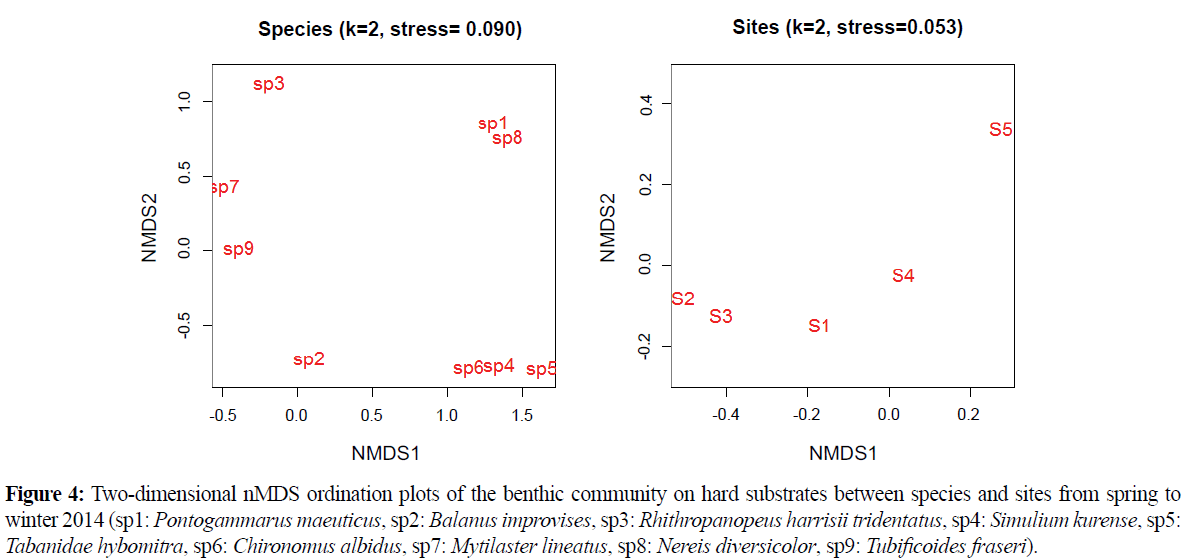
Figure 4: HPLC chromatogram of the nine reference compounds in 50% aqueous methanol, measured at 370nm. Retention times for rutin, sutherlandin A, sutherlandin B, kaempferol-3-O-rutinoside, sutherlandin C, sutherlandin D, quercitrin, quercetin and kaempferol were 11.9, 12.7, 13.8, 15.3, 16.2, 17.0, 18.0, 26.2 and 28.1 minutes, respectively.
| Species |
% contribution |
| 1 vs. 2 |
1 vs. 3 |
1 vs. 4 |
2 vs. 3 |
2 vs.4 |
3 vs. 4 |
1 vs.5 |
2 vs.5 |
3 vs. 5 |
4 vs. 5 |
| Pontogammarus maeoticus |
7.15 |
8.86 |
13.78 |
8.55 |
4.92 |
6.75 |
22.29 |
8.19 |
9.69 |
14.83 |
| Balanus improvisus |
17.51 |
25.80 |
30.23 |
27.61 |
9.14 |
18.54 |
44.55 |
17.28 |
27.93 |
35.66 |
| Rhithropanopeus harrisii tridentatus |
--- |
--- |
--- |
--- |
--- |
--- |
--- |
--- |
--- |
--- |
| Simulium kurense |
--- |
--- |
6.37 |
--- |
3.90 |
--- |
--- |
--- |
--- |
--- |
| Chironomus albidus |
10.26 |
9.10 |
41.58 |
9.81 |
23.97 |
23.39 |
18.58 |
7.56 |
--- |
35.83 |
| Mytilaster lineatus |
58.03 |
49.12 |
--- |
42.28 |
50.22 |
40.69 |
--- |
58.50 |
50.87 |
--- |
| Nereis diversicolor |
--- |
--- |
--- |
--- |
--- |
3.52 |
12.75 |
|
4.69 |
7.56 |
| Tubificoides fraseri |
--- |
--- |
--- |
5.47 |
--- |
--- |
--- |
--- |
--- |
--- |
| Average of dissimilarity |
79.77 |
76.94 |
64.32 |
47.78 |
76.94 |
76.86 |
70.23 |
93.50 |
88.79 |
88.38 |
Table 3: SMIPER analysis of dissimilarity between seasons based on species abundance.
According to BIO-ENV analysis, nitrate, silicate and temperature were the best variables (r=0.3604) for explaining changes in the abundance over time of the hard-substrates benthic fauna under study (Table 4).
| Factors |
Size |
Correlation |
| T |
1 |
0.2725 |
| Nta, T |
2 |
0.3460 |
| Nta, Si, T |
3 |
0.3604 * |
| Nta, Nti, Si, T |
4 |
0.3592 |
| Nta, Nti, Si, T, O |
5 |
0.3434 |
| Nta, Nti, Si, T, S, O |
6 |
0.3330 |
| Nta, Nti, Si, T, S, O, pH |
7 |
0.3154 |
| Nta, Nti, P, Si, T, S, O, pH |
8 |
0.2706 |
Table 4: BIO-ENV analysis for various sets of Spearman’s correlations between environmental variables and abundances of taxa from spring to winter 2014. * shows maximum correlation. Nta: nitrate, Nti: nitrite, Si: silicate, P: phosphate, T: temperature, S: salinity, O: oxygen.
Table 5 shows results of ANOVA of the CCA and test of the significance of each factor and Figure 5 shows plot from these results. Results indicated that silicate, nitrate, nitrite and temperature were the most important significant factors based on CCA analysis. However, the position of species in CCA plot revealed that Balanus improvises and Tubificoides fraseri associated with silicate, Mytilaster lineatus and Rhithropanopeus harrisii tridentatus associated with nitrate and others associated with oxygen in Caspian Sea basin (Figure 5).
| Factors |
P value |
| Na |
0.020** |
| Nit |
0.082* |
| P |
0.531 |
| Si |
0.003*** |
| T |
0.058* |
| S |
0.806 |
| O |
0.112 |
| pH |
0.679 |
Table 5: Summary of permutation (999 times) test for CCA under reduced model; Na: nitrate, Nti: nitrite, Si: silicate, P: phosphate, T: temperature, S: salinity, O: oxygen; ‘***’ 0.01, ‘**’ 0.05, ‘*’ 0.1.

Figure 5: HPLC chromatogram of the nine reference compounds in 50% aqueous methanol, measured at 370nm. Retention times for rutin, sutherlandin A, sutherlandin B, kaempferol-3-O-rutinoside, sutherlandin C, sutherlandin D, quercitrin, quercetin and kaempferol were 11.9, 12.7, 13.8, 15.3, 16.2, 17.0, 18.0, 26.2 and 28.1 minutes, respectively.
Discussion
This study is the first report for hard substrate macroinvertebrates communities in Southern Caspian Sea basin. Therefore data for comparison in this region is scarce. However, the number of identified taxa in this study coincided with results of other studies in Caspian Sea. Taheri and Foshtomi (2011) identified six species of macrofauna at Noor coast, South Caspian Sea, Iran and Kasymov (1989) found 9 species in the Baku Bay, Azerbaijan. Although a lot of species of macrofauna were reported in the Caspian Sea (Birshtein et al., 1968; Kasymov, 1994). Analysis showed that the biodiversity of the studied area is low. Lower biodiversity in Caspian Sea in comparison to other regions were also reported by Taheri et al. (2012) in Caspian Sea (Gorgan Bay). In fact, Caspian Sea is 2.5 times lower than the Black Sea and 5 times lower than the Barents Sea (Zenkevich 1963). Therefore, salinity is too high for true freshwater species and very low for marine origin species. In addition, Results of this study showed that seasonal variation in salinity is too high, which create harsh conditions for estuarine species (from 0.29 in winters to 12.31 ppt in summer, Table 1). However, analysis revealed that salinity was not major factor in distribution of hard substrate macroinvertebrates, but salinity is most important factor in limiting distribution of subtidal macrobenthos in permanently open and temporarily open/closed estuaries (Teske and Wooldridge, 2003).
Results showed that different species were dominant in each site. In terms of phylum, S1, S4 and S5 were dominated by Arthropoda and S2 and S3 by Mollusca. Results of this study showed that Arthropoda and Mollusca is the principal component of the rocky shore fauna in Caspian Sea basin. Many researchers cited Arthropoda or Mollusca as frequent species in hard substrate communities in different regions. Stewart et al. (1998) reported Arthropoda, Annelida and Mollusca as abundant hard substrate taxa in Western Lake Erie. Chintiroglou et al. (2005) stated that polychaetes, mollusks and crustaceans are dominant taxa in the community structure of hard substrate of Aegean Sea and Spaccesi et al. (2012) reported that Limnoperna fortunei (Mollusca) is dominant species in benthic communities on hard substrates of the Río de la Plata Estuary. Furthermore, Janiak and Osman (2012) declared that Palaemonetes pugio (Arthropoda) a common species found associated with hard substrate habitats in Chesapeake Bay. Substrate specification is a major factor in macroinvertebrates habitat selection (Shearer et al., 2015). Pilotto et al. (2015) stated that Bithynia tentaculata (Mollusca) was associated with hard substrates and this association probably is related to its feeding behavior. ANOSIM analysis showed that there was a significant difference between sites in terms of environmental data. This could be the main reason for the difference between the macrobenthic communities among sites in this study. However, habitat type and water velocity are important factors in spatial distribution of hard substrate macroinvertebrates which not considered in this study.
BIO-ENV analysis revealed that macroinvertebrates community had best correlation with nitrate, silicate and temperature. Therefore, seasonal variation between sites could be explained by these factors. Temperature proved to be high important factor in settlement benthic invertebrates on hard substrates (Spaccesi et al., 2012). In addition, Lamptey and Armah (2008) reported that salinity, conductivity, water depth, water temperature, silicate, nitrate, phosphate and sulfate influenced the abundance patterns of the macrobenthic fauna in Tropical Hypersaline Coastal Lagoon in Ghana, West Africa.
Figure 3 showed that S5 was separated in nMDS analysis from other sites in spring. There was not high differentiation in nitrate, silicate and temperature between S5 and other sites in this season. But salinity was lowest in S5 in spring in comparison with other sites. In summer, S1 and S5 had maximum dissimilarities with other sites. Table 1 show that maximum degree of temperature was registered in these two sites. In autumn, maximum amounts of silicate were registered in S4 and minimum amounts of nitrate were registered in S1. Results of SIMPER analysis showed that Balanus improvises and Mytilaster lineatus were the most important contributions in dissimilarities between sites. The settlement behavior of B. improvises has been studied with regard to varying environmental conditions (Berntsson and Jonsson 2003; Jonsson et al. 2004) and different surface properties (Dahlström et al. 2000; 2004; Pinori et al. 2011). According to Karpinsky (2010) Mytilaster settlements are extensive, on areas with strong bottom currents, although they do not have a uniform density. Results of this study were also showed that all macroinvertebrates had not uniform spatial distribution and sites were dominated by different species. Pontogammarus maeoticus and Nereis diversicolor had similar distribution in all studied area (Figure 4). This kind of similarity was also repeated for Chironomus albidus, Simulium kurense and Tabanidae hybomitra. These three species are belongs to Diptera order with similar ecological behaviors. P. maeoticus (Amphimpoda) and N. diversicolor (Polychaete) belongs to different order and have not same ecological niche but they have same feeding behavior (deposit feeding, Kotta and Ólafsson, 2003) and a predator's functional response (Abrams et al., 1990). Kotta and Ólafsson (2003) declared that one plausible explanation is that the polychaetes and amphipods are competing for food resources as both species are deposit feeding animals and therefore may share the same food resources. In addition, Abrams et al., 1990 stated that a decrease in prey density (Pontoporeia affins amphipod) might require more searching, which could expose Harmothoe sarsi (polychaete) to additional mortality through predation and decreasing density.
In conclusion, this study showed that macroinvertebrates of hard substrate communities have spatial and temporal variation in Caspian Sea basin. These fluctuations were conducted by environmental factors. The most important factors responsible for changes were temperature, nitrate and silicate in this region. However, lack of research of benthic fauna with habitats on hard substrates in estuarine of Caspian Sea basin makes prediction difficult. Furthermore, association of spatial and temporal variation of macroinvertebrates with environmental factor was evidence in this study.
9872
References
- Abrams, P.A., Hill, C., Elmgren, R. (1990) The functional response of the predatory polychaete, Harmothoesarsi, to the amphipod, Pontoporeiaaffinis. Oikos, 59, 261-269
- nArévalo, R., Pinedo, S., Ballesteros, E. (2007) Changes in the composition and structure of Mediterranean rocky-shore communities following a gradient of nutrient enrichment: descriptive study and test of proposed methods to assess water quality regarding macroalgae.Marine Pollution Bulletin, 55, 104-113
- nAttrill, M., Rundle, S. (2002).Ecotone or ecocline: ecological boundaries in estuaries. Estuarine, Coastal and Shelf Science, 55, 929-936
- nBerntsson, K.M., Jonsson, P.R., (2003). Temporal and spatial patterns in recruitment and succession of a temperate marine fouling assemblage: A comparison of static panels and boat hulls during the boating season. Biofouling,19,187-195
- nBirshtain, Y.A.,Vinogradova, L.G., Kondakov, N.N., Koon, M.S., Astakhova, T.V et al. (1968) Invertebrate Atlas Caspian Sea, Industry Food, Moscow, Russia
- nBirshtein, Y.A., Vinogradov, L.G., Kondakov, N.N., Astakhova, M.S., Romanova, N.N. (1968) Atlas of invertebrates of the Caspian Sea. Moscow: PishchevayaPromyshlennost
- nChintiroglou, C., Antoniadou, C., Vafidis, D.,Koutsoubas, D. (2005)A review on the biodiversity of hard substrate invertebrate communities in the Aegean Sea.Mediterranean Marine Science, 6, 51-62
- nSpaccesi, F.G., Rodrigues Capitulo, A. (2012) Benthic communities on hard substrates covered by Limnopernafortunei Dunker (Bivalvia, Mytilidae) at an estuarine beach (Río de la Plata, Argentina). Journal of Limnology, 71, 144-153
- nDahlström, M., Jonsson, H., Jonsson, P.R., Elwing, H. (2004) Surface wettability as a determinant in the settlement of the barnacle BalanusImprovisus (DARWIN).Journal of Experimental Marine Biology and Ecology,305, 223-232
- nDay, J.R., Hall, J.W., Kemp, W.M., Yañez-Arancibia, A. (1989) Estuarine Ecology. J. Wiley, and Sons, New York
- nIhaka, R., Gentleman, R. (1996) R: a language for data analysis and graphics. Journal of Computational and Graphical Statistics, 5, 299-314
- nJames, H.T., Covich, A.P. (2001) Ecology and Classification of North American Freshwater Invertebrates, Academic press, 2nd edition
- nJaniak, D.S., Osman, R.W. (2012) Experimental Effects of the Grass Shrimp, Palaemonetespugio, on Hard-Substrate Communities in Chesapeake Bay and an Adjacent Coastal Bay, USA. Estuaries and Coasts, 35, 1128-1136
- nJonsson, P.R., Berntsson, K.M., Larsson, A.I. (2004) Linking larval supply to recruitment: Flowmediated control of initial adhesion of barnacle larvae. Ecology,85, 2850-2859
- nKarbassi, A.R., Nadjafpour, S. (1996) Flocculation of dissolved Pb, Cu, Zn and Mn during estuarine mixing of river water with the Caspian Sea. EnvironmentalPollution, 93, 257-260
- nKarpinsky, M.G. (2010) Review: the Caspian Sea benthos: unique fauna and community formed under strong grazing pressure. Marine Pollution Bulletin, 61, 156-161
- nKasimov, A.G. (2000) Methods of Monitoring in Caspian Sea, QAPPPOLIQRAF, Azerbaijan
- nKasymov, A.G. (1989) Abundance of zooplankton and zoobenthos in Baku Bay, Caspian Sea. Oceanology, 28, 524-526
- nKasymov, A.G. (1994) Ecology of the Caspian Lake. Baku: Azerbaijan Publishing
- nKiddon, J.A., Paul, J.F., Buffum, H.W., Strobel, C.S., Hale, S.S., Cobb, D., Brown, B.S. (2003) Ecological condition of US Mid-Atlantic estuaries, 1997-1998. MarinePollutionBulletin,46, 1224-1244
- nKotta, J., Ólafsson, E., 2003. Competition for food between the introduced polychaeteMarenzelleriaviridis (Verrill) and the native amphipod MonoporeiaaffinisLindström in the Baltic Sea. Journal of Sea Research, 50,: 27-35
- nLamptey, E., Armah, A.K. (2008)Factors affecting macrobenthic fauna in a tropical hypersaline coastal lagoon in Ghana, West Africa. Estuaries and Coasts, 31, 1006-1019
- nMcLusky, D.S., Elliott, M. (2004) The Estuarine Ecosystem: ecology, threats and management. New York: Oxford University Press Inc. 3rd ed
- nOksanen, J., Kindt, R., Legendre, P., O’Hara, B., Stevens, M.H.H. et al. (2007) The vegan package. Community ecology package, 10
- nPilotto, F., Bazzanti, M., Di Vito, V., Frosali, D., Livretti, F. et al. (2015) Relative impacts of morphological alteration to shorelines and eutrophication on littoral macroinvertebrates in Mediterranean lakes. FreshwaterScience, 34, 410-422
- nPinori, E., Elwing, H., Berglin, M. (2011) The impact of coating hardness on the anti-barnacle efficacy of an embedded antifouling biocide. Biofouling, 29, 763-773
- nReizopoulou, S., Simboura, N., Sigala, K., Barbone, E., Aleffi, F. et al. (2014) Assessing the ecological status of Mediterranean coastal lagoons using macroinvertebrates. Comparison of the most commonly used methods. Mediterranean Marine Science, 15, 602-612
- nRoohi, A., Kideys, A. E., Sajjadi, A., Hashemian, A., Pourgholam, R. et al. (2010) Changes in biodiversity of phytoplankton, zooplankton, fishes and macrobenthos in the Southern Caspian Sea after the invasion of the ctenophore Mnemiopsisleidyi. BiologicalInvasions, 12, 2343-2361
- nShearer, K.A., Hayes, J.W., Jowett, I.G., Olsen, D.A. (2015) Habitat suitability curves for benthic macroinvertebrates from a small New Zealand river.New Zealand Journal of Marine and Freshwater Research, 49, 178-191
- nStewart, T.W., Miner, J.G., Lowe, R.L. (1998) Macroinvertebrate communities on hard substrates in western Lake Erie: structuring effects of Dreissena. Journal of Great Lakes Research, 24, 868-879
- nTaheri, M., Foshtomi, M.Y.(2011) Community structure and biodiversity of shallow water macrobenthic fauna at Noor coast, South Caspian Sea, Iran. Journal of the Marine Biological Association of the United Kingdom, 91, 607-613
- nTaheri, M., Foshtomi, M.Y., Noranian, M., Mira, S.S. (2012)Spatial distribution and biodiversity of macrofauna in the southeast of the Caspian Sea, Gorgan Bay in relation to environmental conditions.Ocean Science Journal, 47, 113-122
- nTeske, P.R., Wooldridge, T.H., (2003). What limits the distribution of subtidalmacrobenthos in permanently open and temporarily open/closed South African estuaries? Salinity vs. sediment particle size.Estuarine Coastal and Shelf Science, 57, 225-238
- nWood, E.D., Armstrong, F.A.J., Richards, F.A. (1967)Determination of nitrate in sea water by cadmium-copper reduction to nitrite. Journal of the Marine Biological Association of the United Kingdom, 47, 23-31.
