Keywords
Breast cancer; 3-D finite element; Elastography; Strain analysis
Introduction
The breast consists of many different layers of tissues mostly glandular and fat which give the breast soft uniformity. Many changeable factors such as age, menstrual cycle, pregnancy/ lactation, hormone therapy and menopause have profound impacts on tissue’s structure and morphology. Worldwide, the most well-known female disease is breast cancer. At present, roughly influencing 1.38 million women for each year. It is considered the second reason for diseases of women. It is surpassed just by lung tumor and records for around 25.2% of all growth in women [1]. Their estimation and survival rates depend generally on the sort and stage of breast cancer. It is considered the most popular cancer diagnosed among US women. The female breast cancer death rate is disciplined by means of 38% from its peak in 1989 to 2014 due to improvement in early detection and treatment [2]. Early detection of breast cancer is considered one of the most important issues in therapeutic breast cancer. It is leading to a more successful treatment and change of the survival rate [3].
While, surgical biopsy is the reference procedure of histological evaluation for breast diseases but as the same time, it is invasive method. Noninvasive detection approaches turns out to be substitutional which are mammography, magnetic resonance imaging (MRI) and Ultrasound (US). The problems of those techniques are sometimes turn out negative, longer time needed, high cost, lower sensitivity and some non-pronounced carcinomas missed. So, new proposed approach is needed. One of this modern non- invasive tools is 3-D finite element (FE) in elastography depending on tissue discrimination. It has been applied as aided process to enhance the differentiation accuracy between normal and mass tissues.
Elastography was developed in the late 1980s to early 1990s to improve ultrasonic imaging [4-6], inspired researchers developing elastography based on MRI [7-10] and optical coherence tomography [11-13]. Many researchers are currently creating methods to visualize distinctive mechanical property utilizing harmonic, transient and quasistatic elastographic imaging technique [14]. Differentiation between benign and malignant in breast tissue depends on several biomechanical properties of soft tissues as viscosity [15,16], shear modulus [17] and nonlinearity [18], that plays the backbones of several clinical and pre-clinical applications, aid improving the diagnostic valuable of elastography [19].
This paper shows the FE analyses capabilities to obtain results as accurate as possible for breast cancer detection algorithm using the features of ANSYS (ANSYS, Inc. Southpointe 275 Technology Drive Canonsburg, PA 15317). It is one of the most leading powerful commercial finite element packages in the world. FE is the corner stone in very large number of fields.
The next works show the widespread of FE simulation in deformable soft tissue generally and breast especially using biopsy [20] or (MR) data [21-23], or elastography [3,24-26].
In this work, we focus on the application of FE in breast cancer detection based on real cases of elastography. Building simple model for each real case using B mode data of elastography and apply the classifier equation on the result of the models.
Details Experimental
Materials and procedures
Sometimes, it is difficult to predict any structural behavior in a reliable way and verifying the obtained solution without experimental or analytical results are available. While realization is the main advantage of FE for studying many practical Problems, this technique is used entirely to evaluate the results obtained prior from Sayed et al. [27,28]. This method will help doctors and surgeons in the speed of diagnosis and determination of the nature of the tumor.
The model
Because of highly variability and deformation of the breast shapes, a simple model has built using the module of static structural mechanics. It relates measured strain and the variant applied force with three main steps of FEM [29].
Step 1: Preprocessing: Geometry building -Material properties. Meshing: Create Nodes and Elements- Assemble elements to represent the entire problem - Apply boundary conditions and loads.
Step 2: Analysis: Interpolation equations are formulated to define the field variation over the domain of the finite element at the nodal connections of the field variable. Then, solve those equations simultaneously to obtain nodal results.
Step 3: Post processing: Obtain other important information as stress- strain curves.
The model is built with benign or malignant tumors based on the following conditions.
Modeling design and governing equations
In a previous work involving four healthy volunteers with benign and five volunteers with Malignancies at the Betty Puskar Breast Care Center, West Virginia University aged range from 39-64 years [27,28], kept track of a biopsy on the same day confirming the study results. Table 1 illustrates the number and masses types for all volunteers.
| Patient number |
Mass type |
|
| -(2) |
Fibro adenomas |
Benign |
| -(2) |
Fibrocystic |
| -(1) |
Fibro adipose |
Malignant |
| -(4) |
Invasive ductal carcinoma |
| -(1) |
Invasive lobular carcinoma |
Table 1: The number and masses types for all volunteers.
A model are applied for each patient. In the concerned models, geometric parameters, listed in Table 2, are used to build up the model in 3D for the nine cases based on available data. Figure 1 illustrates the 3-D FE model that is constructed using Ansys Static Structural- Design Modeler. For simplicity, we use the same geometric dimensions of that model in all cases.
| Geometry Parameter |
Values |
| Radius of breast |
50 |
Mm |
| Radius of normal gland |
1.57 ~ 5.8 |
Mm |
| Radius of mass |
1.57 ~ 5.8 |
Mm |
| Volume of fixed table |
8284.7 |
mm3 |
| Surface area of fixed table |
13421 |
mm2 |
| Surface contact probe |
619.21 |
mm2 |
Note: masses and its normal background glands volumes and positions respectively are variant for each case(Sayed, Layne et al. 2013)and(Sayed, Layne et al. 2014)
Table 2: Geomatric Parameters.

Figure 1: FEM model used for all volunteers.
It is used for each case with different dimensions and positions for masses and its normal background tissues.
The results are acquired after applying boundary conditions, plotting the force – strain difference curves, between suspected areas compared to its normal background. Those curves are fitted to calculate the nonlinear parameter of power equation. The results of this study according to applied boundary conditions are compared to the results of the original contribution, (Sayed, Layne et al. 2014) [28]. We calculate a relative error of this comparison to show how far away from the reference results.
The FE technique divides the model geometry to elements, connected with nodes which change according to the element type. Mathematically, a set of linear algebraic equations that represent the elements equations, control the elements behavior, in matrix form as follows:
(F)=(U)*(K) -(1)
Where (F) represents the effect of all external forces applied to the elements, reflecting loads and the boundary conditions. (U) is the nodal displacements of the element, and (K) is the element stiffness matrix. Mathematically, through solving Eq. (1) the solution stage makes the procedures for calculating nodal displacements (U).
Modeling non-linear mechanical measurements of material proprieties
Many researchers devoted their efforts to determine the biomechanical properties of the breast tissues. Krouskop et al. [19] and Sarvazyan et al. [30] participated in calculation average values of Young’s modulus for fat, glandular tissue, and cancer tissue.
Exponential curves have been used for several different tissue types [31]. They are used to describe the stress-strain properties of breast tissues, obtained from uniaxial experimental loading of breast tissue [18,20]. Figure 2 shows the idea of highly difference of mechanical proprieties between soft tissue and hard tissue under applying force F. Generality, most biological tissues have behavior of both an elastic response and a gelatinous (velocity dependent-mainly velocity due to gravity), however since our model is only concerned with the slow displacements.

Figure 2: Breast under compression.
All tissues involved in the breast can be considered: - Incompressible [31].
- Homogeneous [30].
- To have non-linear elastic properties [32].
- Isotropic [20,33].
To describe a material model, the experimental curves have fitted describing the property of the material in the body matrix (K). To calculate the nominal stress- strain data of scoped tissues of our model, we use the nonlinear equation.
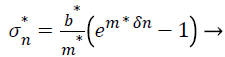 (2)
(2)
The previous exponential curve allows us to calculate and draw the stress-strain curves for all material inserted in Table 3 depending on their constants m*and b* [18] Figures 3a and 3b shows stress-strain curves for the materials ,which were regenerated from Wellman et al. , noted that IDC applies on the same curve of fibro adenoma using the equation (2),while the author had drawn those handwriting materials curves faraway [18].
| Material properties |
|
| Fat |
(7.4, 4460 respectively) |
| Gland |
(12.3, 15174.5 respectively) |
| Fibro adenoma |
(20.0, 37572.4 respectively) |
| Infiltrating Ductal Carcinoma (IDC) |
(19.9 , 37958.7 respectively) |
| Ductal Carcinoma(DC) in situ |
(24.4, 55776 respectively) |
| Lobular Carcinoma (LC) |
(20.9 , 28269.6 respectively) |
Table 3: Ther exponential curve to calculate and draw the stressstrain curves for all material inserted depending on their constants m*and b*.

Figure 3a: Curves for material proprieties.

Figure 3b: Curve for fat proprieties.
3-D Modeling procedures and meshing domain
To increase model realization and accuracy designing simulation in 3D is necessary. For simplicity we use only one layer for the breast modeling. The contact pair, the area where contact occurs during the deformation of our model. We’ve identified potential contact surfaces, via contact and target elements which related with each other by a shared real constant set, which make track the kinematics deformation process. It was included between the breast and the table which used as fixed support, allow sliding between surfaces. Contact objects: to reduce contact penetrations of Surface-to-surface elements, the augmented Lagrange algorithm was activated.
To fill the gap may have occurred between the contact and target, the table and the breast respectively, and allow sliding, we use the contact pair of frictional - table to breast with a friction coefficient of 0.001 and activating the augmented Lagrange algorithm to avoid contact penetrations [34]. While, tissue behavior can be described by many strain energy function, [35]. Hyperelastic material, with typical strain-stress curves of different kinds of breast tissue is included , this assumption was based on the study as described in the material figures [18]. As result of it, nonlinearity as large deformations are involved.
The main factor of highly accuracy is element size in meshing domain while sufficient number of elements and nodes as shown in Figure 4, in which we can have a tradeoff with computational time needed, therefore to achieve well fitted model and flexibility of complex and irregular object.

Figure 4: (a) Number of elements=2033, (b) Number of elements=26080.
The used element type in ansys workbench to fill out our object, to predict the internal characteristics of normal and cancerous organ, that was used to implement the following Conditions:
(1)compatible with the state of the problem, that is structural.
(2)3D geometry, by 3D degrees of freedom.
(3)Behavior of the element, e.g. deflection, plasticity, etc., as there are a preferred element types for a specific application type, our main behavior here is deflection.
(4) The models were meshed with 10-node tetrahedral. A remeshing was used to refinement the model while nonlinear adaptive region process occurs.
Boundary conditions and loads
Usually, using the US probe as an imaging tool and a compression tool on the breast, respectively. Using the fixed table on the stage supporting the compressed breast.
Next steps are correspond to the actual breast compression: - Area (A1) acts as the area of probe as shown in Figure 1, producing pressure while applying uniaxial force on it generating contact area between the probe and the breast which modeled as frictionless considered that ultrasound gel extends no friction.
-Determining the force direction after imaging the masses. Always using the vertical direction on the breast producing static displacements and deformation.
-we considered the supporting table as fixed support, no degree of freedom , and the flat one side of 3d model as fixed representing the rib cages.
-Post processing procedures depend mainly on the accuracy of generated meshed elements.
Figure 5 (with permission) [27] shows how used three precompression force labeled f1, f2 and f3, large deformation can occur rapidly so we divided in our boundary condition the load to be 5 steps to get more how know of the system including the subset level force named 5N,10N,20N,30N,40N (Newton) helping avoiding rapidly deformation. The program divides those load steps to much smallest force values, applying strain theory in each step respectively, from one iteration to another.

Figure 5: (a) Strain curves for normal tissues, malignant, and benign under compression. Δε represents strain difference between normal tissue and benign and malignant, respectively. (b) Multi force technique used for better discrimination between normal , benign and malignant., (Sayed, Layne et al. 2014)(with permission).
For simplicity the Figure 6 summarize how the ansys software deal with our problem. As shown we insert the geometry file in ansys, after defining the material properties in the software assigning every element by its material propriety. To avoid penetration occurred due to applying compression load and boundaries condition we activate frictional contact. Meshing step is concerned by dividing the whole body to elements according to the size entered by the user. Solution will use the boundary condition and load to process the problem to generate the graphical result which compared to accepted result.

Figure 6: Summary of ansys software dealing with the problem.
Results and Discussion
Many works deal with breast cancer classification as nonlinear power equation [18,27,28]. Equation (3) presents the major factor in classification, mainly power coefficient n. This tendency hesitates the non-linearity behavior of malignant masses, wherein the more pressure they encounter, and the higher stiffness they display. We plot Strain difference curve for each case to decide the tissue non-linearity degree. Fitting those curves generate a power - law relationship as follow:
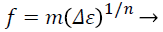 (3)
(3)
Where f is the applied multi-compression force level, and Δε is the strain difference between the breast mass and normal soft tissue. The generated coefficients m and n are generalized fitting parameters, we mainly depending on them for classifying parameters for the masses examined through our study.
The mainly focused parameter is n, so we compare our produced non- linear parameter n with the reference n introduced in Sayed et al. [27]. The calculated difference strain is considered an approximation to the true value of the suspected mass’ stiffness contrast. It is defined as the difference between the strains of the healthy tissue to t he strain of the tumor at the three multi-compression volumes.
Mass classification method
Krouskop et al. and Ophir et al. stated that tissue strain modulus is a dependent parameter, and the stiffness of the tissue changes according the strain level [19,36]. While increasing the applied pressure, malignant masses stiffness increases more rapidly than benign masses stiffness. Using ultrasound elastography and FEM, we propose a method of mass classification depends on calculating the tissue nonlinearity degree, in which higher degrees of nonlinearity parameter than one indicate malignant behavior. Figure 5 explains that the strain difference parameter is increasing exponentially with the applied force where marked the three pre-compression force levels by f1, f2 and f3. Nonlinearity of the material used to classify and quantify the mass type to differentiate between benign and malignant tissues. At each level force, we calculate the strain difference between the background soft tissue strain and the mass strain.
Patient results
Equations (4,5) show the terms variation coefficient VC and relative variation coefficient RVC as indicator how our FEM study results, reduced as n, move away from the non-linear parameter of the original contribution results, reduced as real n.
VC = n − real n -(4)
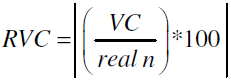 -(5)
-(5)
Benign
Patient #5 Age: 55 years old female Elastography Imaging Diagnosis: Nonlinear parameter value real n was 0.299, indicating a benign mass behavior. Fem: Nonlinear parameter value n was 0.244, indicating a benign mass behavior.
RVC =| ((0.299-0.244)/0.299)|=18.39%
Malignant
Patient #2, Age: 46 years old female Elastography Imaging Diagnosis: the nonlinear parameter value real n was 1.696, indicating a malignant mass behavior.
Fem: Nonlinear parameter value n was 1.74, indicating a malignant mass behavior.
RVC =| ((1.696-1.74)/1.696)|= 2.59%
From previous results the theory that depends on biomechanical tissue classification was proved.
Figures 7 and 8 illustrate the 3-D elastography of the concerned cases, graphical results and the power equation of their curves.

Figure 7: (a)3D Elastography. (b) Graphical result model.

Figure 8: (a)3D Elastography, (b) Graphical result model.
Discussion
Numerical methods have been developed to solve and predict the physical behavior of systems and structures. It uses governing equations of one of the most popularsimulation method, FEM. close to reality was the objective of many research works of numerical modelling during the last thirty years. It enables today engineers to perform complex simulations. Nowadays, performing simulations even for many complex models with many degrees of freedom are available as a rapid development in the sector of hardwareresultinginmore powerful processors, and more with decreasing costs of memory.
In this study, we used FEM technique to construct 3D phantom and applying multi-level force for nonlinearparametercalculationsandevaluation. Thedesignated maximum compression level was set to the usually used level for patients would not feel extra pain. Characterizing the biomechanical performance of breast types mass using forcestrain difference curves presented a highly variance singularity between the breast mass types. From Figure 7 and Figure 8, the non-linearity of mass with respect to the background healthy tissue, compatible well with previously reported of invitro mechanical measurements [18,19]. We prove that, if nonlinear power parameter n exceed one (n>1) the case is malignant otherwise, the case is benign (n<1) and ( n ≠ 0). Multicompression strain contrast wereutilized as a degree of mass’ deformation, in turn, was related to fitting classificationparameter, which can too be utilized to determine the tissue non-linearity degree. Many strain types can be used for elastography and constructed in 3D. In addition to the first principal, maximum shear and the traditional normal axial strain, we depend on Von Mises strains only in the scope of this work. It provided an enhanced distinction of the stiff lesion from the soft tissue. FE is a successful and reliable method to fit the gotten force-strain contrast curves, appearing a higher mass classification potential. It generates an excel file, have all results about the concerned case, making the calculations, drawing curves and are fitted by power equation. Integration the healthy tissue strains given a reference factor at each compression level. The power equation is generated for each case depending on strain difference between suspected mass and its healthy background according each applied force. Figures 9 and 10 show von mess strain for masses and its normal background of all real data. All masses and normal background have different positions and volumes according real data of original contribution, (Sayed, Layne et al. 2013). Curves of strain difference between mass strain and normal background strain had plotted for each case. Power equations of all cases had been generated to calculate nonlinear parameter (n). Case (1) and case (3) for the same patient. To form the equation of this patient we use the strain at four force level to close up its real n .The data inserted in Table 4 summarize the variance between this study results and the result of (Sayed, Layne et al. 2013) at the certain used force. RVC has a wide range of variety, due to some conditions have not been taken into account such as the dimension of breast for each case and all rest layers inside the breast, for simplicity, mention later in future work.

Figure 9: The von mess strain for masses and its normal background of all real data certain used force.

Figure 10: The von mess strain for masses and its normal background of all real data certain used force.
| |
Patient |
real n |
n |
VC |
RVC |
| Benign |
#1 case 1 |
0.133 |
0.174 |
0.023 |
17.82% |
| #1 case 2 |
0.133 |
0.156 |
0.023 |
17.82% |
| #5 |
0.299 |
0.244 |
0.055 |
18.39% |
| #6 |
0.229 |
0.211 |
0.018 |
7.86% |
| #7 |
0.269 |
0.212 |
0.057 |
21.19% |
| Malignant |
#2 |
1.696 |
1.74 |
0.313 |
2.59% |
| #4 |
1.947 |
2.469 |
0.405 |
26.80% |
| #8 |
1.89 |
1.47 |
0.423 |
22.22% |
| #9 |
1.38 |
1.21 |
0.172 |
12.46% |
| #10 |
1.981 |
2.237 |
0.256 |
12.95% |
Table 4: Summarize the variance between this study results and the result of (Sayed, Layne et al. 2013) at the certain used force.
On the one hand, theoretically, from our proposed method, we make verification of the algorithm detection technique, that depending on the nonlinear parameter of the experimental cases which has more limits. On the other hand, the results of this paper encourage on using FE in more experimental in vitro cases.
We depend in our research paper on non-linear parameter (n) for tissue discrimination. FE gives the opportunity with no limits to calculate and discuss the strain difference at each level forces through the whole curve not only at three or four points. With no limits, as a result of FE, we can study new parameters to improve tissue discrimination labeled (m) and temperature effects of US probe. FE allows using real experimental images from some imaging techniques and constructs 3-D model, applying previous detailed procedures, analyzing the results bring us more closely to accurate diagnosis and can test the material proprieties of tissues as elastic or hyper elastic proprieties. Maximum applied force with no limit in FE in contrast reality, when needed increasing applied force getting more details.
Conclusions
In this work, literature reviews are reported on breast models, material data attaching the bases of the development of FE models, aimed at enhancing the elastographic technique.
This article illustrates the feasibility of FE modeling in elastography for differentiation between benign and malignant lesion under different boundary conditions and force levels proving the efficacy of the developed method for diagnosis combining between real experiments data and modeling those cases trying approaching reality and simplicity of organ-shaped geometries. We can consider that models as a software phantoms that can be used studying the effects and helping in accurate classification of breast cancer. Results that generated from the models were compared with real data taken at the Betty Puskar Breast Care Center, West Virginia University. According results from that models are agreed to very good extent with the real data. As a measure to this correspondence we calculated the error factor to each case that indicates a good agreement.
Future work: we aim to use our FEM model to study the effect of dividing the force values to many steps with no limits values, almost, discuss the variance of that technique. Another work is about study this FEM when using different breast tissues layers and how to use real dicom images of real cases forming 3- D model using FE, applying previous algorithm trying avoid biopsy.
22622
References
- Stewart BW, Wild CP (2014) World Cancer Report 2014 (PDF), International Agency for Research on Cancer (UN).
- Ramião NG, Martins PS, Rynkevic R, Fernandes AA, Barroso M, et al. (2016) Biomechanical properties of breast tissue, a state-of-the-art review. Biomech Model Mechanobiol 15: 1307-1323.
- Lerner RM, Parker KJ, Holen J, Gramiak R, Waag RC,et al. (1988) Sono-elasticity: medical elasticity images derived from ultrasound signals in mechanically vibrated targets. Acoustical imaging 317-327.
- Ophir J, Céspedes I, Ponnekanti H, Yazdi Y, Li X (1991) Elastography: a quantitative method for imaging the elasticity of biological tissues. Ultrason imaging 13: 111-134.
- O'Donnell M, Skovoroda AR, Shapo BM, Emelianov SY (1994) Internal displacement and strain imaging using ultrasonic speckle tracking. IEEE transactions on ultrasonics, ferroelectrics, and frequency control 41: 314-325.
- Muthupillai R, Lomas DJ, Rossman PJ, Greenleaf JF, Manduca A, et al. (1995) Magnetic resonance elastography by direct visualization of propagating acoustic strain waves. Science 269: 1854-1857.
- Bishop J, Samani A, Sciarretta J, Plewes DB (2000) Two-dimensional MR elastography with linear inversion reconstruction: methodology and noise analysis. Phys Med Biol 45: 2081.
- Sinkus, R, Lorenzen J, Schrader D, Lorenzen M, Dargatz M, et al. (2000) High-resolution tensor MR elastography for breast tumour detection. Phys Med Biol 45: 1649.
- Weaver JB, Van Houten EE, Miga MI, Kennedy FE, Paulsen KD (2001) Magnetic resonance elastography using 3D gradient echo measurements of steady-state motion. Med phys 28: 1620-1628.
- Khalil AS, Chan RC, Chau AH, Bouma BE, Mofrad MR (2005) Tissue elasticity estimation with optical coherence elastography: toward mechanical characterization of in vivo soft tissue. Ann Biomed Eng 33: 1631-1639.
- Kirkpatrick SJ, Wang RK, Duncan DD (2006) OCT-based elastography for large and small deformations. Optics express 14: 11585-11597.
- Baines CJ (1998) Menstrual cycle variation in mammographic breast density: so who cares? J Natl Cancer Inst 90: 875-876.
- Doyley MM, Parker KJ (2014) Elastography: general principles and clincial applications. Ultrasound clinics 9: 1.
- Qiu Y, Sridhar M, Tsou JK, Lindfors KK, Insana MF (2008) Ultrasonic viscoelasticity imaging of nonpalpable breast tumors: preliminary results. Academic radiology 15: 1526-1533.
- Sinkus R, Tanter M, Catheline S, Lorenzen J, Kuhl C, et al. (2005) Imaging anisotropic and viscous properties of breast tissue by magnetic resonance-elastography. Magn Reson Med 53: 372-387.
- Sinkus R, Tanter M, Xydeas T, Catheline S, Bercoff J, et al. (2005) Viscoelastic shear properties of in vivo breast lesions measured by MR elastography. Magn Reson Imaging 23: 159-165.
- Wellman PS, Howe RD, Dalton E, Kern KA (1999) Breast tissue stiffness in compression is correlated to histological diagnosis. Harvard BioRobotics Laboratory Technical Report 1-15.
- Krouskop TA, Wheeler TM, Kallel F, Garra BS, Hall T (1998) Elastic moduli of breast and prostate tissues under compression. Ultrason imaging 20: 260-274.
- Azar FS, Metaxas DN, Schnall MD (2000) A finite element model of the breast for predicting mechanical deformations during biopsy procedures. Mathematical Methods in Biomedical Image Analysis, 2000. Proceedings 38-45.
- Plewes DB, Bishop J, Samani A, Sciarretta J (2000) Visualization and quantification of breast cancer biomechanical properties with magnetic resonance elastography. Phys Med Biol 45: 1591.
- Samani A, Bishop J, Yaffe MJ, Plewes DB (2001) Biomechanical 3-D finite element modeling of the human breast using MRI data. IEEE Trans Med Imaging 20: 271-279.
- Unlu MZ, Krol A, Magri A, Mandel JA, Lee W, et al. (2010) Computerized method for nonrigid MR-to-PET breast-image registration. Comput Biol Med 40: 37-53.
- Misra S, Ramesh KT, Okamura AM (2008) Modeling of Tool-Tissue Interactions for Computer-Based Surgical Simulation: A Literature. Presence 17: 463.
- op den Buijs J, Hansen HH, Lopata RG, de Korte CL, Misra S (2011) Predicting target displacements using ultrasound elastography and finite element modeling. IEEE Trans Biomed Eng 58: 3143-3155.
- Wahba AA (2014) A finite element model for recognizing breast cancer. JBiSE 7: 296.
- Sayed A, Layne G, Abraham J, Mukdadi O (2013) Nonlinear characterization of breast cancer using multi-compression 3D ultrasound elastography in vivo. Ultrasonics 53: 979-991.
- Sayed A, Layne G, Abraham J, Mukdadi OM (2014) 3-D visualization and non-linear tissue classification of breast tumors using ultrasound elastography in vivo. Ultrasound Med Biol 40: 1490-1502.
- HAMEED SAYED AA, SOLOUMA NH, EL-BERRY AA, KADAH YM (2011) Finite element models for computer simulation of intrastromal photorefractive keratectomy. Journal of Mechanics in Medicine and Biology 11: 1255-1270.
- Sarvazyan A (1995) Biophysical bases of elasticity imaging. Acoustical imaging 21: 223-240.
- Fung YC (2013) Biomechanics: mechanical properties of living tissues, Springer Science & Business Media.
- Zhang M, Zheng YP, Mak AF (1997) Estimating the effective Young's modulus of soft tissues from indentation tests¬ÂÃÂnonlinear finite element analysis of effects of friction and large deformation. Med Eng Phys 19: 512-517.
- Hayes WC, Keer LM, Herrmann G, Mockros LF (1972) A mathematical analysis for indentation tests of articular cartilage. J biomech 5: 541-551.
- Celi S, Di Puccio F, Forte P (2011) Advances in finite element simulations of elastosonography for breast lesion detection. J biomech eng 133: 081006.
- Hipwell JH, Vavourakis V, Han L, Mertzanidou T, Eiben B, et al. (2016) A review of biomechanically informed breast image registration. Phys Med Biol 61: R1-31.
- Ophir J, Alam SK, Garra BS, Kallel F, Konofagou EE, et al. (2002) Elastography: imaging the elastic properties of soft tissues with ultrasound. J Med Ultrason 29: 155-171.