Research Article - (2022) Volume 16, Issue 11
Cardiovascular outcomes in Dilated Cardiomyopathy patients with and without Implantable Cardioverter Defibrillator
Haripriya K*
Department of Health and Science, India
*Correspondence:
Haripriya K, Department of Health and Science,
India,
Tel: 6282047247,
Email:
Received: 22-Sep-2022, Manuscript No. Iphsj-22-13076;
Editor assigned: 26-Sep-2022, Pre QC No. Iphsj-22-13076 (PQ);
Reviewed: 28-Oct-2022, QC No. Iphsj-22-13076;
Revised: 02-Nov-2022, Manuscript No. Iphsj-22-13076 (R);
Published:
09-Nov-2022, DOI: 10.36648/1791- 809X.16.11.981
Abstract
Background: Dilated cardiomyopathy (DCM) is an important cause of sudden cardiac death and heart failure. It is characterised by heart chamber dilatation, ventricular systolic dysfunction. There can be different causes for DCM like inherited, infectious and inflammatory diseases. Patients with DCM develop a broad range of Brady arrhythmias and tachyarrhythmias. Some patients could benefit from ICD treatment and demonstrate a significant mortality reduction especially, SCD reduction. Aim: Cardiovascular outcomes in dilated cardiomyopathy patients with and without implantable cardioverter defibrillator.
Methods: This study comprised of 86 patients with DCM who are divided into two groups. group 1 includes those patients with implanted AICD/CRTD and group 2 includes patients with LVEF<45% and without CRTD/AICD ( 43 patients each) .their baseline characteristics were analysed statistically and comparison between the two groups were done and outcomes were obtained.
Results: Most of the patients had severe LV systolic dysfunction on diagnosis as well as on follow up. Higher number of patients belongs to NYHA class 2 prior and after the treatment. The number of patients who had prior hospitalisation for heart failure is much similar within group 1 and 2 (39/43 and33/43 patients respectively).
Events of aborted SCD (VT/VF) were more common within group 1. 19 patients (19/43) in group 1 had appropriate ICD therapy and only a very few patients had events of inappropriate ICD shock. Mortality is similar within group 1 and 2 (16.3% and 14% respectively). The frequency of patients who had SCD is more within group 2 and heart failure related death is more in group 1.
Conclusion: There was a higher number (P=0.008) of patients who succumbed to heart failure related deaths in group 1 (with AICD/CRTD). it is reasonable to assume that the patients in group 1 belonged to a much more advanced heart failure subset. There was a higher number (P=0.008) of patients who had a sudden cardiac death in group 2 (without AICD /CRTD). This is likely due to the fact that the group included only patients without implantable cardioverter defibrillator.
Keywords
Cardiovascular health; Cardiomyopathy; Patients
Introduction
Dilated Cardiomyopathy (DCM) refers to a spectrum of heterogeneous myocardial disorders that are characterized by ventricular dilation and depressed myocardial contractility in the absence of abnormal loading conditions (such as hypertension / valvular heart disease) or ischemic heart disease sufficient to cause global systolic impairment. This group constitute the largest group of myopathy disorders that are responsible for systolic heart failure. DCM can be envisioned as the final common pathway for myriad of cardiac disorders that either damage the heart muscle or disrupt the myocardium to generate force and subsequently cause chamber dilation. This disease process can be classified as either primary or secondary DCM. Primary DCM is considered idiopathic and the diagnosis can only be made after excluding secondary causes. In most cases DCM is progressive, leading to heart failure and death. Without a transplant the survival is poor. Most patients with DCM have symptoms while a few patients may be asymptomatic because of complementary mechanisms. The continued enlargement of ventricles leads to a decline in ventricular function, followed by conduction system abnormalities, ventricular arrhythmias, thromboembolism and heart failure.
Etiology
DCM has many causes and all of them affect the ventricular function to a varying degree. Most common etiology of DCM is idiopathic and without an identifiable cause. DCM can have a familial / genetic predisposition; which has been associated with mutations in genes for desmin (cytoskeletal), lamin c (Nuclear membrane), or myosin (Contractile proteins). The secondary causes include infectious myocarditis (eg: viral, chagas disease, Lyme disease), hypertension, Medication Induced (Eg:Anthracyclines), Alcohol abuse, HIV, Peripartum Cardiomyopathy or Infiltrative disease (Table 1).
Epidemiology
DCM is more commonly seen in men than in women in this study, the valid percent distribution in females and males are 31.4 % and 68.6 % respectively. Its prevalence in general population is estimated at 36 cases per 100000.advancing age is an independent risk factor for mortality in DCM. In this study, 40 patients comes under the age group of 60-80 years, which accounts for 47.1%. The study predominantly involves Indians (98.8%).
Natural History
The natural history of DCM is not well established for two reasons: first, DCM represents a heterogeneous spectrum of myocardial disorders that may each progress at different rates and second , the onset of disease may be insidious, particularly in case of familial / idiopathic DCM. A large number of patients with DCM may have a long latent period where they are clinically asymptomatic. When symptoms do rise, they are the result of LV systolic dysfunction. In addition to a focused cardiac history and examination a more thorough evaluation is recommended to identify any systemic or secondary causes.
Pathophysiology
DCM may be viewed as a progressive disorder initiated after an “index event “that either damage the heart muscle, with a resultant loss of functioning cardiac myocytes or alternatively disrupts the ability of myocardium to generate force , thereby preventing the heart from contracting normally. This index event may have an abrupt onset as in the case of acute exposure to toxins, or it may have gradual or insidious onset as in the case of hemodynamic pressure or volume overload or it may be hereditary, as in the case of many familial cardiomyopathies.
Regardless the nature of the inciting event, the feature that is common to each of these index events is that, they all produce a decline in pumping capacity of the heart. DCM patients generally have dilation of chambers of the heart. Despite the fact that there is thinning of LV wall, there is massive hypertrophy at the level of intact heart and at the level of cardiac myocyte, which has a characteristic elongated appearance. The coronary arteries are usually normal in DCM. The cardiac valves are anatomically normal; however, there is usually tricuspid and mitral annular dilation due to cavity enlargement. Distortion of subvalvular apparatus and stretching of papillary muscles give rise to valvular regurgitation.
Enlargement of the ventricles can be associated with both systolic and diastolic dysfunction. Reduction in systolic function is caused by myocardial remodelling those results in an increase in both end-diastolic and end- systolic volumes. This along with mitral and tricuspid insufficiency; lower the ejection fraction and increase the ventricular wall stress and end- systolic volumes. Early compensatory mechanisms include an increase in heart rate and tone of peripheral vascular system. However, these compensatory mechanisms lead to geometric remodelling of ventricles and eventually this leads to worsening of myocardial injury. At the same time, there is neurohormonal activation of renin-angiotensin aldosterone system and an increase in circulating levels of catecholamine’s. Levels of natriuretic peptides are also increased. Eventually these compensatory mechanisms become overwhelmed and the heart fails. Histologic examination of the myocardium typically shows non-specific changes of fibrosis and hypertrophy. it also reveals myocardial injury with a marked infiltrate by inflammatory cells.
Clinical Recognition
The most common initial presenting manifestations of DCM are related to left heart failure and it includes progressive exertional dyspnea, paroxysmal nocturnal dyspnea, presyncope, syncope, palpitations, shortness of breath, orthopnoea, peripheral edema (leg swelling). More severe cases can present with conduction disturbances, arrhythmias or even sudden cardiac death. With the development of right heart failure, abdominal distention right upper quadrant pain, early satiety, post prandial fullness and nausea appears. Thromboembolic complications can also occur.
Clinical findings are largely not specific to other causes of cardiomyopathy and consist of typical findings seen with CHF. Findings include crackles in the lung fields, elevated jugular venous pressures, peripheral edema and s3 gallop. Point of maximum impulse or PMI is displaced laterally. Tricuspid or mitral regurgitation murmurs are not uncommon as a result of ventricular enlargement and annular dilation. Neck examination may reveal jugular venous distension, a wave, large v waves, and positive hepatojugular reflux [1].
Diagnostic Evaluation
Initial Laboratory Tests: This include complete blood count, serum electrolytes, urinalysis, blood urea nitrogen, serum creatinine, fasting blood glucose, lipid profile, liver function tests and thyroid function tests. Sometimes under specific suspicions HIV serology and iron studies are also done. Serum terminal pro brain natriuretic peptide (NT pro BNP) levels can be obtained.
Chest X-Ray: It reveals lv enlargement or generalized cardiomegaly that involves all four cardiac chambers. Depending upon patient’s volume status there may or may not be findings of pulmonary congestion. ECG: The ECG morphology is seldom normal and often shows nonspecific repolarization or ST segment abnormalities. Conduction abnormalities like LBBB, LAHB, non-specific intraventricular conduction delays and first degree Av block are common in patients with long standing symptoms, and they may be the markers of increasing interstitial fibrosis or myocyte hypertrophy. Left atrial or biatrial enlargement may be seen. Poor R wave progression can be seen. Premature ventricular complexes are also not uncommon findings in DCM.
Holter Monitoring: There is an inverse relationship between the severity of ventricular arrhythmia and lv ejection fraction. The majority of DCM patients have VPCs when monitored over a 24 hour period. Moreover, a variety of ventricular and atrial arrhythmias can be obtained. Also atrioventricular conduction disturbances can also be seen.
Cardiac Magnetic Resonance Imaging (CMRI): It helps in assessing myocardial anatomy, regional and global function, viability of myocardium. It allows detection of fibrosis, infiltration, and iron overload and thereby help in the diagnosis of the underlying cause of dcm.in non-ischemic cases, there is usually patchy midwall, epicardial, or global endocardial hyper enhancement can be seen.
Cardiac Catheterization: Coronary angiography can be performed to rule out ischemic heart disease. a ventriculogram reveals a dilated ventricle with depressed contractility.
Treatment Strategies
A number of “Cause Specific Treatment Strategies are designed to treat the underlying disease process that is responsible for causing DCM [2].
Standard Medical Therapy: Ace inhibitors and beta blockers are indicated for all patients with current/prior symptoms of heart failure and reduced LVEF. ARB is recommended for patients who are ace inhibitor intolerant. diuretics are recommended for patients who have evidence of fluid retension. Aldosterone antagonists are advised in patients with advanced heart failure. Digoxin is also recommended in heart failure patients, as it is indicated to increase LVEF. Anticoagulant and anti-platelet therapy are also common in DCM patients as they have multiple predisposing factors that lead to thromboembolic events. Statins are also recommended in view of their effects on DLP and may improve ventricular function, heart failure status.
Medical Antiarrhythmic Therapy: Amiodarone treatment was effective in supressing ventricular arrhythmias and improving ventricular function.
Antiarrhythmic Therapy: Implantable Devices-AICD can be recommended for both primary and secondary prophylaxis. ICD reduces SCD risk in patients with lv dysfunction who have survived SCD/VT/VF while ICD as primary prophylaxis is recommended when the patient is having LVEF <=35%, NYHA functional class 2-3 symptoms when receiving chronic optimal medical therapy and who have reasonable expectation of survival with a good functional status for more than 1 year. In patients with advanced heart failure (presence of LBBB/IVCD), CRTD is Recommended. This reduced the risk of SCD by improving ventricular function with biventricular pacing. Arrhythmias in DCM Arrhythmias Can Be the Consequence But Also the Cause of DCM. In Patients With DCM, It Is Possible To Find A Broad Range Of Brady And Tachyarrhythmias. Brady arrhythmias And Supraventricular Arrhythmias Can Frequently Occur in Some Familial Forms Such As Lamin A/C Mutations. Multiple Mechanisms Can Explain Atrial And Ventricular Tachyarrhythmias. Re-entry Is Associated With Slow Conduction Across Surviving Muscle Bundles Within Regions Of Interstitial Fibrosis, But Other Mechanisms Can Be Involved As, Ion Channel Dysfunction And Reduced Gap Junction Function [3].
Conduction Abnormalities In Patients Can Occur Even Years Before HF Or LV Dysfunction. Patients With LBBB Can Have A Higher Risk Of Death From HF. It Was Observed That Patients With Baseline LBBB Had A Significantly Higher Mortality Rate Than Those Without LBBB At The Univariate Analysis, But In The Multiple Covariate Adjustment, Only New Onset LBBB Was An Independent Predictor Of All-Cause Mortality.
Patients with DCM are at substantial risk for sudden cardiac death (SCD). Implantable cardioverter defibrillators are cornerstone of therapy for reducing mortality among patients at risk of arrhythmic death. Several trials, including madit 1, madit 2, SCD-HEFT demonstrated a mortality benefit of prophylactic ICD placement in various patient groups. The definite trial also observed that ICD placement in addition to standard medical therapy was associated with a trend towards decreased mortality than with standard medical therapy alone.
ICD s performs all the features of permanent pacemaker but they also have the capacity to treat dangerously rapid heart rates with rapid pacing / with shocks. They are implanted in the same way as a permanent pacemaker with leads traveling down to heart through a vein but the device itself is larger than pacemaker and the lead that is capable of giving shocks is also a little thicker than a normal pacemaker lead. The device needs to be larger because shocks require more energy and more battery capacity than low voltage tharapies like pacing the heart. Cardiac resynchronisation therapy is similar to ICD but it involves an additional lead that is passed through coronary sinus to pace the heart from the left side. It is also referred to as biventricular pacing because it results in pacing from the left and right ventricles at the same time.by placing another lead on the opposite side of the heart we can stimulate both sides of the heart to contract in time again and the heart beats more efficiently (Table 2).
Review of Literature
In 2022, American College of cardiology foundation published a research paper on “Arrhythmic and mortality outcomes among ischemic versus no ischemic cardiomyopathy patients receiving primary ICD therapy “.The study sought to determine the association of cardiomyopathy etiology with the likelihood of ventricular arrhythmias, appropriate implantable cardioverter defibrillator therapy and mortality. The study population comprised 4803 patients with ICM or NICM. The primary end point was sustained ventricular tachycardia>=200 beats/min or ventricular fibrillation. Secondary end points included appropriate ICD therapy and all-cause mortality. Differences in cause specific mortality, including non-cardiac, sudden cardiac and non-sudden cardiac death, were also examined. The results obtained was patients with ICM were significantly older and more comorbid conditions, whereas those with NICM had a more advanced heart failure class at enrolment and were more often prescribed medical or cardiac resynchronization therapy for heart failure multivariate analysis showed that ICM versus NICM had a similar risk of VT/VF events and appropriate ICD therapy whereas the risk of all-cause mortality was 1.8 fold higher among ICM versus NICM patients dominated by non-sudden cardiac mortality [4].
In 2004, Kadish et al published a study on Prophylactic defibrillator implantation in patients with non-ischemic dilated cardiomyopathy”. Also known as “definite trial “the trial studied 458 patients with non-ischemic DCM with EF <=35%, NYHA class 2-3 symptoms and a history of NSVT. Patients were treated with optimal medical therapy including ace inhibitors and beta blockers. ICD placement in addition to the standard medical therapy was associated with a trend towards decreased mortality than with standard medical therapy alone, but this does not reach to statistical significance. Subgroup analysis showed that the reduction was significant among patients with NYHA class 3.
Madit 1 trial: (multicentre automated defibrillator implantation trial) demonstrated significant improvements in survival for patients with prior myocardial infarction, left ventricular dysfunction and inducible sustained ventricular arrhythmias during ep study that were treated with implantable defibrillators. Both trials were randomized controlled trials with relatively large sample sizes. The result of this trial is consistent and provides sufficient evidence on effectiveness for the population of patients with EP inducible ventricular tachyarrhythmia’s [5, 6].
Madit 2 trial: the purpose of the study was to evaluate the prophylactic benefit of ICD placement in patients with cad and a LVEF of <= 30%, who have had at least one myocardial infarction, but require no further risk stratification. The trial’s interpretation was that ICD implantation was associated with a 31% reduction in overall mortality compared to conventional therapy over an average follow up period of 2 years.no mortality reduction was observed until 9 months. The trend towards higher rates of heart failure may be due to the longer time for heart failure to develop since ICD placement was associated with improved survival, but may also be due to defibrillator shocks resulting in myocardial injury or backup ventricular pacing impairing ventricular function. Long term results seem to indicate a continued mortality benefit with ICD implantation in this patient population upto 8 years of follow-up.
Sudden cardiac death in heart failure trial: the goal of the trial was to evaluate the effectiveness of amiodarone therapy or an ICD with placebo in patients with NYHA class 2 and 3 CHF and reduced LVEF<=35%. The trail interpreted that among patients with NYHA class 2 or 3 CHF and reduced LVEF, treatment with an ICD was associated with a reduction in all-cause mortality compared with placebo, but there was no difference between amiodarone and placebo. The ICD was programmed for VF treatment only. On long term follow up there was potentially some attenuation in benefit beyond 6 years, although the crossover rate to ICD arm was>50%. Benefit was highest among ischemic cardiomyopathy and NYHA class2 symptoms.
Madit -CRT trial: the trail is designed to determine if combined ICD -CRTD will reduce the risk of mortality and heart failure events by approximately 25% in subjects who are in NYHA class 2 with non-ischemic or ischemic cardiomyopathy and subjects who are in NYHA class 1 with ischemic cardiomyopathy, left ventricular dysfunction (EF <30%) and prolonged intraventricular conduction (QRS duration >=130ms). The results of this trial indicate that CRTD implantation in patients with systolic CHF with a wide QRS and NYHA 1 / 2 symptoms is associated with a significant reduction in the primary endpoint of CHF events or mortality as compared with ICD implantation alone. CRTD implantation is associated with improvement in LV function and LV volumes.
Danish study: the goal of the trial was to evaluate treatment with an ICD compared with usual care among patients with left ventricular systolic dysfunction due to non-ischemic etiology. Patients with non-ischemic cardiomyopathy were randomized to ICD implantation (n=556) versus usual care (n=560).The primary outcome, incidence of all-cause mortality, occurred in 21.6% of the ICD group versus 23.4% of the control group. The trial gives the interpretation that among patients with non-ischemic cardiomyopathy, ICD implantation did not reduce long term mortality compared with usual care, and however, there was suggestion of benefit among younger patients. Although there was lack of benefit for the primary outcome, ICD was associated with a reduction in sudden cardiac death versus usual care [7].
Methodology
The study population comprised of 86 patients with dilated cardiomyopathy who are divided into two groups. Group 1 includes 43 patients who are implanted with an AICD/CRTD and group two (control population) includes another 43 patients who are without an AICD /CRTD. Group 2 patients have LVEF <45% but without an AICD/CRTD. The end points included aborted SCD (VT/ VF), appropriate ICD therapy, and all-cause mortality. Differences in cause specific mortality including non-cardiac, sudden cardiac and non-sudden cardiac death were also examined.
The baseline characteristics includes age, sex, race, BMI(kg/m2), estimated GFR (ml/min), weight (kg), LVEF (pre and present), smoking, diabetes, hypertension, CAD, prior hospitalisation for heart failure, NYHA functional class (pre and present), symptoms presented, QRS duration (pre & present), presence of LBBB, baseline HR, CRTD implantation, medications like ACE inhibitors, ARBS, ARNI, aldosterone inhibitors, amiodarone, beta blockers, SGLT2 inhibitors, diuretics, statin, anti-platelets, anti-coagulants and digoxin.
The study specifically focus on aborted SCD (VT/VF), history of atrial arrhythmia requiring treatment, appropriate ICD therapy (either anti-tachycardia pacing / defibrillator shock), inappropriate ICD shock, all-cause mortality [8].
The study also focuses on characteristics like single/dual chamber device selection, history of stroke and history of endocarditis. We also collect data regarding recommendation of an AICD/CRTD among group 2 patients.
The study also includes the clinical data of patients including ECG, ECHO, halter and MRI. From ECG reports, the data collected includes PR interval, AV block and IVCD. The echo characteristics includes LA and LV chamber dimensions, LV systolic and diastolic function, RV function, dysynchrony, MR, TR and PAH. The halter characteristics include morphology and types of VPCS and pauses. The MRI characteristics include presence of myocardial scar and LGE distribution.
Each of the patient data was collected from their physician’s notes, discharge summaries and clinical reports of diagnostic tests. Most of the patients had their latest follow up from 2015- 2022. 5 patients had their latest follow before 2015. Those patients who are not in latest follow up with us (>6 months of duration from the day of enrolment) were telephoned and their current status was enquired in detail. The calculation of estimated GFR was done using the CKD- EPI formula (chronic kidney disease epidemiology collaboration equation). The equation is expressed as: 142* min (SCR/K,1)a * max (SCR/k,1)-1.200*0.9938age*1.012 (if female)
Where, SCR is serum creatinine (mg/dl), k is 0.7 for females and 0.9 for males, a is -0.329 for females and -0.411 for males, min indicates minimum od SCR/k or 1 and max indicates the maximum of SCR/k or 1.
All the patient data were statistically analysed to bring about a comparison between group 1 and 2. Their distribution and output data was summarised along with the p value (pearsin chi -square) (Table 1, Figure 1)
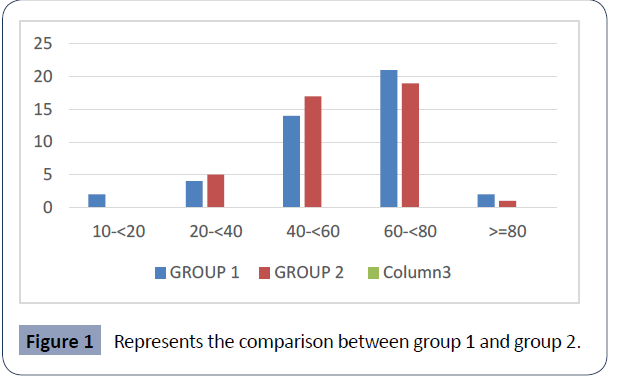
Table 1 represents the distribution of age which shows that among the total 86 patients, 40 patients comes under the category of age between 60-<80years which accounts of about 47.1%.
| |
|
Frequency |
Percent |
Valid Percent |
Cumulative Percent |
| Valid |
10-<20 |
2 |
2.3 |
2.4 |
2.4 |
| |
20-<40 |
9 |
10.5 |
10.6 |
12.9 |
| |
40-<60 |
31 |
36 |
36.5 |
49.4 |
| |
60-<80 |
40 |
46.5 |
47.1 |
96.5 |
| |
>=80 |
3 |
3.5 |
3.5 |
100 |
| |
Total |
85 |
98.8 |
100 |
- |
| Missing |
System |
1 |
1.2 |
- |
- |
| Total |
|
86 |
100 |
- |
- |
Table 1. Distribution of Age.
Figure 1 represents the comparison between group 1 and group 2 based upon their age. In group 1, out of the 43 patients, 21 patients comes under the age group of 60-<80 years which is of 48.8%. in group 2, out of the 43 patients, 19 patients comes under the age group of 60-<80 years which is of 45.2%. Statistically, it is considered to be insignificant (p =0.588) (Table 2, Figure 2).
Figure 1 Represents the comparison between group 1 and group 2.
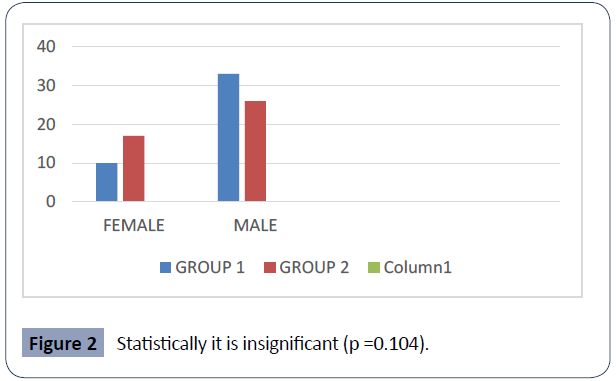
Figure 2 Statistically it is insignificant (p =0.104).
Table 2 represents the distribution of sex. Among the total 86 patients, 27 of them are females and 59 of them are males, which accounts of about 31.4% and 68.6 % respectively.
| Sex |
| |
|
Frequency |
Percent |
Valid Percent |
Cumulative Percent |
| Valid |
Female |
27 |
31.4 |
31.4 |
31.4 |
| |
Male |
59 |
68.6 |
68.6 |
100 |
| |
Total |
86 |
100 |
100 |
- |
Table 2. Distribution of Sex.
Figure 2 represents the comparison between group 1 and group 2 based upon their sex. Group 1 have 10 female (23.3%) and 33 male patients (76.7%) while group 2 have 17 female (39.5%) and 26 male patients (60.5%). Statistically it is insignificant (p =0.104) (Table 3, Figure 3).
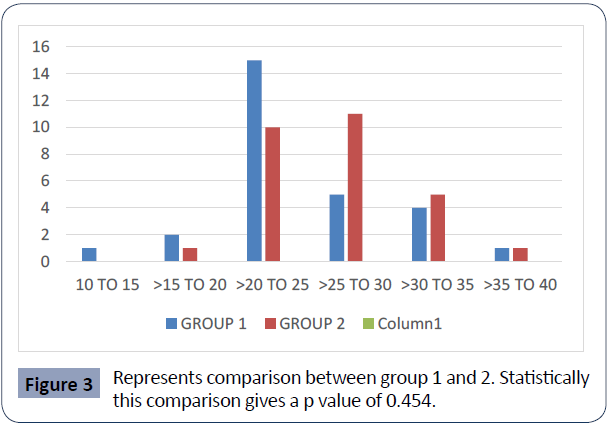
Table 3 represents the distribution of BMI among the total patients. Around 44.6% (Frequency of 25 patients) comes under the class of >20-25. Figure 3 represents comparison between group 1 and 2. Statistically this comparison gives a p value of 0.454 (Table 4, Figure 4).
| |
|
Frequency |
Percent |
Valid Percent |
Cumulative Percent |
| Valid |
Oct-15 |
1 |
1.2 |
1.8 |
1.8 |
| |
>15-20 |
3 |
3.5 |
5.4 |
7.1 |
| |
>20-25 |
25 |
29.1 |
44.6 |
51.8 |
| |
>25-30 |
16 |
18.6 |
28.6 |
80.4 |
| |
>30-35 |
9 |
10.5 |
16.1 |
96.4 |
| |
>35-40 |
2 |
2.3 |
3.6 |
100 |
| |
Total |
56 |
65.1 |
100 |
- |
| Missing |
System |
30 |
34.9 |
- |
- |
| Total |
|
86 |
100 |
- |
- |
Table 3. Distribution of BMI.
Figure 3 Represents comparison between group 1 and 2. Statistically this comparison gives a p value of 0.454.
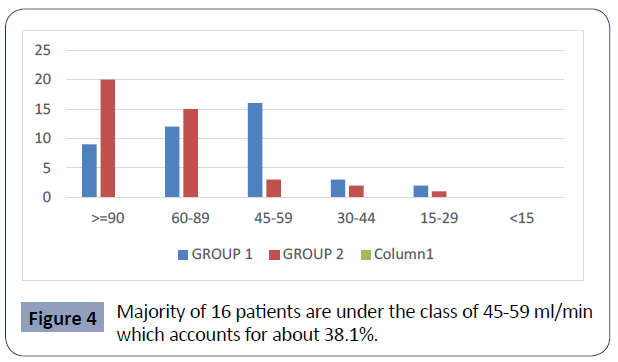
Figure 4 Majority of 16 patients are under the class of 45-59 ml/min which accounts for about 38.1%.
Table 4 represents the distribution of estimated GFR. Out of the total number of patients, a majority of 29 patients (34.9%) comes under the class of >=90 ml/min of EGFR. The graph 4 represents comparison between group 1 and 2 based upon their EGFR. In group 1, a majority of 16 patients are under the class of 45-59 ml/ min which accounts for about 38.1%. In group 2, a majority of 20 patients are under the class of >=90 ml/min which is about 48.8%. Statistically, it is significant (p value = 0.008) (Table 5, Figure 5).
| |
|
Frequency |
Percent |
Valid Percent |
Cumulative Percent |
| Valid |
>=90 |
29 |
33.7 |
34.9 |
34.9 |
| |
60-89 |
27 |
31.4 |
32.5 |
67.5 |
| |
45-59 |
19 |
22.1 |
22.9 |
90.4 |
| |
30-44 |
5 |
5.8 |
6 |
96.4 |
| |
15-29 |
3 |
3.5 |
3.6 |
100 |
| |
<15 |
|
|
|
|
| |
Total |
83 |
96.5 |
100 |
|
| Missing |
System |
3 |
3.5 |
|
|
| Total |
|
86 |
100 |
|
|
Table 4. Distribution of Estimated GFR.
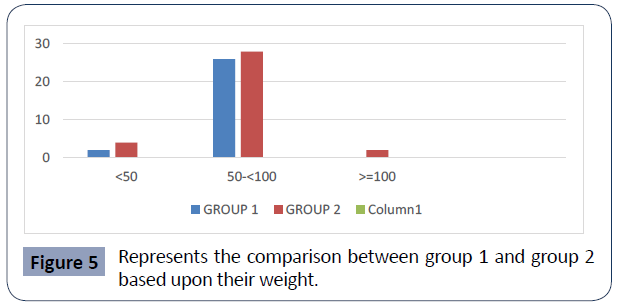
Figure 5 Represents the comparison between group 1 and group 2 based upon their weight.
Table 5 represents the distribution of weight where majority of patients comes under the class of 50-<100 kg (87.1%). Figure 5 represents the comparison between group 1 and group 2 based upon their weight. Statistically, it is insignificant with a p value of 0.336 (Table 6, Figure 6).
| |
|
Frequency |
Percent |
Valid Percent |
Cumulative Percent |
| Valid |
<50 |
6 |
7 |
9.7 |
9.7 |
| |
50-<100 |
54 |
62.8 |
87.1 |
96.8 |
| |
>-100 |
2 |
2.3 |
3.2 |
100 |
| |
Total |
62 |
72.1 |
100 |
|
| Missing |
System |
24 |
27.9 |
|
|
| Total |
|
86 |
100 |
|
|
Table 5. Distribution of Weight.
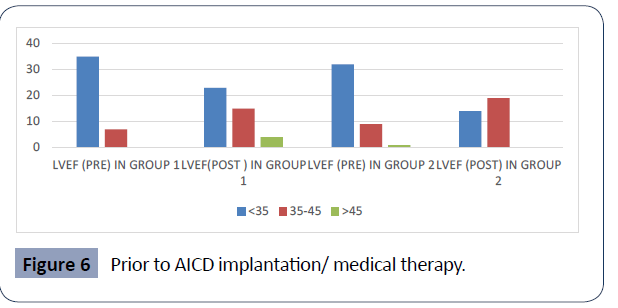
Figure 6 Prior to AICD implantation/ medical therapy.
Table 6 represents the distribution of LV ejection fraction among the total patients. The first table presents EF that the patients had prior to device implantation/prior to medical therapy, while the second represents their EF after treatment (on follow up). From the first table, it is understood that majority of patients (frequency of 67) comes under the class of <35% of EF. It accounts for about 79.8%. The second table too has a major number of patients in category of EF <35%, however the frequency is decreased to 37(46.3%) hence, the second table is suggestive that major number of patients moved to the category of EF between 35-45% after treatment. It brings about a percentage of 42.5%. Figure 6 gives the comparison between group one and two based upon their LVEF (pre and post). Prior to AICD implantation/ medical therapy, group 1 have 35 patients and group 2 have 32 patients with EF<35%. After the treatment, group 1 is with 23 and group 2 is with 14 patients with EF<35%. Statistically, both pre and post LVEF gives a p value of 0.5 and 0.276 respectively (Table 7, Figure 7).
| LVEF (Pre) |
|
|
|
|
|
| |
|
Frequency |
Percent |
Valid Percent |
Cumulative Percent |
| Valid |
<35 |
67 |
77.9 |
79.8 |
79.8 |
| |
35-45 |
16 |
18.6 |
19 |
98.8 |
| |
>45 |
1 |
1.2 |
1.2 |
100 |
| |
Total |
84 |
97.7 |
100 |
|
| Missing |
System |
2 |
2.3 |
|
|
| Total |
|
86 |
100 |
|
|
| |
|
|
|
|
|
| LVEF (Post) |
|
|
|
|
|
| |
|
Frequency |
Percent |
Valid Percent |
Cumulative Percent |
| Valid |
<35 |
37 |
43 |
46.3 |
46.3 |
| |
35-45 |
34 |
39.5 |
42.5 |
88.8 |
| |
>45 |
9 |
10.5 |
11.3 |
100 |
| |
Total |
80 |
93 |
100 |
|
| Missing |
System |
6 |
7 |
|
|
| Total |
|
86 |
100 |
|
|
Table 6. Distribution of LVEF.
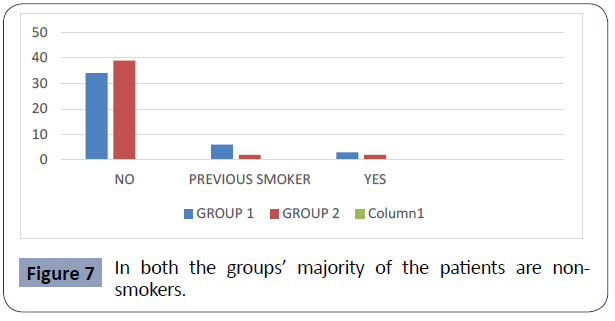
Figure 7 In both the groups’ majority of the patients are nonsmokers.
Table 7 gives the distribution of those patients who was / current smoker. It shows that 73 out of 86 patients are not on the habit of smoking. It accounts for about 84.9%.
| |
|
Frequency |
Percent |
Valid Percent |
Cumulative Percent |
| Valid |
No |
73 |
84.9 |
84.9 |
84.9 |
| |
Previous Smoker |
8 |
9.3 |
9.3 |
94.2 |
| |
Yes |
5 |
5.8 |
5.8 |
100 |
| |
Total |
86 |
100 |
100 |
|
Table 7. Distribution of Smoking Habit.
Figure 7 gives a comparison between group 1 and group 2 based upon their smoking habit. In both the groups majority of the patients are non-smokers. The frequency of patients are 34 (79.1%) and 39(90.7) respectively. statistically, it gives a p value of 0.280 (Table 8, Figure 8)
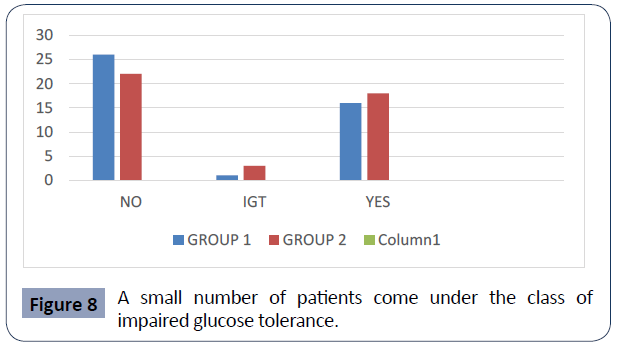
Figure 8 A small number of patients come under the class of impaired glucose tolerance.
Table 8 represents those patients who are diabetic. a total of 34 patients out of 86 patients are diabetic, which is of 39.5%. However major number of patients are non-diabetic (frequency of 48 ) which is of 55.8%. A small number of patients come under the class of impaired glucose tolerance. This is a frequency of 4 patients (4.7%).
| |
|
Frequency |
Percent |
Valid Percent |
Cumulative Percent |
| Valid |
No |
48 |
55.8 |
55.8 |
55.8 |
| |
Igt |
4 |
4.7 |
4.7 |
60.5 |
| |
Yes |
34 |
39.5 |
39.5 |
100 |
| |
Total |
86 |
100 |
100 |
|
Table 8. Distribution of Diabetes.
Figure 8 represents the comparison between group 1 and 2 based upon the presence of diabetes. Both group 1 and 2 have greater number of patients who are non-diabetic (frequency of 26 and 22 respectively). This accounts for about 60.5% and 51.2% respectively. Statistically, it gives a p value if 0.484 (Table 9, Figure 9).
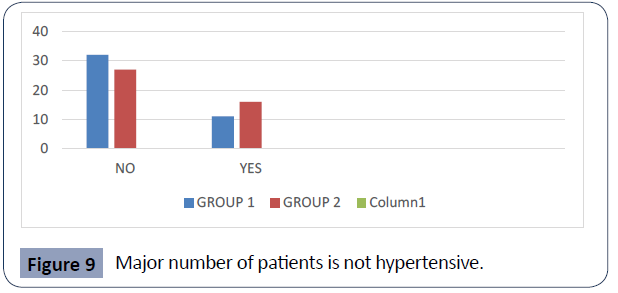
Figure 9 Major number of patients is not hypertensive.
Table 9 represents distribution of patients with hypertension. A frequency of 59 patients is non-hypertensive, which is of 68.6%. 27 of them are showing hypertension, which accounts for about 31.4%.
| |
|
Frequency |
Percent |
Valid Percent |
Cumulative Percent |
| Valid |
No |
59 |
68.6 |
68.6 |
68.6 |
| |
Yes |
27 |
31.4 |
31.4 |
100 |
| |
Total |
86 |
100 |
100 |
|
Table 9. Distribution of Hypertension.
Figure 9 gives the comparison between group 1 and 2 based on hypertension; of which only 11 patients in group 1 and 16 in group 2 are hypertensive. Major numbers of patients are not hypertensive, 32 and 27 patients respectively in group 1 and 2 (74.4% and 62.8% respectively). Statistically, it gives a p value of 0.245 (Table 10, Figure 10).
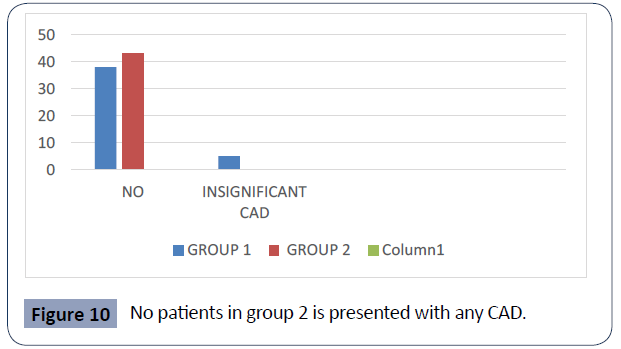
Figure 10 No patients in group 2 is presented with any CAD.
Table 10 represents the distribution of patients having CAD. 81 patients are without any cad (94.4%) while only 5 of them had insignificant CAD (5.9%)
| |
|
Frequency |
Percent |
Valid Percent |
Cumulative Percent |
| Valid |
No |
81 |
94.2 |
94.2 |
94.2 |
| |
Insignificant CAD |
5 |
5.8 |
5.8 |
100 |
| |
Total |
86 |
100 |
100 |
|
Table 10. Distribution of CAD.
Figure 10 represents comparison between group 1 and group 2 based upon the presence of any CAD. Group 1 have significantly higher number of patients in non CAD category (frequency of 38) which accounts for about 88.4%. A very few patients in group 1 comes under the class of insignificant CAD (frequency of 5) which is of 11.6%. No patients in group 2 are presented with any CAD. Statistically, it gives a p value of 0.055 (Table 11, Figure 11).
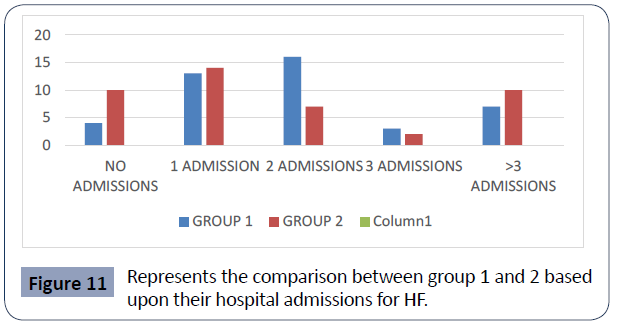
Figure 11 Represents the comparison between group 1 and 2 based upon their hospital admissions for HF.
Table 11 represents the distribution of the total patients according to their number of hospitalisation for heart failure. out of the 86 patients, 27 of them had undergone 1 admission, 23 of them had 2 hospital admissions, 5 had 3 admissions, 17 had more than 3 admissions, 14 of them had no admissions for HF. major number of patients had 1 admission, which accounts for about 31.4%.
| |
|
Frequency |
Percent |
Valid Percent |
Cumulative Percent |
| Valid |
No Admissions |
14 |
16.3 |
16.3 |
16.3 |
| |
1 Admission |
27 |
31.4 |
31.4 |
47.7 |
| |
2 Admissions |
23 |
26.7 |
26.7 |
74.4 |
| |
3 Admissions |
5 |
5.8 |
5.8 |
80.2 |
| |
>3 Admissions |
17 |
19.8 |
19.8 |
100 |
| |
Total |
86 |
100 |
100 |
|
Table 11. Distribution of Prior Hospitalization.
Figure 11 represents the comparison between group 1 and 2 based upon their hospital admissions for HF. Within the patients in group 1, majority of the patients had 2 admissions in the hospital for HF (frequency of 16) which is 37.2%. 4 of them had no admission (9.3%), 13 of them had 1 admission (30.2%),3 of them had 3 admissions (7%) and 7 of them had >3 admissions (16.3%).
Within group 2, 14 patients had 1 admission (32.6%), 10 had no admission (23.3%), 7 had 2 admissions (16.3%), 2 had 3 admissions (4.7%) and 10 had >3 admissions (23.3%). statistically, it has a p value of 0.143 (Table 12, Figure 12).
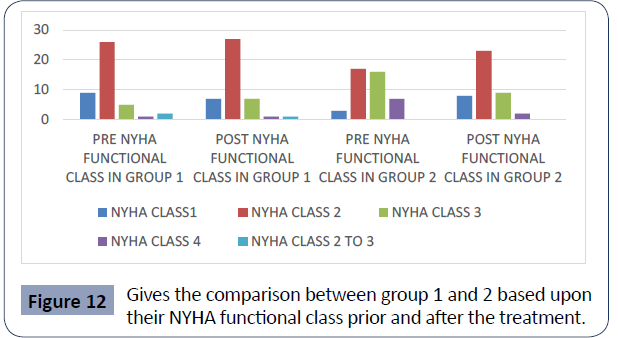
Figure 12 Gives the comparison between group 1 and 2 based upon their NYHA functional class prior and after the treatment..
Table 12 represents the distribution of NYHA functional class of the patients prior (12a) and after (12b) device implantation/ medical therapy. Prior to the treatment around 43 patients comes under NYHA class 2 (50%). Frequency of patients in class 3 and 4 are 21 and 8 respectively. Table 12 b too have a major number of patients on functional class 2(58.8%). however, the patients belonging to class 3 and 4 prior to the treatment is reduced to 16 and 3 respectively; which is depicted in table 12 b [8].
| |
|
Frequency |
Percent |
Valid Percent |
Cumulative Percent |
| Valid |
1 |
12 |
14 |
14 |
14 |
| |
2 |
43 |
50 |
50 |
64 |
| |
3 |
21 |
24.4 |
24.4 |
88.4 |
| |
4 |
8 |
9.3 |
9.3 |
97.7 |
| |
2 To 3 |
2 |
2.3 |
2.3 |
100 |
| |
Total |
86 |
100 |
100 |
|
Table 12a. Distribution of NYHA Functional Class (Pre).
| |
|
Frequency |
Percent |
Valid Percent |
Cumulative Percent |
| Valid |
1 |
15 |
17.4 |
17.6 |
17.6 |
| |
2 |
50 |
58.1 |
58.8 |
76.5 |
| |
3 |
16 |
18.6 |
18.8 |
95.3 |
| |
4 |
3 |
3.5 |
3.5 |
98.8 |
| |
2 To 3 |
1 |
1.2 |
1.2 |
100 |
| |
Total |
85 |
98.8 |
100 |
|
| Missing |
System |
1 |
1.2 |
|
|
| Total |
|
86 |
100 |
|
|
Table 12b. Distribution of NYHA Functional Class (Present).
Figure 12 gives the comparison between group 1 and 2 based upon their NYHA functional class prior and after the treatment. Within group 1 majority of patients are in class 2 prior and after the treatment (60.5% and 62.8% respectively). Within group 2, prior to the treatment major number of patients were in class 2 and 3(39.5% and 37.2% respectively); however after treatment, the group of patients within NYHA class 2 became greater (54.8%).
When we compare pre NYHA class of group 1 and 2, about 60.5% of patients in group 1 and only 39.5% patients in group 2 are under class 2. Statically, it is significant with a P value of 0.002. when we compare present NYHA class between group 1 and 2 ,there is no much difference in group 1 since around 62.8% of patients are still in class 2 while, 54.8% of patients in group 2 are under the class 2.statistically, it gives a p value of 0.743 (Table 13, Figure 13).
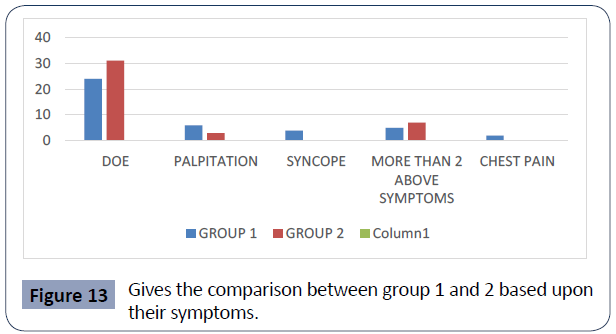
Figure 13 Gives the comparison between group 1 and 2 based upon their symptoms.
Table 13 represents the distribution of symptoms that the patients presented. A frequency of 55 patients were presented with dyspnea on exertion (67.1%). 9 patients presented with the symptom of palpitation, 4 patients presented with syncope, 12 patients presented with more than 2 of the above symptoms (14.6%) and 2 patients presented with chest pain.
| |
|
Frequency |
Percent |
Valid Percent |
Cumulative Percent |
| Valid |
DOE |
55 |
64 |
67.1 |
67.1 |
| |
Palpitation |
9 |
10.5 |
11 |
78 |
| |
Syncope |
4 |
4.7 |
4.9 |
82.9 |
| |
More Than 2 Above Symptoms |
12 |
14 |
14.6 |
97.6 |
| |
Chest Pain |
2 |
2.3 |
2.4 |
100 |
| |
Total |
82 |
95.3 |
100 |
|
| Missing |
System |
4 |
4.7 |
|
|
| Total |
|
86 |
100 |
|
|
Table 13. Distribution of symptoms presented by the patients.
Figure 13 gives the comparison between group 1 and 2 based upon their symptoms. in both group 1 and 2, most of the patients presented with doe (58.5% and 75.6% respectively). Statistically, it gives a p value of 0.084 (Table 14, Figure 14).
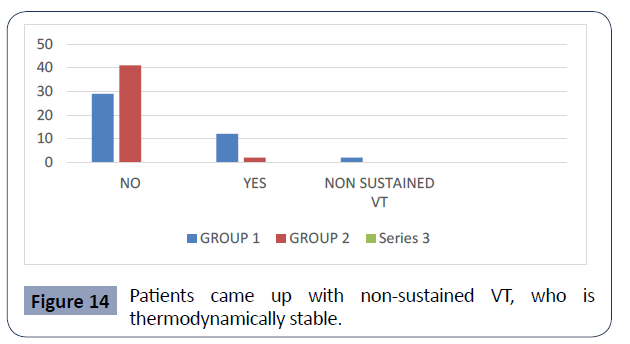
Figure 14 Patients came up with non-sustained VT, who is thermodynamically stable.
Table 14 represents the distribution of patients who had a history of ventricular arrhythmia (VT/VF) requiring treatment. A total of 70 patients (81.4%) did not had any episodes of aborted SCD.
| |
|
Frequency |
Percent |
Valid Percent |
Cumulative Percent |
| Valid |
No |
70 |
81.4 |
81.4 |
81.4 |
| |
Yes |
14 |
16.3 |
16.3 |
97.7 |
| |
Non-Sustained VT, Hemodynamic ally Stable |
2 |
2.3 |
2.3 |
100 |
| |
Total |
86 |
100 |
100 |
|
Table 14. Distribution of Aborted SCD.
14 patients (16.3%) showed episodes of aborted SCD (VT/VF). 2 patients (2.3%) showed non-sustained VT who are hemodynamic ally stable.
Figure 14 represents the comparison between group 1 and 2 based upon the episodes of aborted SCD. Within group 1, 29 patients (67.4%) had no episodes of aborted SCD while 12 patients (27.9%) received treatment for ventricular arrhythmia. Also, 2 patients came up with non-sustained VT, who is hemodynamic ally stable. Within group 2, 41 patients (95.3%) did not have any episodes of aborted SCD. Only 2 patients (4.7%) required treatment for VT/VF. Statistically, it is significant with a p value of 0.004 (Table 15, Figure 15).
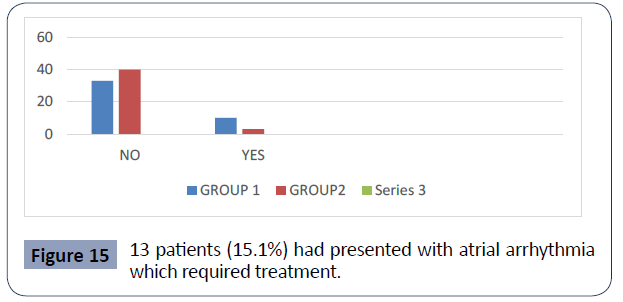
Figure 15 13 patients (15.1%) had presented with atrial arrhythmia which required treatment.
Table 15 represents distribution of patients who had a history of atrial arrhythmia requiring treatment. About 73 patients (84.9%) did not had any episodes of atrial arrhythmia which required treatment.13 patients (15.1%) had presented with atrial arrhythmia which required treatment.
| |
|
Frequency |
Percent |
Valid Percent |
Cumulative Percent |
| Valid |
No |
73 |
84.9 |
84.9 |
84.9 |
| |
Yes |
13 |
15.1 |
15.1 |
100 |
| |
Total |
86 |
100 |
100 |
|
Table 15. Distribution of Atrial Arrhythmia Requiring Treatment.
Figure 15 gives the comparison between group 1 and 2 based upon the history of atrial arrhythmia requiring treatment. Within group 1, 33 patients (76.7%) had no episodes of atrial arrhythmia requiring treatment.10 patients (23.3%) received treatment for atrial arrhythmia. within group 2, 43 patients (93%) had no episodes while 3 patients (7%) received treatment for atrial arrhythmia. Statistically, it gives a p value of 0.068 (Table 16a, Table 16b and Figure 16).
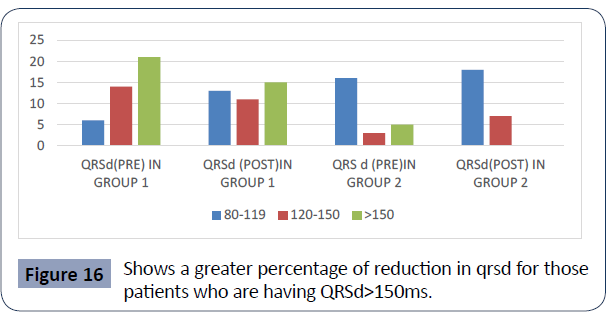
Figure 16 Shows a greater percentage of reduction in qrsd for those patients who are having QRSd>150ms.
Table 16 gives the distribution of QRS duration prior and after the treatment (16a and 16b respectively). From table 16a, the distribution represents that 22 patients have QRSd in between 80&119ms (25.6%), 17 patients have in between 120&150ms (19.8%), and 26 patients have QRSd >150ms (40%). from table 16b, the distribution presents that 31 patients (44.3%) have QRSd in between 80&119ms, 18 patients (25.7%) have QRSd in between 120&150ms and 21 patients (30%) are with QRSd >150ms.
| |
|
Frequency |
Percent |
Valid Percent |
Cumulative Percent |
| Valid |
80-119ms |
22 |
25.6 |
33.8 |
33.8 |
| |
120-150ms |
17 |
19.8 |
26.2 |
60 |
| |
|
|
|
|
|
| |
>150ms |
26 |
30.2 |
40 |
100 |
| |
Total |
65 |
75.6 |
100 |
- |
| Missing |
System |
21 |
24.4 |
- |
- |
| Total |
|
86 |
100 |
- |
- |
Table 16a. Distribution of QRS Duration (Pre).
| |
|
Frequency |
Percent |
Valid Percent |
Cumulative Percent |
| Valid |
80-119ms |
31 |
36 |
44.3 |
44.3 |
| |
120-150ms |
18 |
20.9 |
25.7 |
70 |
| |
|
|
|
|
|
| |
>150ms |
21 |
24.4 |
30 |
100 |
| |
Total |
70 |
81.4 |
100 |
- |
| Missing |
System |
16 |
18.6 |
- |
- |
| Total |
|
86 |
100 |
- |
- |
Table 16b. Distribution of QRS Duration (Present).
Figure 16 gives the comparison between group 1 and 2 based upon their QRS duration. Within group 1, 21 patients (51.2%) have QRSd >150ms, 14 patients (34.1%) have QRSd in between 120 and 150ms, 6 patients (14.6%) have QRSd in between 80 and 119ms prior to the treatment. Within group 1 after the device implantation, 15 patients (38.5%) have QRSd >150ms, 13 patients (33.3%) have QRSd in between 80 & 119ms, 11 patients (28.2%) have QRSd in between 120 & 150ms. It shows a greater percentage of reduction in qrsd for those patients who are having QRSd>150ms [9].
Within group 2,16 patients (66.7%) have QRSd in between 80 & 119 ms, 3 patients (12.5%) have QRSd in between 120 & 150ms, 5 patients (20.8%) have QRSd >150ms prior to the treatment. Within group 2 after the medical treatment, 18 patients (58.1%) have QRSd in between 80 & 119 ms, 7 patients (22.6%) have QRSd in between 120 & 150ms, 6 patients (19.4%) have QRSd >150ms.
Comparing the pre QRSd between group 1 and 2 depicts that group 1 patients predominantly have >150ms while majority of patients in group 2 have normal QRSd. statistically; it is significant with a p value of 0.000. In the post QRSd distribution between group 1 and 2, group 1 have similar number of patients both in >150ms and in normal QRSd class. Group 2 still has higher number patients within normal QRSd class. statistically, it gives a p value of 0.095 (Table 17, Figure 17).
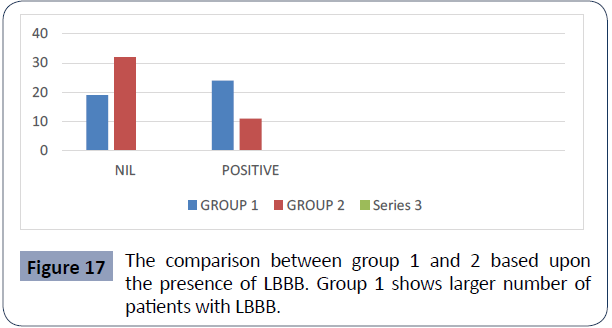
Figure 17 The comparison between group 1 and 2 based upon the presence of LBBB. Group 1 shows larger number of patients with LBBB.
Table 17 represents the distribution of patients with the presence of LBBB. 51 patients do not have LBBB while 35 patients are presented with LBBB.it gives 59.3% and 40.7% respectively. Figure 17 gives the comparison between group 1 and 2 based upon the presence of LBBB. Group 1 shows larger number of patients with LBBB (frequency of 24) which is of 55.8%. 19 patients within group 1 do not have LBBB (44.2%). within group 2 majority of the patients do not have LBBB ( frequency of 32 ) which is of 74.4%. 11 patients within this group shows LBBB (25.6%). Statistically, it becomes significant with a p value of 0.004 (Table 18, Figure 18).
| |
|
Frequency |
Percent |
Valid Percent |
Cumulative Percent |
| Valid |
Nil |
51 |
59.3 |
59.3 |
59.3 |
| |
Positive |
35 |
40.7 |
40.7 |
100 |
| |
Total |
86 |
100 |
100 |
|
Table 17. Distribution of LBBB.
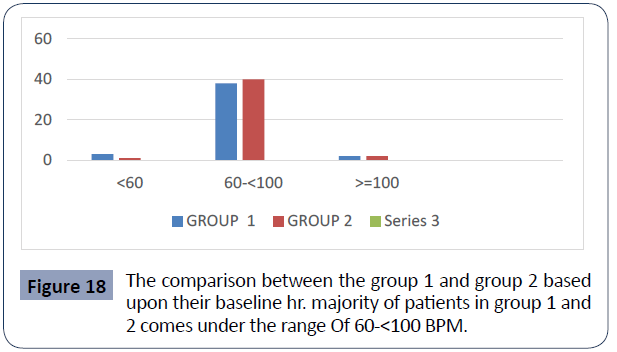
Figure 18 The comparison between the group 1 and group 2 based upon their baseline hr. majority of patients in group 1 and 2 comes under the range Of 60-<100 BPM.
Table 18 represents the distribution of baseline HR (in BPM) among the patients. 78 patients (90.7%) have normal HR. while 4 patients each, comes under class of <60 BPM as well as on >=100 category.
| |
|
Frequency |
Percent |
Valid Percent |
Cumulative Percent |
| Valid |
0 |
4 |
4.7 |
4.7 |
4.7 |
| |
1 |
78 |
90.7 |
90.7 |
95.3 |
| |
2 |
4 |
4.7 |
4.7 |
100 |
| |
Total |
86 |
100 |
100 |
|
Table 18. Distribution of Baseline HR.
Graph 18 gives the comparison between the group 1 and group 2 based upon their baseline hr. majority of patients in group 1 and 2 comes under the range of 60-<100 BPM. It Forms 88.4% And 93% Respectively. Statistically, it gives a p value of 0.591 (Table 19, Figure 19).
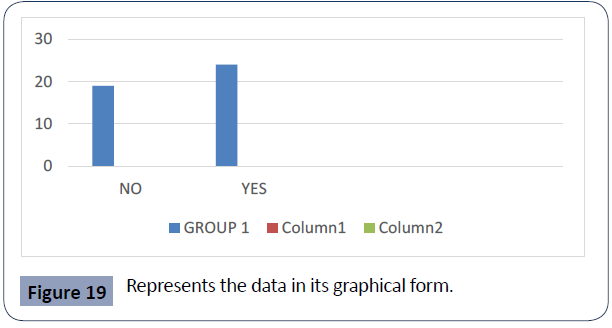
Figure 19 Represents the data in its graphical form.
Table 19 demonstrates the distribution of CRTD implantation among the group 1 patients. Out of the 43 patients in group 1, 24 patients have CRTD which is of 55.8%. While 19 patients are with AICD, which forms 44.2%. Graph 19 represents the data in its graphical form (Table 20, Figure 20).
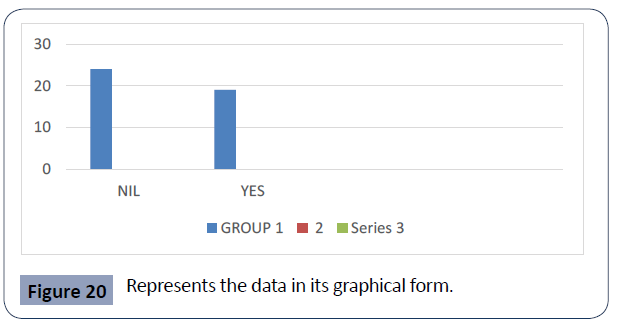
Figure 20 Represents the data in its graphical form.
| |
|
Frequency |
Percent |
Valid Percent |
Cumulative Percent |
| Valid |
No |
19 |
22.1 |
44.2 |
44.2 |
| |
Yes |
24 |
27.9 |
55.8 |
100 |
| |
Total |
43 |
50 |
100 |
|
| Missing |
System |
43 |
50 |
|
|
| Total |
|
86 |
100 |
|
|
Table 19. Distribution of CRTD Implantation.
Table 20 represents the distribution within group 1 who have received appropriate ICD therapy. 24 patients did not had any episodes of VT/VF (55.8%). 19 patients presented with multiple episodes of ICD therapy which is of 44.2%. Graph 20 represents the data in its graphical form (Table 21, Figure 21).
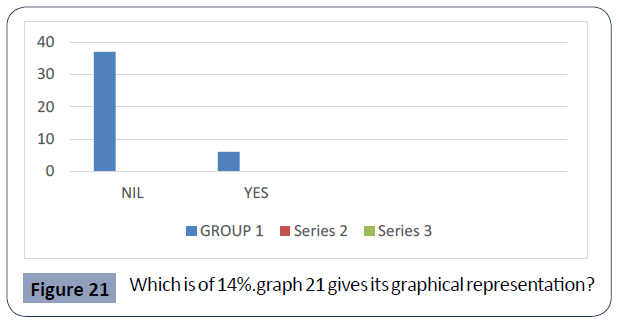
Figure 21 Which is of 14%.graph 21 gives its graphical representation?
| |
|
Frequency |
Percent |
Valid Percent |
Cumulative Percent |
| Valid |
No VT/VF |
24 |
27.9 |
55.8 |
55.8 |
| |
Multiple Episodes of ICD Therapy |
19 |
22.1 |
44.2 |
100 |
| |
Total |
43 |
50 |
100 |
- |
| Missing |
System |
43 |
50 |
- |
- |
| Total |
|
86 |
100 |
- |
- |
Table 20. Distribution of Appropriate ICD/ CRTD Therapy.
Table 21 gives the distribution of patients who had episodes of inappropriate shock from the implanted devices. 37 patients did not had any events of inappropriate shock which is of 86%. 6 patients showed episodes of inappropriate shocks, which is of 14%.graph 21 gives its graphical representation (Table 22, Figure 22).
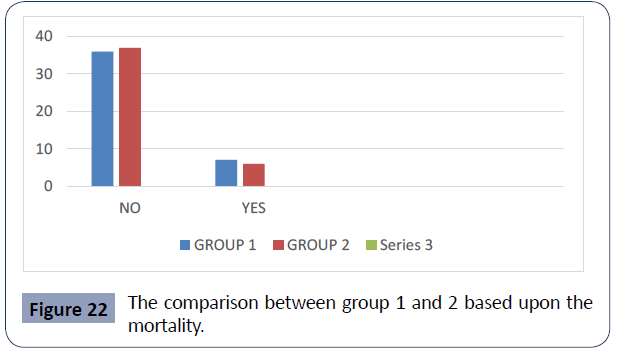
Figure 22 The comparison between group 1 and 2 based upon the mortality.
| |
|
Frequency |
Percent |
Valid Percent |
Cumulative Percent |
| Valid |
Nil |
37 |
43 |
86 |
86 |
| - |
Yes |
6 |
7 |
14 |
100 |
| - |
Total |
43 |
50 |
100 |
- |
| Missing |
System |
43 |
50 |
- |
- |
| Total |
|
86 |
100 |
- |
- |
Table 21. Distribution of Inappropriate Shock.
Table 22 represents the distribution of mortality among the total patients. 13 patients died among the total, which accounts of 15.1%. Graph 22 gives the comparison between group 1 and 2 based upon the mortality. 7 patients within group 1 died, which is of 16.3%.while 6 patients died within group 2 which is of 14%. however in both the groups majority of the patients doesn’t show mortality (83.7% and 87% respectively). Statistically, it gives a p value of 0.763 (Table 23, Figure 23).
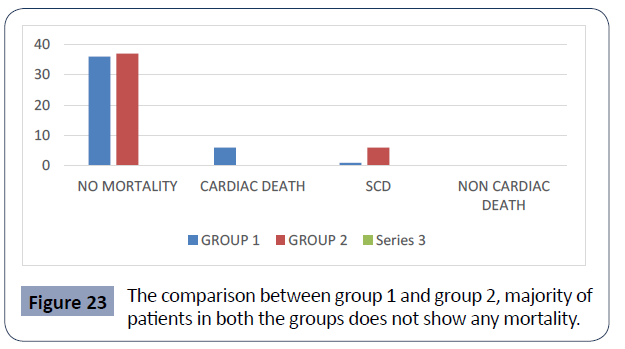
Figure 23 The comparison between group 1 and group 2, majority of patients in both the groups does not show any mortality.
| |
|
Frequency |
Percent |
Valid Percent |
Cumulative Percent |
| Valid |
No |
73 |
84.9 |
84.9 |
84.9 |
| |
Yes |
13 |
15.1 |
15.1 |
100 |
| |
Total |
86 |
100 |
100 |
|
Table 22. Distribution of Mortality among the Patients
Table 23 depicts the distribution of the cause of mortality among the patients. Out of the 13 patients who are died, 6 of them had heart failure related death, and 7 had SCD. Graph 23 gives the comparison between group 1 and group 2, majority of patients in both the groups does not show any mortality. Within the patients who are dead, heart failure related death was mostly found in group 1 (frequency of 6 patients) which is of 14%. Only 1 patient within this group had SCD (2.3%). Within group 2, only 6 patients showed mortality and all the six had SCD (14%). statistically, it becomes significant with a p value of 0.008 (Table 24, Figure 24).
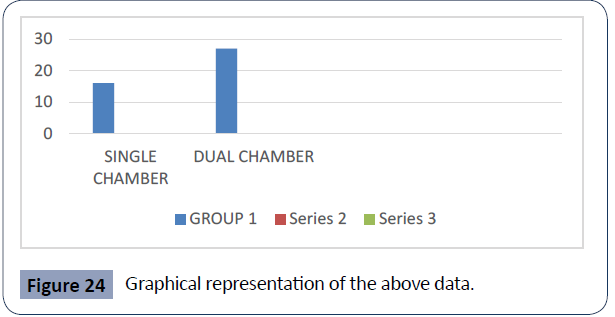
Figure 24 Graphical representation of the above data.
| |
|
Frequency |
Percent |
Valid Percent |
Cumulative Percent |
| Valid |
No Mortality |
73 |
84.9 |
84.9 |
84.9 |
| |
Heart Failure Related Death |
6 |
7 |
7 |
91.9 |
| |
SCD |
7 |
8.1 |
8.1 |
100 |
| |
Total |
86 |
100 |
100 |
|
Table 23. Distribution of Cause of Mortality.
Table 24 represents the distribution of chamber selection among the patients with AICD/CRTD. A frequency of 27 patients (62.8%) has double chamber device. 16 patients have single chamber device (37.2%). Graph 24 is a graphical representation of the above data (Table 25, Figure 25a, 25b).
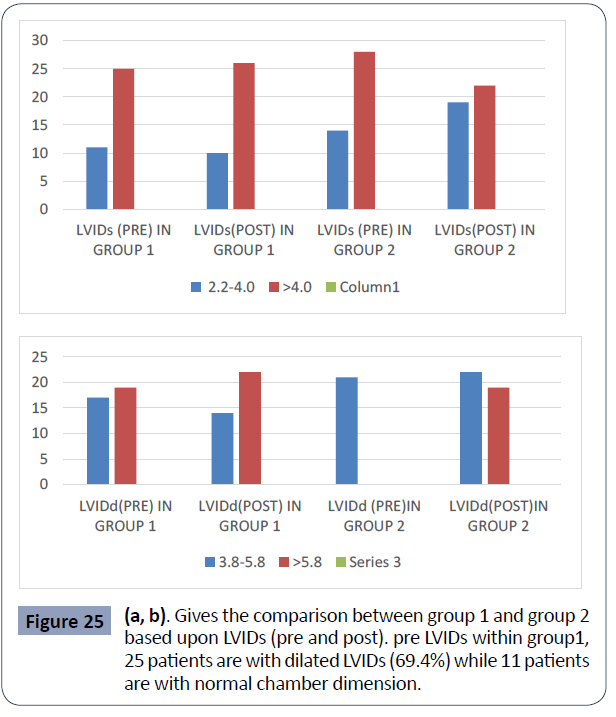
Figure 25 (a, b). Gives the comparison between group 1 and group 2 based upon LVIDs (pre and post). pre LVIDs within group1, 25 patients are with dilated LVIDs (69.4%) while 11 patients are with normal chamber dimension.
| |
|
Frequency |
Percent |
Valid Percent |
Cumulative Percent |
| Valid |
Single Chamber |
16 |
18.6 |
37.2 |
37.2 |
| |
Dual Chamber |
27 |
31.4 |
62.8 |
100 |
| |
Total |
43 |
50 |
100 |
|
| Missing |
System |
43 |
50 |
|
|
| Total |
|
86 |
100 |
|
|
Table 24. Distribution of Device Chamber Selection.
Table 25 gives the distribution of pre and post LV internal diameter (systole and diastole). Table 25a suggests that 53 patients (67.9%) have dilated LV internal diameter (systole) and 25 patients have normal dimension prior to the treatment. Table 25b suggests that 40 patients (51.3%) have dilated LV internal diameter (diastole) and 38 patients have normal dimension, which is prior to the treatment. Table 25c interprets that 48 patients have dilated LVIDs (62.3%) after the treatment .Table 25d represents that 41 patients are with dilated LVIDd (53.2%) after the treatment.
| |
|
Frequency |
Percent |
Valid Percent |
Cumulative Percent |
| Valid |
2.2-4.0 |
25 |
29.1 |
32.1 |
32.1 |
| - |
>4.0 |
53 |
61.6 |
67.9 |
100 |
| - |
Total |
78 |
90.7 |
100 |
- |
| Missing |
System |
8 |
9.3 |
- |
- |
| Total |
|
86 |
100 |
- |
- |
| |
|
Frequency |
Percent |
Valid Percent |
Cumulative Percent |
| Valid |
3.8-5.8 |
38 |
44.2 |
48.7 |
48.7 |
| |
>5.8 |
40 |
46.5 |
51.3 |
100 |
| |
Total |
78 |
90.7 |
100 |
- |
| Missing |
System |
8 |
9.3 |
- |
- |
| Total |
|
86 |
100 |
- |
- |
a) LVIDs (Pre)
| |
|
Frequency |
Percent |
Valid Percent |
Cumulative Percent |
| Valid |
2.2-4.0 |
29 |
33.7 |
37.7 |
37.7 |
| |
4 |
48 |
55.8 |
62.3 |
100 |
| |
Total |
77 |
89.5 |
100 |
|
| Missing |
System |
9 |
10.5 |
|
|
| Total |
|
86 |
100 |
|
|
c) LVID s (Post)
| |
|
Frequency |
Percent |
Valid Percent |
Cumulative Percent |
| Valid |
3.8-5.8 |
36 |
41.9 |
46.8 |
46.8 |
| |
>5.8 |
41 |
47.7 |
53.2 |
100 |
| |
Total |
77 |
89.5 |
100 |
|
| Missing |
System |
9 |
10.5 |
|
|
| Total |
|
86 |
100 |
|
|
d) LVID d (Post)
Table 25. Distribution of Echo Reports- LV Internal Diameter (Systole and Diastole).
Figure 25a gives the comparison between group 1 and group 2 based upon LVIDs (pre and post). pre LVIDs: within group 1, 25 patients are with dilated LVIDs (69.4%) while 11 patients are with normal chamber dimension .Within group 2, 28 patients are with dilated LVIDs (66.7%), while 14 are with normal chamber dimension. The given p value is 0.793
Post LVIDs: Within group 1,26 patients are with dilated LVIDs (72.2%) while 10 patients are with normal chamber dimension. Within group 2, 22 patients are with dilated LVIDs (53.7%) while 19 patients have normal chamber dimension.it gives a p value of 0.093 [10].
Figure 25 b represents the comparison between group 1 and group 2 based upon LVIDd (pre and post)
Pre LVIDd: within group 1, 19 patients are having dilated LVIDd (52.8%).group 2 has 21 patients (50%) who are with dilated LVIDd. It gives a p value of 0.807
Post LVIDd: within group 1, 22 patients are with dilated LVIDd (61.1%). Group 2 have 19 patients (46.3%) with dilated LVIDd. It gives a p value of 0.195 (Table 26, Figure 26).
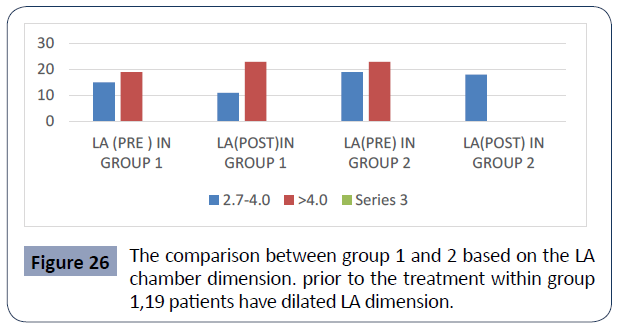
Figure 26 The comparison between group 1 and 2 based on the LA chamber dimension. prior to the treatment within group 1,19 patients have dilated LA dimension.
Table 26 a represents LA chamber dimension prior to the treatment. 42 patients have dilated LA chamber dimension (48.8%). 34 patients have normal chamber dimension (39.5%). Table 26 b gives the LA chamber dimension after the treatment.45 patients have dilated LA dimension (52.3%).29 patients have normal LA dimension.
| a) LA(Pre ) |
|
|
|
|
|
| |
|
Frequency |
Percent |
Valid Percent |
Cumulative Percent |
| Valid |
2.7-4.0 |
34 |
39.5 |
44.7 |
44.7 |
| |
>4.0 |
42 |
48.8 |
55.3 |
100 |
| |
Total |
76 |
88.4 |
100 |
|
| Missing |
System |
10 |
11.6 |
|
|
| Total |
|
86 |
100 |
|
|
| b) LA (Post ) |
|
|
|
|
|
| |
|
Frequency |
Percent |
Valid Percent |
Cumulative Percent |
| Valid |
2.7 |
29 |
33.7 |
39.2 |
39.2 |
| |
4 |
45 |
52.3 |
60.8 |
100 |
| |
Total |
74 |
86 |
100 |
|
| Missing |
System |
12 |
14 |
|
|
| Total |
|
86 |
100 |
|
|
Table 26. Distribution of LA Dimension.
Figure 26 gives the comparison between group 1 and 2 based on the LA chamber dimension. Prior to the treatment within group 1,19 patients have dilated LA dimension (55.9%), while 15 patients have normal dimension (44.1%). within group 2, 23 patients have dilated LA dimension (54.8%) and 19 patients (45.2%) have normal LA dimension. It gives a p value of0.922.
After the treatment, within group 1, 23 patients had dilated LA chamber dimension (67.6%) while 11 patients had normal chamber dimension. Within group 2, 22 patients had dilated LA dimension (55%).18 patients had normal LA dimension (Table 27, Figure 27).
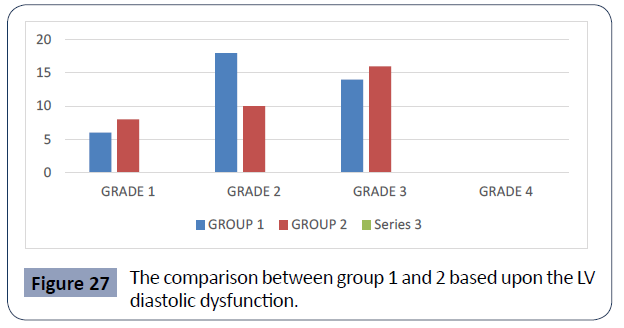
Figure 27 The comparison between group 1 and 2 based upon the LV diastolic dysfunction.
Table 27 represents the distribution of LV diastolic dysfunction.62 patients (72.1%) patients are with grade 3 diastolic dysfunction. 30 patients (34.9%) are with grade 2 diastolic dysfunction. 18 patients (20.9%) are with grade 1 diastolic dysfunction.
| |
|
Frequency |
Percent |
Valid Percent |
Cumulative Percent |
| Valid |
Grade 1 |
14 |
16.3 |
22.6 |
22.6 |
| |
Grade 2 |
18 |
20.9 |
29 |
51.6 |
| |
Grade 3 |
30 |
34.9 |
48.4 |
100 |
| |
Total |
62 |
72.1 |
100 |
- |
| Missing |
System |
24 |
27.9 |
- |
- |
| Total |
|
86 |
100 |
- |
- |
Table 27. Distribution of LV Diastolic Dysfunction.
Figure 27 gives the comparison between group 1 and 2 based upon the LV diastolic dysfunction. Within group 1, 14 patients are with grade 3 (50%), 8 patients with grade 2(28.6%) and 6 patients with grade 1 diastolic dysfunction (21.4%). Within group 2, 16 patients are with grade 3(47.4%), 10 patients are with grade 2(29.4%) and 8 patients are with grade 1 diastolic dysfunction (23.5%) (Table 28, Figure 28).
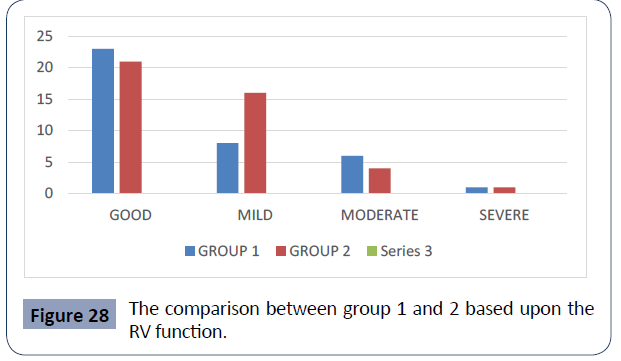
Figure 28 The comparison between group 1 and 2 based upon the RV function.
Table 28 is the distribution of RV function among the patients. 44 patients are having good RV function, which constitute 55%.24 patients are with mild (27.9%), 10 patients are with moderate (11.6%) and 2 patients are with severe RV dysfunction(2.3%).
| |
|
Frequency |
Percent |
Valid Percent |
Cumulative Percent |
| Valid |
Good |
44 |
51.2 |
55 |
55 |
| |
Mild |
24 |
27.9 |
30 |
85 |
| |
Moderate |
10 |
11.6 |
12.5 |
97.5 |
| |
Severe |
2 |
2.3 |
2.5 |
100 |
| |
Total |
80 |
93 |
100 |
- |
| Missing |
System |
6 |
7 |
- |
- |
| Total |
|
86 |
100 |
- |
- |
Table 28. Distribution of RV Function.
Figure 28 gives the comparison between group 1 and 2 based upon the RV function. Within group 1, 23 patients are with good RV function which constitutes 60.5%. 8 patients (21.1%) are with mild, 6 patients (15.8%) are with moderate, and 1 patient is with severe RV dysfunction (2.6%). within group 2, 21 patients are with good RV function which constitute 50%. 16 patients are with mild (38.1%), 4 patients are with moderate (9.5%) and 1 patient is with severe RV dysfunction (2.4%). it gives a p value of 0.397 (Table 29, Figure 29).
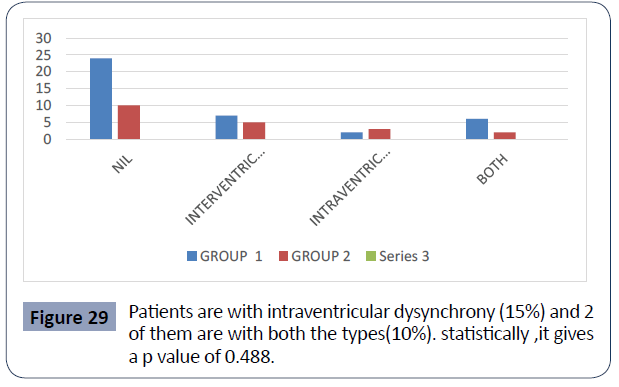
Figure 29 Patients are with intraventricular dysynchrony (15%) and 2 of them are with both the types(10%). statistically ,it gives a p value of 0.488.
| |
|
Frequency |
Percent |
Valid Percent |
Cumulative Percent |
| Valid |
Nil |
34 |
39.5 |
57.6 |
57.6 |
| |
Intraventricular Dysynchrony |
12 |
14 |
20.3 |
78 |
| |
Intraventricular Dysynchrony |
5 |
5.8 |
8.5 |
86.4 |
| |
Both |
8 |
9.3 |
13.6 |
100 |
| |
Total |
59 |
68.6 |
100 |
- |
| Missing |
System |
27 |
31.4 |
- |
- |
| Total |
|
86 |
100 |
- |
- |
Table 29. Distribution of Dysynchrony.
Table 29 represents the distribution of the ventricular dysynchrony among the patients. 34 patients doesn’t show any ventricular dysynchrony which is of 57.6%. 12 patients shows intraventricular dysynchrony (20.3%), 5 patients shows intraventricular dysynchrony (8.5%) and 8 patients shows both intra and intraventricular dysynchrony (13.6%).
Figure 29 depicts the comparison between group 1 and 2 based upon the ventricular dysynchrony. Within group 1, 24 patients don’t have any ventricular dysynchrony which constitute 61.5%. 7 patients show intraventricular dysynchrony (17.9%), 2 patients are with intraventricular dysynchrony (5.1%)y and 6 patients are with both (15.4%). within group 2, 10 patients doesn’t show any type of ventricular dysynchrony which constitute 50%. 5 patients show intraventricular dysynchrony (25%),3 patients are with intraventricular dysynchrony (15%) and 2 of them are with both the types (10%). statistically ,it gives a p value of 0.488 (Table 30, Figure 30).
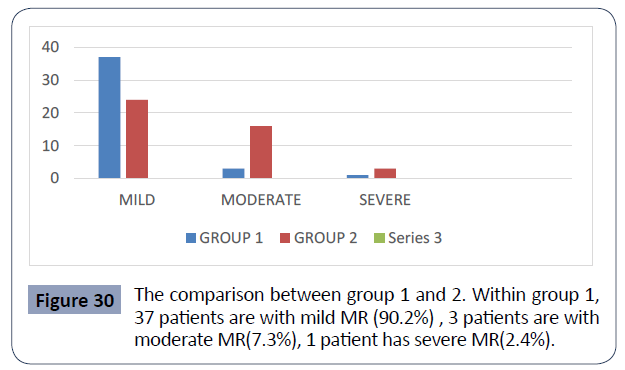
Figure 30 The comparison between group 1 and 2. Within group 1, 37 patients are with mild MR (90.2%) , 3 patients are with moderate MR(7.3%), 1 patient has severe MR(2.4%).
Table 30 represents the distributions of MR among the patients.61 patients have mild MR which is of 72.6%.19 patients are with moderate MR (22.6%). 4 patients have severe MR (4.7%).
| |
|
Frequency |
Percent |
Valid Percent |
Cumulative Percent |
| Valid |
Mild |
61 |
70.9 |
72.6 |
72.6 |
| |
Moderate |
19 |
22.1 |
22.6 |
95.2 |
| |
Severe |
4 |
4.7 |
4.8 |
100 |
| |
Total |
84 |
97.7 |
100 |
|
| Missing |
System |
2 |
2.3 |
|
|
| Total |
|
86 |
100 |
|
|
Table 30. Distribution of MR
Figure 30 gives the comparison between group 1 and 2. Within group 1, 37 patients are with mild MR (90.2%) , 3 patients are with moderate MR (7.3%), 1 patient has severe MR(2.4%). Within group 2, 24 patients are with mild MR (55.8%), 16 of them have moderate MR (37.2%) and 3 of them have severe MR (7%). statistically, it is significant with a p value of 0.002 (Table 31, Figure 31).
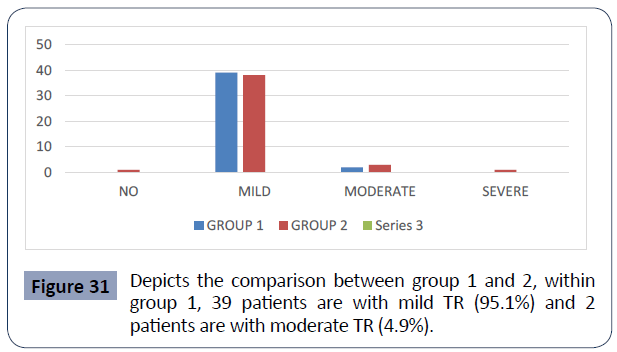
Figure 31 Depicts the comparison between group 1 and 2, within group 1, 39 patients are with mild TR (95.1%) and 2 patients are with moderate TR (4.9%).
Table 31 represents the distribution of TR among the patients. 77 patients are with mild TR which constitutes 91.7%. 5 patients are with moderate TR (6%), 1 of them with severe TR (1.2%), and 1 with no TR (1.2%).
| |
|
Frequency |
Percent |
Valid Percent |
Cumulative Percent |
| Valid |
No |
1 |
1.2 |
1.2 |
1.2 |
| |
Mild |
77 |
89.5 |
91.7 |
92.9 |
| |
Moderate |
5 |
5.8 |
6 |
98.8 |
| |
Severe |
1 |
1.2 |
1.2 |
100 |
| |
Total |
84 |
97.7 |
100 |
|
| Missing |
System |
2 |
2.3 |
|
|
| Total |
|
86 |
100 |
|
|
Table 31. Distribution of TR.
Figure 31 depicts the comparison between group 1 and 2, within group 1, 39 patients are with mild TR (95.1%) and 2 patients are with moderate TR (4.9%). within group 2, 38 patients are with mild TR (88.4%), 3 patients are with moderate TR (7%), 1 patient with severe TR (2.3%) and 1 with no TR (2.3%) (Table 32, Figure 32).
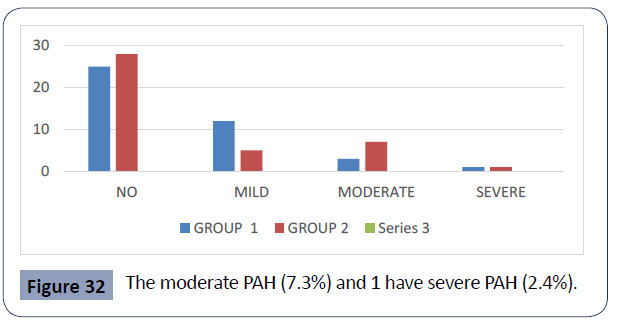
Figure 32 The moderate PAH (7.3%) and 1 have severe PAH (2.4%).
Table 32 represents the distribution of PAH among the patients. 53 patients have no PAH which is of 64.6%.17 of them have mild PAH (20.7%).10 are having moderate PAH (12.2%). Only 2 patients are presented with severe PAH which constitute 2.4%.
| |
|
Frequency |
Percent |
Valid Percent |
Cumulative Percent |
| Valid |
No |
53 |
61.6 |
64.6 |
64.6 |
| |
Mild |
17 |
19.8 |
20.7 |
85.4 |
| |
Moderate |
10 |
11.6 |
12.2 |
97.6 |
| |
Severe |
2 |
2.3 |
2.4 |
100 |
| |
Total |
82 |
95.3 |
100 |
|
| Missing |
System |
4 |
4.7 |
|
|
| Total |
|
86 |
100 |
|
|
Table 32. Distribution of PAH.
Figure 32 gives the comparison between group 1 and 2. Within group 1, 25 patients do not have PAH which is of 61%. 12 of them have mild PAH (29.3%), 3 have moderate PAH (7.3%),and 1 have severe PAH (2.4%). within group 2, 28 patients have no PAH which constitute 68.3%. 5 patients have mild PAH (12.2%), 7 of them have moderate PAH (17.1%) and 1 have severe PAH (2.4%).
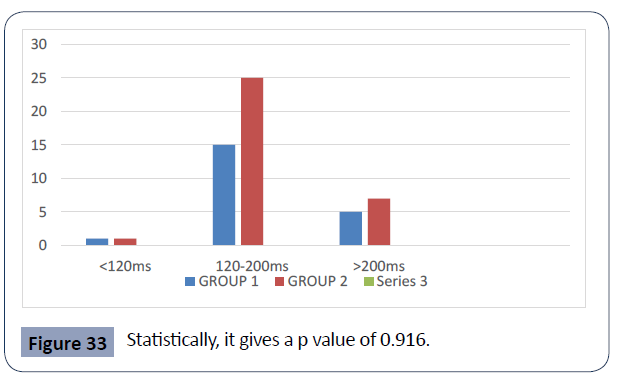
Statistically, it gives a p value of 0.199 (Table 33, Figure 33). Table 33 gives the distribution of PAH interval .40 patients have normal PAH interval (74.1%). 12 patients have pr interval >200ms (22.2%) and 2 of them have pr interval <120ms (3.7%).
Figure 33 Statistically, it gives a p value of 0.916.
| |
|
Frequency |
Percent |
Valid Percent |
Cumulative Percent |
| Valid |
<120ms |
2 |
2.3 |
3.7 |
3.7 |
| |
120-200ms |
40 |
46.5 |
74.1 |
77.8 |
| |
>200ms |
12 |
14 |
22.2 |
100 |
| |
Total |
54 |
62.8 |
100 |
- |
| Missing |
System |
32 |
37.2 |
- |
- |
| Total |
- |
86 |
100 |
- |
- |
Table 33. Distribution of PR Interval.
Figure 33 represents the comparison between group 1 and 2. Within group 1, 15 patients have normal PAH interval which constitute 71.4%. 5 have >200ms of PAH interval (23.8%) and 1 of them have <120ms of PAH interval (4.8%). within group 2, 25 patients have normal PAH inerval which is of 75.8%. 7 of them have PR interval >200ms (21.2%) and 1 have PAH interval <120ms (3%). statistically, it gives a p value of 0.916 (Table 34).
| |
|
Frequency |
Percent |
Valid Percent |
Cumulative Percent |
| Valid |
Absent |
3 |
3.5 |
25 |
25 |
| |
Present |
9 |
10.5 |
75 |
100 |
| |
Total |
12 |
14 |
100 |
- |
| Missing |
System |
74 |
86 |
- |
- |
| Total |
|
86 |
100 |
- |
- |
Table 34. Distribution of AV Block.
The above table gives the distribution of AV block. The data regarding AV block (Through holter reports) was available for only 12 patients. Within them 9 had AV block (75%) and 3 patients haven’t. Out of the 9 patients, 6 of them belong to group 1 and 3 of them in group 2 (Table 35).
| |
|
Frequency |
Percent |
Valid Percent |
Cumulative Percent |
| Valid |
Absent |
3 |
3.5 |
37.5 |
37.5 |
| |
Present |
5 |
5.8 |
62.5 |
100 |
| |
Total |
8 |
9.3 |
100 |
- |
| Missing |
System |
78 |
90.7 |
- |
- |
| Total |
|
86 |
100 |
- |
- |
Table 35. Distribution of IVCD.
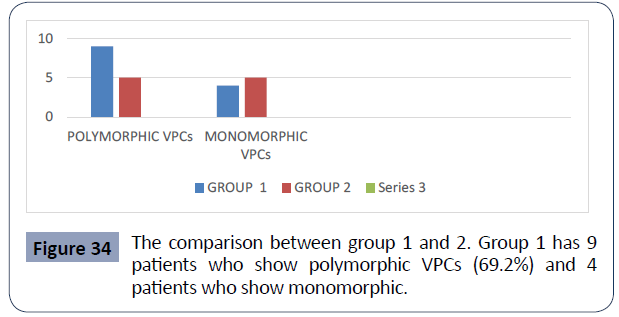
This table represents the distribution of IVCD among the data available from 8 patients (through holter reports). 5 patients had IVCD which is of 62.5% 3 of them had. Out of the 5 patients who have ivcd, 3 of them belong to group 1 and 2 of them in group 2 (Table 36, Figure 34).
Figure 34 The comparison between group 1 and 2. Group 1 has 9 patients who show polymorphic VPCs (69.2%) and 4 patients who show monomorphic.
Table 36 represents the morphology of VPCs among 23 patients. 14 patients are with polymorphic VPCs (60.9%). 9 patients are with monomorphic VPCs (39.1%).
| |
|
Frequency |
Percent |
Valid Percent |
Cumulative Percent |
| Valid |
Polymorphic |
14 |
16.3 |
60.9 |
60.9 |
| |
Monomorphic |
9 |
10.5 |
39.1 |
100 |
| |
Total |
23 |
26.7 |
100 |
- |
| Missing |
System |
63 |
73.3 |
- |
- |
| Total |
- |
86 |
100 |
- |
- |
Table 36. Distribution of Morphology of VPCs.
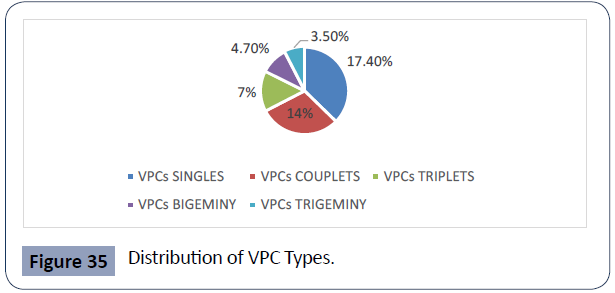
Figure 34 gives the comparison between group 1 and 2. group 1 has 9 patients who show polymorphic VPCs (69.2%) and 4 patients who show monomorphic VPCs (30.8%) group 2 has 5 patients who shows polymorphic VPCs (50%) and 5 patients with monomorphic VPCs (50%). The graph represents the distribution of VPC types (through holter reports). VPC singles form 17.4%.
Couplets form 14%. Triplets form 7%. Bigeminy form 4.7% and trigeminy forms 3.5%. Comparing group 1 and 2, group 2 has higher frequency of trigeminy and bigeminy. The frequency of couplets and triplets are similar between group 1 and 2.while the frequency of VPC singles are higher within group 1 (Table 37, Figure 35). Only 3 patient’s show prolonged pauses during holter study. 2 patients are from group 1 and 1 patient is from group 2 (Table 38 Figure 36).
Figure 35 Distribution of VPC Types.
| |
|
Frequency |
Percent |
Valid Percent |
Cumulative Percent |
| Valid |
Yes |
3 |
3.5 |
100 |
100 |
| Missing |
System |
83 |
96.5 |
- |
- |
| Total |
- |
86 |
100 |
- |
- |
Table 37. Distribution of Prolonged Pauses.
Table 38 represents the distribution of myocardial scar in patients who had MRI. Out of the 26 patients, 12 patients are with myocardial scar (46.2%) and 14 patients do not have myocardial scar (53.8%).
| |
|
Frequency |
Percent |
Valid Percent |
Cumulative Percent |
| Valid |
Absent |
14 |
16.3 |
53.8 |
53.8 |
| |
Present |
12 |
14 |
46.2 |
100 |
| |
Total |
26 |
30.2 |
100 |
|
| Missing |
System |
60 |
69.8 |
|
|
| Total |
|
86 |
100 |
|
|
Table 38. Distribution of Myocardial Scar.
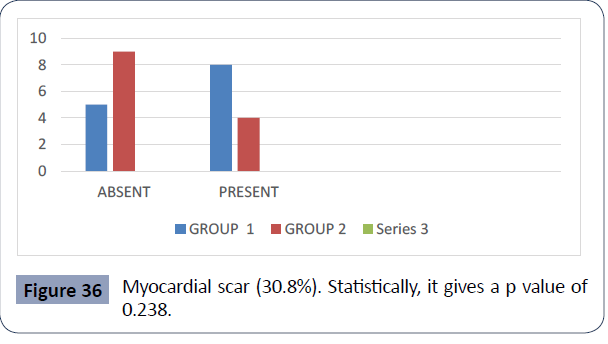
Figure 36 gives the comparison between group 1 and 2. Within group 1, 8 patients have myocardial scar (61.5%), 5 patients do not (38.5%). Within group 2, 9 patients are with myocardial scar which constitute 69.2%. 4 patients within this group do not have myocardial scar (30.8%). Statistically, it gives a p value of 0.238 (Table 39, Figure 37).
Figure 36 Myocardial scar (30.8%). Statistically, it gives a p value of 0.238.
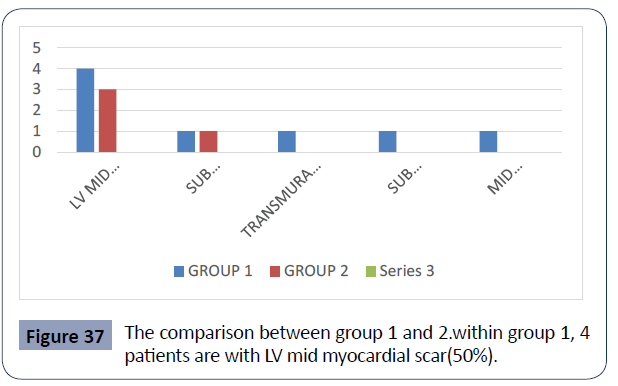
Figure 37 The comparison between group 1 and 2.within group 1, 4 patients are with LV mid myocardial scar(50%)
Table 39 represents the distribution of LGE among the 12 patients who show the presence of myocardial scar on MRI. 7 patients are with LV mid myocardial scar (58.3%), 2 patients are with sub endocardial scar (16.7%), 1 patient each with trans mural scar ,sub pericardial scar and mid myocardial + sub epicardialscar (8.3% each).
| |
|
Frequency |
Percent |
Valid Percent |
Cumulative Percent |
| Valid |
LV Mid Myocardial Scar |
7 |
8.1 |
58.3 |
58.3 |
| |
Sub Endocardia Scar |
2 |
2.3 |
16.7 |
75 |
| |
Trans mural Scar |
1 |
1.2 |
8.3 |
83.3 |
| |
Sub Epicardial Scar |
1 |
1.2 |
8.3 |
91.7 |
| |
Mid Myocardial Scar+ Sub Epicardial Scar |
1 |
1.2 |
8.3 |
100 |
| |
Total |
12 |
14 |
100 |
- |
| Missing |
System |
74 |
86 |
- |
- |
| Total |
|
86 |
100 |
- |
- |
Table 39. Distribution of LGE.
Graph 37 gives the comparison between group 1 and 2.within group 1, 4 patients are with LV mid myocardial scar(50%),1 patient each with sub endocardial scar, transmural scar, sub epicardial scar, mid myocardial + sub epicardial scar (12.5% each). within group 2, 3 patients are with LV Mid Myocardial Scar (75%) And 1 Patient with Sub Endocardial Scar (25%) (Table 40, Figure 38).
Figure 38 The comparison between group 1 and 2. Within group 1, 34 patients have no episodes of stroke which is of 79.1%. 9 patients (20.9%).
Table 40 represents the distribution of stroke among the patients.
| |
|
Frequency |
Percent |
Valid Percent |
Cumulative Percent |
| Valid |
Nil |
72 |
83.7 |
83.7 |
83.7 |
| |
Present |
14 |
16.3 |
16.3 |
100 |
| |
Total |
86 |
100 |
100 |
- |
Table 40. Distribution of Stroke.
72 patients doesn’t present any episodes of stroke (83.7%). 14 patients show events of stroke which is of 16.3%.
Figure 38 gives the comparison between group 1 and 2. Within group 1, 34 patients have no episodes of stroke which is of 79.1%. 9 patients (20.9%) within this group shows stroke episodes. within group 2, 38 patients have no events of stroke which is of 88.4%. 5 patients have episodes of stroke (11.6%). Statistically, it gives a p value of 0.243 (Table 41 Figure 39).
Figure 39 All the patients within group 2 does not show any events of endocarditis.
Table 41 represents the distribution of endocarditis among the patients. Only 1 patient had an episode of endocarditis (1.2%). Remaining 85 patients does not have any events of endocarditis (98.8%).
| |
|
Frequency |
Percent |
Valid Percent |
Cumulative Percent |
| Valid |
Nil |
85 |
98.8 |
98.8 |
98.8 |
| |
Present |
1 |
1.2 |
1.2 |
100 |
| |
Total |
86 |
100 |
100 |
|
Table 41. Distribution of Endocarditis.
Graph 39 gives the comparison between group 1 and 2. All the patients within group 2 don’t show any events of endocarditis. Within group 1, only 1 patient showed endocarditis (2.3%). Statistically it gives a p value of 1.00 (Table 42 Figure 40).
Figure 40 Graphical representation of the above data.
Table 42 represents the distribution of recommended AICD/CRTD among the group 2 patients. AICD/CRTD were recommended for 11 patients in this group which is of 25.6%. In 32 patients, it is considered to be not recommended (74.4%). Graph 40 is a graphical representation of the above data (Figure 41a, Figure 41b).
Figure 41 Distribution of Medications.
| |
|
Frequency |
Percent |
Valid Percent |
Cumulative Percent |
| Valid |
Nil |
32 |
37.2 |
74.4 |
74.4 |
| |
Yes |
11 |
12.8 |
25.6 |
100 |
| |
Total |
43 |
50 |
100 |
|
| Missing |
System |
43 |
50 |
|
|
| Total |
|
86 |
100 |
|
|
Table 42. Distribution of Recommended AICD/CRTD In Group 2.
Figure 41a gives the distribution of medications within group 1 patients and 41b gives the distribution of medications within group 2. Within group 1, 27 patients are active on ACEI/ARB/ ARNI which is of 65.9%. Within group 2, all the patients are active on this medication (100%). statistically, it becomes significant with a p value of 0.000.
Within group 1, 14 patients are active on the medication, aldosterone inhibitor which constitute 34.1%. Regarding group 2, 28 patients are having this medication (65.1%). statistically, it becomes significant with a p value of 0.005.
Within group 1, 18 patients are active on amiodarone which is of 43.9%. Group 2 have 3 patients who are active on amiodarone which accounts for 7%. Statistically, it is significant with a p value of 0.000
Group 1 have 40 patients (97.6%) and group 2 have 41 patients (95.3%) who are on beta blockers. Statistically, it gives a p value of 1.000.
Group 1 have 5 patients who are on SGLT 2 inhibitors with 12.2% while there are no patients within group 2 who are on this medication. This gives a p value of 0.024 which is statistically significant.
35 patients from group 1 and 34 patients from group 2 are on diuretics which form 85.4% and 79.1% respectively. It gives a p value of 0.451; which is statistically insignificant.
Within group 1, 29 patients are active on statins which constitute 70.7%. Within group 2, 24 patients are on statins which is of 55.8%. Statistically, it gives a p value of 0.157 [7-10].
Group 1 have 12 patients and group 2 have 21 patients who are on anti- platelet therapy. This constitute 29.3% and 48.8% respectively. Statistically, it gives a p value of 0.066.
17 patients within group 1 (41.5%) and 14 patients within group 2(32.6%) are on anti-coagulant medications. Statistically, it gives a p value of 0.398.
Group 1 have 7 patients who are active on digoxin which is of 16.7%. Group 2 have 21 patients who are on active on digoxin which is of 51.2%. It gives a p value of 0.003 which becomes statistically significant.
Discussion
This study comprised of 86 patients who are diagnosed with dilated cardiomyopathy. They are divided into two groups, group 1 have 43 patients with implanted AICD/CRTD and group 2 (control population) have 43 patients without AICD/CRTD. their baseline characteristics including the demographic variables and clinical data was analysed and their cardiovascular outcomes were obtained. the mean follow up period of total patients is 6.2+ 4.4 years. for group 1 , it is 6.1+4.7 years and for group 2 , it is 6.4+4.2 years.
67 patients (67/86: 79.8%) had LVEF <35% prior to the initiation of the treatment. Out of this 67 patients, 35 patients (35/43:83.3%) belong to group 1 and 32 patients (32/43:76.2%) belong to group 2. On follow up, the frequency of patients with EF<35% had reduced to 23 patients (23/43:54.8%) and 14 patients (14/43:36.8%) within group 1 and 2 respectively.
All the patients show normal epicardial coronaries, except 5 patients having insignificant cad. 55 patients (55/86:67.1%) were presented with the symptom, dyspnea on exertion. While 12 patients (12/86:14.6%) were presented with more than two symptoms like syncope and palpitation. On diagnosis, 26 patients (26/43:60.5%) in group 1 and 17 patients (17/43:39.5%) in group 2 belong to NYHA class 2.on follow up, 3 patients (3/43:6.9%)in group 1 and 17 patients (17/43:39.5%) in group 2 show reduction in NYHA functional class. 29 patients (29/86:34.9%) are with EGFR >=90ml/min. However, within group 1, 16 patients (38.1%) are having stage 3a moderate CKD (45-59ml/min). 20 patients (20/43:48.8%) patients within group 2 have normal estimated GFR.
72 patients (72/86:83.7%) had prior hospitalisation for heart failure. out of this 72 patients, 17 patients (19.8%) had >3 times of hospital admissions prior to the therapy. This includes 7 patients (7/43:16.3%) in group 1 and 10 patients (10/43:23.3%) in group 2 .
14 patients (14/86:16.3%) had episodes of aborted SCD (VT/VF).
Out of this 14 patients, 12 patients belong to group 1 (27.9%) and 2 patients belong to group 2(4.7%). Two patients within group 1 had episodes of non-sustained VT who are hemodynamic ally stable(4.7%). 13 patients (13/86:15.1%) had episodes of atrial arrhythmia which required treatment. out of this 13 patients, 10 patients belong to group 1 (23.3%). prior to the initiation of the treatment, 26 patients (26/86:40%) had QRSd >150ms .Out of this 26 patients, 21 patients(21/43:51.2%) belong to group 1. On follow up,21 patients (21/86:30%) have QRSd>150m out of which ,15 patients (15/43:38.5%) belong to group 1. 35 patients (35/86:40.7%) had LBBB , out of which 24 patients belong to group 1(55.8%) and 11 patients belong to group 2(25.6%). within group 1, 24 patients have implanted CRTD (55.8%).
Within group 1, 19 patients (19/43:44.8%) had events of appropriate ICD/ CRTD therapy. This is either in the form of anti-tachycardia pacing or ICD shock. 6 patients (6/43:14%) had events of inappropriate ICD shock.
13 patients (13/86:15.1%) have died. among this 13 patients, 7 patients (7/43:16.3%) belong to group 1 and 6 patients (6/43:14%) belong to group 2. out of these 13 patients, 6 patients had heart failure related death and all belonging to group 1(14%). Out of this 6 patients who had heart failure related death, 2 patients had AICD and 4 patients had CRTD. Out of the 13 patients who have died, 7 patients had SCD. In this 7 patients, 6 patients belong to group 2 (14%) and a single patient belong to group 1(2.3%) 14 patients (14/86:16.3%) had a history of stroke. Out of this 14 patients,9 patients (9/43:20.9%) belong to group 1 and 5 patients(5/43:11.6%) belong to group 2 . among the total 86 patients, only a single patient had a history of endocarditis.
Conclusion
There was a higher number (p=0.008) of patients with DCM who succumbed to heart failure related deaths in group 1(with AICD / CRTD). It is reasonable to assume that the patients in group 1 belonged to a much more advanced heart failure subset. There was a higher number (p=0.008) of patients with DCM who had a sudden cardiac death in group 2(without AICD/ CRTD). This is likely due to the fact that this group included only patients without implantable cardioverter defibrillators.
REFERENCES
- Craig R Narins, Mehmet K Aktas, Anita Y Chen, Scott Mcnitt, Fred S Ling (2022) et al. Arrhythmic And Mortality Outcomes Among Ischemic Versus Nonischemic Cardiomyopathy Patients Receiving Primary Icd Therapy: Jacc Clin Electrophy 8:1-11.
Indexed at, Google Scholar, Crossref
- Hadi Mahmaljy, Varun S Yelamanchili, Mayank Singhal et al. (2021) Dilated Cardiomyopathy: Statpearls Publishing, Treasure Island (Fl).
Indexed at, Google Scholar
- Kevin Willy (2020) Gerrit Frommeyer the Role of Entirely Subcutaneous Icd Systems In Patients With Dilated. Cardio J Card 75: 567-570.
Indexed at, Google Scholar, Crossref
- Marie Bayer Elming (2017) Age and Outcomes of Primary Prevention Implantable Cardioverter -Defibrillators in Patients with Non-Ischemic Systolic Heart Failure: Circulation 136:1772-1780.
Google Scholar, Crossref
- Eric C Stecker, Babak Nazer, Thomas A (2020) Dewland Primary Prevention Icds In Non Ishemic Cardiomyopathy -Time To Put Toothpaste Back In The Tube? J Am Coll Cardiol 76:416-418.
Google Scholar
- Lars Kober, Jens J Thune, Jens C Nielsen, Jens Haarbo (2016) Defibrillator Implantation In Patients With Nonischemic Systolic Heart Failure. N Engl J Med 375:1221-1230.
Indexed at, Google Scholar, Crossref
- Zecchin M, Muser D, Vitali-Serdoz L (2019) Arrhythmias in Dilated Cardiomyopathy: Diagnosis and Treatment. In: Pinamonti B 10.
Google Scholar, Crossref
- Neal K Lakdawala, Jeffery R Winterfield, Birgit H Funke (2013) Dilated Cardiomyopathy: Circulation. Arrhythmia and Electrophysiology 6: 228-237.
Google Scholar
- Kadish A (2004) Prophylactic Defibrillator Implantation in Patients with Non-Ischemic Dilated Cardiomyopathy. The New England J Med 350:2151-2158.
Indexed at, Google Scholar, Crossref
- Douglas L Mann (2021) Biykem Bozkurt Heart Failure As A Consequence Of Dilated Cardiomyopathy. In Heart Failure a Companion to Braunwald’s Heart Disease 2:372-394.
Google Scholar
Citation: Haripriya K (2022) Cardiovascular
Outcomes in Dilated Cardiomyopathy
Patients with and without Implantable
Cardioverter Defibrillator. Health Sci J. Vol. 16
No. 11: 981.
Received: 22-


