Keywords
|
Objectives
|
| • To study the neuro-cognitive aspects of three basic characteristics of sound (viz. amplitude, pitch and quality/ timbre) in human brain i.e. to study the change in brain state when we change the three parameters separately or simultaneously. |
| • To study the changes of EEG signal with the changes in different important features of music like tempo, rhythm, void, different note sequences, various types of note to note transitions etc. and correlation between those sound signals and bio-sensor signals will be studied. |
| • Studying “hysteresis” effects in different lobes of brain with a variety of acoustic stimulus conveying contrasting emotions |
| • Identification of some parameters which may help to characterize the timbre of sound. |
| • To develop a procedure to recognize different emotions using music induced EEG signals from different lobes, coupled with human response data. |
| • Application of Multifractal Detrended Fluctuation Analysis (MFDFA) technique to assess multifractal spectral width or the complexity corresponding to various cross-cultural instrumental clips. With this, we look forward to quantify arousal and valence based effects associated with each musical clip. Thus, we can have an objective assessment of universality and domain specificity associated with musical emotions. |
| • Multifractal Detrended Cross-correlation (MFDXA) analysis to identify the inter connectivity between different lobes of brain during creative thinking and composing a musical piece. |
Introduction
|
| The physics of music is as interesting as its aesthetic beauty. Music has its power to stir the emotions in the human brain. But the relation between the physical properties of an acoustic signal and its emotional impact remains an open area of research. Due to the advancement of modern technology and high speed computing, this area of research has taken a new dimension. The study of the source characteristics of musical instruments in this perspective is really challenging from the physical point of view. Research on the sound of music involves the estimation of the physical parameters that contribute to the perception of pitch, intensity levels and timbres of all sounds the voice/instrument is capable of producing [1,2]. Of these attributes, timbre poses the greatest challenge to the measurement and specification of the parameters involved in its perception, due to its inherently multidimensional nature. Research has shown that timbre consists of the spectral envelope, an amplitude envelope function, which can be attack, decay or more generally [2], the irregularity of the amplitude of the partials. Timbre is perceived by means of the interaction of a variety of static and dynamic properties of sound grouped into a complex set of auditory attributes. The identification of the contribution of each one of these competitive factors has been the main subject of this acoustics research on timbre perception. |
| Subjects (both male and female) of different age groups have been exposed to different types of Indian music, viz. Hindustani (vocal and instrumental), Drone sound, Folk music (vocal and instrumental), and Contemporary music of different genres. EEG signals were recorded while an individual undergoes a specific listening experience as well as in a normal condition without music. The type and character of music changed and the experiment will be repeated to obtain replication of the results. The data have been preprocessed and ANOVA tests were performed to determine the relation between the mental condition in the presence of music and its absence. |
| Electroencephalography (EEG) data involving the Central Nervous System (CNS) and Peripheral Nervous System (PNS) can provide plentiful information about emotion cognition. The brain is said to be the most complex structure found in the universe and the signals originating from the different lobes of brain are mostly non-linear and non-stationery. Till date, most of the studies performed in this domain [3-5] do not involve non-linear techniques, which is essential to obtain in-depth information behind the complicated waveform of EEG signal. The non-linear techniques will include three powerful microscopic mathematical methods: |
| • Wavelet analysis |
| • Detrended fluctuation analysis (DFA). |
| • Multifractal detrended fluctuation analysis (MFDFA) |
| • Multifractal cross correlation analysis (MFDXA) |
| All these techniques make use of Fractal Dimension (FD) or multifractal spectral width (obtained as an output of the MFDFA technique) as an important parameter with which the emotional arousal corresponding to a certain cognitive task (in this case a particular music clip) can be quantified. Moreover, MFDXA can prove to be an important tool with which the degree of cross correlation between two non-linear EEG signals originating from different lobes of brain can be accurately measured during higher order cognitive tasks. With this, we propose to have a quantitative assessment of how the different lobes are cross-correlated during higher order thinking tasks or during the perception of audio or any other stimuli. MFDXA can also prove to be an amazing tool in music signal analysis, where we can estimate the degree of crosscorrelation between two non-linear self-similar musical clips. A higher degree of cross-correlation would imply that both the signals are very much similar in certain aspects. This in turn can be used as an important tool to obtain a cue for improvisation in musical performances as well as in the identification of presence of Ragas in songs. |
| EEG signals analyzed in this new technique with appreciable statistics and appropriate protocol is expected to provide important new data in the area of neuro-cognitive differentiation of emotion and also indicate prominent change in brain state on application of different music signals related to different emotions. |
| This new techniques might throw new light into how rhythm, pitch, loudness etc. interrelate to influence our appreciation of the emotional content of music. The brainelectrical response of the subject will also be analyzed with global descriptors, a way to monitor the course of activation in the time domain in a three-dimensional state space, revealing patterns of global dynamical states of the brain. Another aspect of this research work includes exploration of the resonance characteristics and the amplitude envelope of the musical signals because they play important roles in sound production. The spectral envelope will also be studied in this context to evaluate the attack, decay and steady state timings and the formants/resonant frequencies too. Correlations of the above features and their interdependence will be studied and compared too. |
| An attempt is being made to compare the data with available models of emotion, which include the most popular circumplex model, which is a 2-dimensional arousal-valence model and also the newly proposed 3-dimensional model, based on Hilbert spaces proposed by Ghose [6]. Hilbert spaces are complex linear vector spaces in which length and angle can be defined. They have a rich structure that allows ‘coherence’ resulting, for example, in interference effects as well as ‘entanglement’ which, until recently, was considered a quintessential quantum phenomena. Coherence means that two states, say with different values of some observable (like happiness and unhappiness), can be linearly superposed to obtain a new state which is neither happiness nor unhappiness. Such states are ‘ambiguous states’ which cannot be described by Boolean logic. |
Case Report of Our Work
|
| Our work is divided into two main aspects: one being the assessment of neuro-cognitive aspects of musical stimuli, while the other aspect focused on the search of a variety of techniques to assess the inherent complexity and selfsimilarity of music signals. In the following paragraphs of this report, we would elaborate on the different facets of this colossal subject which we have ventured to study in the aforementioned period. Firstly, a few studies based on the neuro-cognitive assessment of human emotions using musical stimuli: |
| Brain electrical correlates of tanpura drone to identify global descriptors |
| The Tanpura is a remarkable drone instrument whose sounding acts as a canvas in Indian Raga Music and provides contrast to the tune and melody without introducing rhythmic content of its own. What are the psycho-acoustically effective ingredients in Tanpura drone that make it almost ubiquitous in accompaniment for Indian music? |
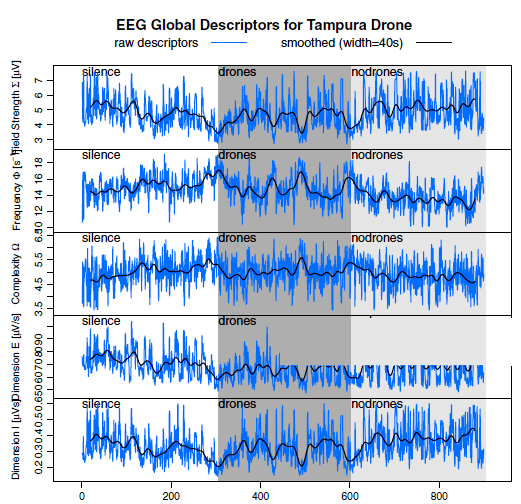
| The question of reference for baseline EEG in the resting condition where the subject has no task to perform is addressed. We hypothesize that drone sounds are sufficiently neutral to the subject in that they are not popping into the fore of cognition, evoking reactions to the stimulus. This assumption is needed in order to define the resting condition where the subject has no task to perform (no-task resting frame). Drone can provide contrast but is not prompting a response. In a laboratory setting spontaneous brain electrical activity in the form of EEG response were observed during Tanpura drone stimulation and periods of silence. The sound stimulus was given by an electronic substitute Tanpura (EST) that allows controlling of its parameters. The timbral characteristics of the drone samples are given. The brainelectrical response of the subject is analyzed [7] with global descriptors, a way to monitor the course of activation in the time domain in a three-dimensional state space, revealing patterns of global dynamical states of the brain (Figure 1). Timbral characteristics such as tristimulus T1, T2, and T3, and the odd and even parameters have been chosen in view of the energy distribution in partials, whereas spectral brightness, irregularity and inharmonicity are descriptive of the harmonic content. |
| The EEG signals from 19 electrodes have been averaged in windows of 1 s width. With overlap of 50% the time resolution is 0.5 seconds. After removal of outliers the time series for the three global descriptors are displayed including the derived dimensions E and I (Figure 2a). The first eye-catching features are the undulations during drone that show 3–4 drops of field strength (activity), which correlates with an increase in frequency and complexity. These undulations have a width of roughly 30 s (which is very slow). The simultaneous increase in Omega complexity can be interpreted as emergence of new cognitive modules (either by insertion or decay). Reduced activity is an indication that available energy is shared by more processes. |
Hysteresis in Brain?
|
| Human brain is the most complex organ found in the Universe, and one of the most important discoveries of the 21st century is that the human brain is organized by Chaos [8]. The working of the brain involves billions of interacting physiological and chemical processes that give rise to experimentally observed neuro-electrical activity, which is called an electroencephalogram (EEG). Music can be regarded as input to the brain system which influences the human mentality along with time. Since music cognition has many emotional aspects, it is expected that EEG recorded during music listening may reflect the electrical activities of brain regions related to those emotional aspects. The results might reflect the level of consciousness and the brain's activated area during music listening. It is anticipated that this approach will provide a new perspective on cognitive musicology. The non-linear, non-stationery EEG time series signals recorded from different regions of the scalp is high on temporal resolution and can be best analyzed with the help of various robust nonlinear techniques such as Detrended fluctuation Analysis (DFA) technique proposed by Peng et al. [9]. |
| In stochastic processes, chaos theory and time series analysis, DFA is a method for determining the statistical selfaffinity of a signal. It is useful for analyzing time series that appear to be long-memory processes (diverging correlation time, e.g. power-law decaying autocorrelation function) or 1/f noise. The obtained exponent is similar to the Hurst exponent, except that DFA may also be applied to signals whose underlying statistics (such as mean and variance) or dynamics are non-stationary (changing with time). In case of music induced emotions, DFA was applied to analyze the scaling pattern of EEG signals in emotional music in a few reported studies. The advantage of using this model is that we can define arousal and valence levels of emotions with the calculated FD values. In this paper, we wanted to test whether hysteresis-like effects are present in brain response to emotional musical stimuli using the DFA technique to assess the arousal corresponding to different frequency bands separated from the raw EEG signal. |
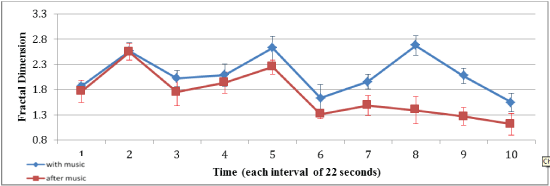
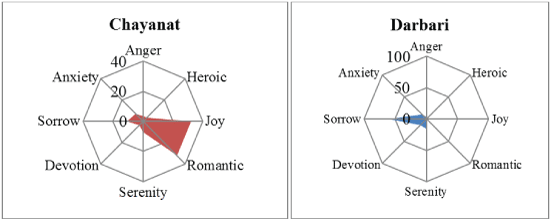
| To test our prediction, we used a protocol which reveals the time duration for which the neuronal activation persists even after the removal of the musical stimuli. Whether the hysteresis effect is present in the case of neurons triggered by musical stimuli has not yet received the attention of cognitive neuroscientists. Hysteresis is usually investigated using designs comprising of “ascending" and "descending" sequences, that is, sequences ordered in terms of a certain physical parameter. In this case we used a positive emotional clip as an ascending sequence while another clip conveying negative emotion consisted of the descending one. We used two ragas of Hindustani music “Chayanat’ (joy/romantic) and “Darbari Kanada” (sad/pathos) for this purpose which are conventionally known to evoke these emotions. In the middle, “no music” or rest conditions comprised of the neutral states which we considered as the baseline or the threshold value. The analysis confirmed the enhancement of arousal based activities during listening to music in both the subjects. Fractal dimension (DFA) analysis of the alpha frequency rhythm, which is the manifestation of complexity in the neuronal activity show that arousal activities were enhanced for some time (~120 seconds for Chayanat raga while ~77 seconds in case of Darbari raga) in both the left and right frontal lobes corresponding to happy and sad music respectively [10]. Thus, even when the music stimuli were removed, significant alpha brain rhythms persisted, showing residual arousal activities analogous to the conventional ‘Hysteresis loop’ where the system retains some ‘memory’ of the former state. Figures 2a and 2b gives a graphical demonstration of the ‘retention’ of musical memory corresponding to alpha frequency rhythms in the two frontal electrodes chosen for our study [10]. |
| An extension of this study was carried out using another set of raga clips which were initially standardized on the basis of a listening test to be falling on the same emotional sphere as these two [6]. The emotional sphere has been shown in Figure 3a and 3b [11]. The experiment was repeated for the same group of 10 participants and the scaling pattern in alpha and delta frequency rhythms were analyzed with DFA technique for a set of five frontal electrodes (namely F3, F4, F7, F8 and Fz). It was found that the scaling patterns for delta and alpha range are significantly different for both the clips conveying contrast emotions. This study could be a precursor for human emotion identification using music signals and in a broader sense could lead to effective use of cognitive music therapy. |
| Multifractal analysis of EEG signals using acoustic inputs |
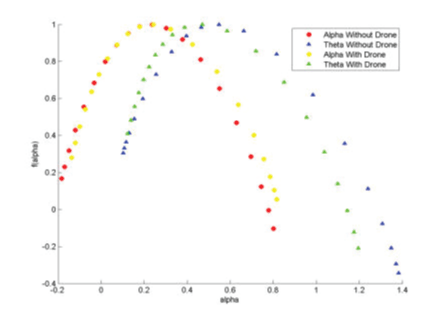
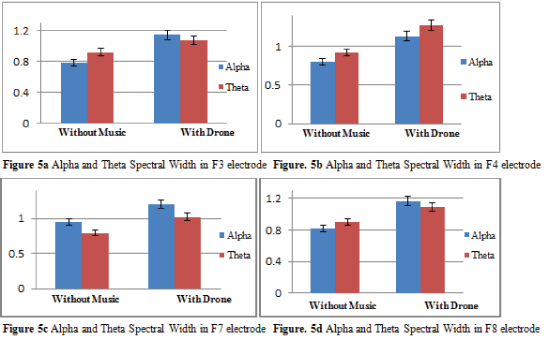
| The multifractals are fundamentally more complex and inhomogeneous than monofractals and describe time series featured by very irregular dynamics, with sudden and intense bursts of high-frequency fluctuations. Multifractal Detrended Fluctuation Analysis (MFDFA) technique first proposed by Kantelhardt et al., [12] has been widely applied in various fields ranging from stock market to biomedical fields for prognosis of diseases. It is well known that EEG signals are multifractals as they consist of segments with large variations as well as segments with very small variations. The EEG data was extracted for all the frontal electrodes viz. F3, F4, F7, F8, Fp1, Fp2 and Fz. Empirical Mode Decomposition (EMD) was applied on the acquired raw EEG signal to make it free from blink as well as other muscular artifacts. Wavelet Transform (WT) technique was used to segregate alpha and theta waves from the denoised EEG signal. Nonlinear analysis in the form of Multifractal Detrended Fluctuation Analysis (MFDFA) was carried out on the extracted alpha and theta time series data to study the variation of their complexity. It was found that in all the frontal electrodes alpha as well as theta complexity increases as is evident from the increase of multifractal spectral width [8]. This study is entirely new and gives interesting data regarding neural activation of the alpha and theta brain rhythms while listening to simple acoustical stimuli. The importance of this study lies in the context of emotion quantification using multifractal spectral width as a parameter as well as in the field of cognitive music therapy. Figure 4 shows the variation of multifractal spectral width for a reference electrode F3 under the effect of tanpura drone, while Figure 5a-5d demonstrates the cumulative effect for 10 persons in different frontal electrodes. |
| Another study in using MFDFA technique [14] aseesses the same set of two raga clips used in the previous study to assess the change in multifractal spectral width when subjects are exposed to the clips. Here, specific response was obtained in the odd-even electrodes which points in the direction of domain specificity in emotional response. |
| Can musical stimuli produce visual imagery? a multifractal crosscorrelation study |
| What happens inside the performer’s brain when he is performing and composing a particular musical piece? Are there some specific regions in brain which are activated when an artist is creating or imaging a musical piece in his brain? Do the regions remain the same when the artist is listening to the same piece sung by him? These are the questions that perplexed neuroscientists for a long time. The endeavor to obtain insights to brain processes that take place during listening as well as composing music has been attempted several times by musicologists and psychologists. An EEG experiment was conducted for two eminent performers of Indian classical music, when they mentally created the imagery of a raga Jay Jayanti in their mind, as well as when they listened to the same raga. MFDFA and MFDXA techniques were used to quantitatively assess the arousal based response of EEG data in different electrodes from frontal, occipital and temporal lobes. We analyzed EEG signals appearing from two different groups of electrodes appearing in three different lobes of the brain. A method named detrended crosscorrelation analysis (DXA) allows investigating the long-range cross-correlations between two nonstationary time series, which is a generalization of the DFA method. Here we use a technique called Multifractal Detrended Cross correlation Analysis (MFDXA) [15], a generalization of the DXA method which can unveil the multifractal features of two crosscorrelated signals and higher-dimensional multifractal measures. The two nonlinear signals from the two different groups of electrodes are analyzed with the help of MFDXA technique and the resultant cross correlation exponent gives the degree or the amount by which the two signals are correlated. Multifractal Detrended Cross correlation Analysis (MFDXA), can unveil the multifractal features of two crosscorrelated signals and higher-dimensional multifractal measures. This technique gives the degree of cross correlation γx between two non-linear, non-stationary signals. For uncorrelated data, the cross correlation coefficient, γx has a value 1 lower the value of γx, more correlated is the data. Thus a negative value of γx signifies that the two music signals have very high degree of correlation between them. With the help of this technique, we intend to identify certain regions in the brain which are most correlated when an artist thinks of raga, while certain others which are most correlated when the artist listens to that particular raga. When a musician is listening and also thinking of a certain raga, the role of musical expectancy as well as the memory of the just listened phrases and the possible connection to this with immediately following expected musical events may be higher. This may lead to strong correlations in the specific lobes where the processing takes place. What we look forward to in this work is to conjure a general paradigm where the brain areas associated with musical creativity and perception can be conclusively identified. |
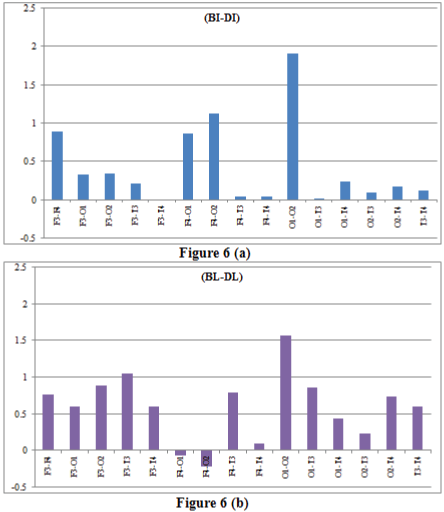
| The strong cross-correlation between the occipital electrodes both during imagination and perception of the musical piece indicates the creation of a visual imagery of that particular musical piece in the performer’s brain [16,17]. That the two occipital electrodes are strongly correlated during the listening part also is an important revelation of this study (Figure 6a and 6b), and strengthens the claim of creation of visual imagery of a particular raga by the musicians. The strong cross-correlation between the frontal and fronto-temporal electrodes might be evidences of involvement of higher order cognitive thinking and auditory skills involved in the processing of musical stimuli. Interestingly, the cross-correlation between the electrodes decreases to a great extent after the removal of stimuli, pointing to enhancement of neural activity during creative imagery of a musical composition. Also, the combination of electrodes for which rise is significant, the fall after removal of stimuli is also significant, indicating that in the absence of any creative task diminishes the cross correlation between different lobes of the brain. Some of the features of this interdependence between inter as well intra lobes of brain during mentally creating as well as perceiving a musical composition, obtained from the degree of cross correlation are revealed for the first time from our new data. Thus, with this we have tried to obtain a quantitative definition of creativity, which till now was considered more of a philosophical term rather than a scientific one. The increase or decrease of the degree of cross-correlation between the different lobes of brain during a variety of cognitive tasks can now be related to creativity involved in each of the tasks. The obtained data thus, may be of immense importance when it comes to studying the neuro-cognitive basis of creativity and alertness to a certain cognitive function. |
| The next part of our work focuses on the use of conventional linear as well as robust nonlinear techniques to assess the inherent complexity and self-similarity of music signals. |
| Study of objective cues for improvisation in hindustani music |
| Hindustani music (HM) has ample liberty to perform and because of its contemplative, spiritual nature HM is a solitary pursuit that focuses mainly on melodic development. It completely depends on the artist’s own imagination, creativity, knowledge of raga and of course on the mood of artist on that particular moment of rendition. It is the notion of the artist to improvise his every rendition. In this work this has been analyzed and judged objectively. |
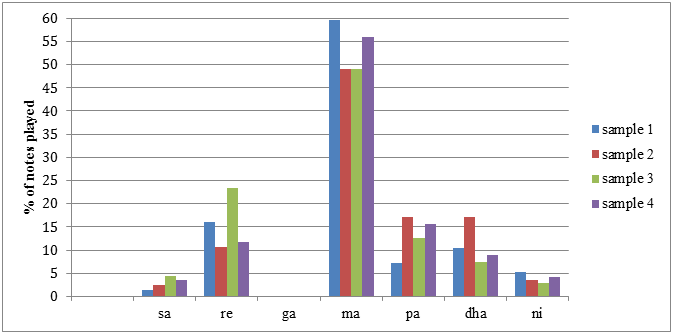
| There is no notation system like western music and the musician is himself the composer. A musician while performing expresses the raga according to his mood and environment surrounding him. Thus there are differences from one rendition to another. Even if an artist sing or play same Raga and same Bandish twice then there should be some dissimilarity in between two performances. These differences in the rendition of a raga several times on different days are generally called improvisation. A meticulous listener of Hindustani music can identify the raga rendered during two/ more performances and can also tell that they are not the same performance. So there must be some acoustic cue in the raga signal rendered. These cues might be in the creativity and artistry of the musician and expressed in his performance. Our goal is to establish the acoustic cues that might be in the creativity and artistry of the musician and expressed in his performance. We took four signals of four different renditions of a raga [18] of an eminent vocal maestro of HM. The most important acoustic cues as observed by us might be the duration and number of pause between notes, duration of notes, usage of notes between pause and phrasal patterns. Ratio of pause and non-pause duration reflects the tempo of the rendering and an important cue of improvisation. The sliding pattern between notes changes among different renderings and might also act an important cue. Figure 7 shows the % use of notes by the artist in his four raga renderings is self-explanatory. It clearly indicates that no definite rule is there in using notes for the raga in Hindustani music (HM). Artist improvised his performance in every raga. |
Essence of Raga in Bollywood Music
|
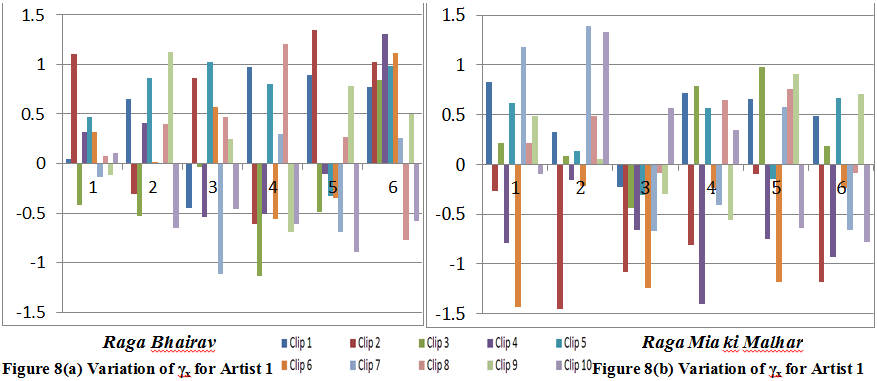
| Since the start of Indian cinema, a number of films have been made where a particular song is based on a certain raga. In this work, we look to explore what are the particular features of a certain raga which make it understandable to common people and enrich the song to a great extent. For this, we chose two common ragas of Hindustani classical music, namely “Bhairav” and “Mian ki Malhar” which are known to have widespread application in popular film music. 10 widely popular songs of Bollywood films were selected for analysis. With the MFDXA technique, all parts of the Film music and the renderings from the eminent maestros are analyzed to find out a cross correlation coefficient (γx) which gives the degree of correlation between these two signals. We hypothesize that the parts which have the highest degree of cross correlation are the parts in which that particular raga is established in the song. Also the variation of cross correlation coefficient in the different parts of the two samples gives a measure of the modulation that is executed by the singer. Thus, in nutshell we try to study scientifically the amount of correlation that exists between the raga and the same raga being utilized in Film music. The following conclusions can be drawn from the study [19] done: |
| • We make use of a robust nonlinear technique MFDXA to quantify the degree of cross correlation between a raga clip and a popular Bollywood song. From the cross correlation coefficient, we get a cue for the presence of a particular raga in that song. |
| • The cross correlation coefficient also gives us a clue about a number of different ragas merged together in a certain song which is difficult to be identified by only auditory perception. |
| We have defined a baseline value (found here to be 0.8), beyond which any song will fall in the category of a particular raga. Below the stipulated value, the song will have the flavor of more than one raga. This study will help in generating an automated algorithm through which a naïve listener will relish the flavor of a particular raga in a popular film song. Figure 8a and 8b shows the two the variation of cross-correlation coefficient for the two ragas chosen for our analysis. |
| Categorization of tablas by Wavelet Analysis |
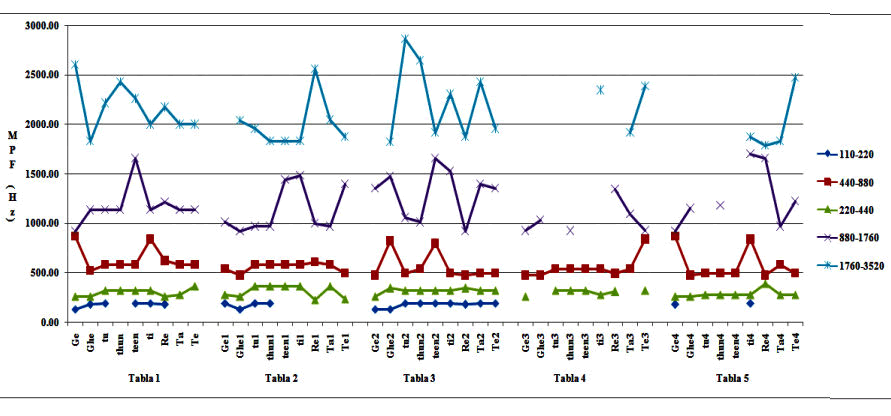
| Tabla, a percussion instrument, mainly used to accompany vocalists, instrumentalists and dancers in every style of music from classical to light in India, mainly used for keeping rhythm. This percussion instrument consists of two drums played by two hands, structurally different and produces different harmonic sounds. Earlier work has done labeling tabla strokes from real time performances by testing neural networks and tree based classification methods. The current work extends previous work by C. V. Raman and S. Kumar in 1920 on spectrum modeling of tabla strokes [20,21]. In this work, we have studied spectral characteristics (by wavelet analysis by sub band coding method and using torrence wavelet tool) of nine strokes from each of five tablas using Wavelet transform. |
| Figure 9 reveals that the Most Prominent Frequency (MPF) corresponds to the highest peak of each sub-band, is uniform during the lower frequencies up to 900Hz, but largely varies in high frequency bands. So at low frequency, all tabla sounds similar. Maximum harmonic information lies in the range 0.9-2.5 kHz. Although Tee and Teen, Ghe and Ge are similar strokes, a larger difference in MPF occurs for all the first three tablas. Such difference is due to the damping effect among the pair of strokes and is visible in 440 to 1760 Hz. But 4th and 5th tablas give no information during these ranges. Such differences give rise to the fact that the production of harmonics is different for all tablas due to difference in their structure i.e. the resonant chamber. |
| Emotion induced by hindustani music– a crosscultural human response study |
| Indian raga is said to be emotion specific. Studies of emotion in western music report emotion to be primarily associated with timbre and rhythm. The present study uses short segments of vocal raga music for the study of emotional content thus minimizing the role of both timbre and rhythm. Listening tests using 48 raga clips, of 30 seconds each, randomly extracted from 15 ragas uses responses of 103 naïve listeners. The study also includes examination of cross–cultural differences between 3 contrasting groups’ namely rural/urban, science/humanities background and male/female. The results certify that the elicited emotion from different segments from the same raga has strong specificity. Another interesting finding is that the elicited emotional responses from the segments of a raga rarely correspond to those given in different treatises while having strong cross-cultural similarity in the various categories chosen [22]. For the study of crosscultural similarity the listeners were divided into appropriate categories, response frequencies for each emotion for each clip are then pooled in these three categories. The value of the Pearson Correlation coefficient ‘r’ is calculated for the competing categories for each clip. These are grouped into grades using Table 1. |
A Hilbert Space Theory of Emotions
|
| Human emotions are psycho-physiological experiences that affect all aspects of our daily lives. Emotions are complex processes comprised of numerous components, including feelings, bodily changes, cognitive reactions, behavior, and thoughts. Various models have been proposed by considering the ways in which these components interact to give rise to emotions, but at the moment there is no single formulation that is universally acceptable. Modeling emotions is a very challenging problem that has drawn a great deal of interest from the emerging field of human-computer interaction. A fundamental theory of emotions based on Ekman’s classic work [23] has been proposed here [6], in which all possible emotions are represented as points (or areas) on a unit sphere, analogous to the Poincare sphere in classical polarization optics on the basis of 2-dimensional Hilbert space. This would then automatically incorporate the transformations required to take one emotional state to another in more than one way. |
| The human brain is a very complex entity in which coherence and oscillations have been empirically observed in the cerebral cortex [24,25], and such oscillations have been linked to cognitive states, such as awareness and consciousness [26,27]. Aerts et al. [28] have claimed that there is also evidence of entanglement in the mind. In this context it would be worthwhile to explore what a Hilbert space structure of the mind would imply for basic emotions as defined by Ekman [23]. |
| Although the well-established basic emotions, characterized by universal facial expressions in all cultures, come in two pairs of opposites (say Happiness-Sadness, Anxiety-Calmness), according to Ekman, all emotions are equally basic. A fundamental theory of emotions must therefore have a mathematical structure that correctly and completely captures all these possible emotions. A 2-dimensional complex Hilbert space is the simplest and a natural choice for the basis of such a theory. Ghose [6] proposes that all emotions lie on the surface of a unit sphere in this space. This is analogous to classical polarization optics where the Poincaré sphere is the most elegant and complete representation of polarization states [29]. Every point of the sphere uniquely represents a polarization state of light. Points on the equator of the sphere represent different plane polarization states, the north and south poles of the sphere represent right and left circular polarizations respectively, and the points above and below the equator represent various elliptical polarization states. The circular and elliptical polarization states are linear combinations of two fundamental plane polarization states, usually called the horizontal and vertical, with complex coefficients. This is why the theory requires a Hilbert space and not a Euclidean space which admits only real coefficients. |
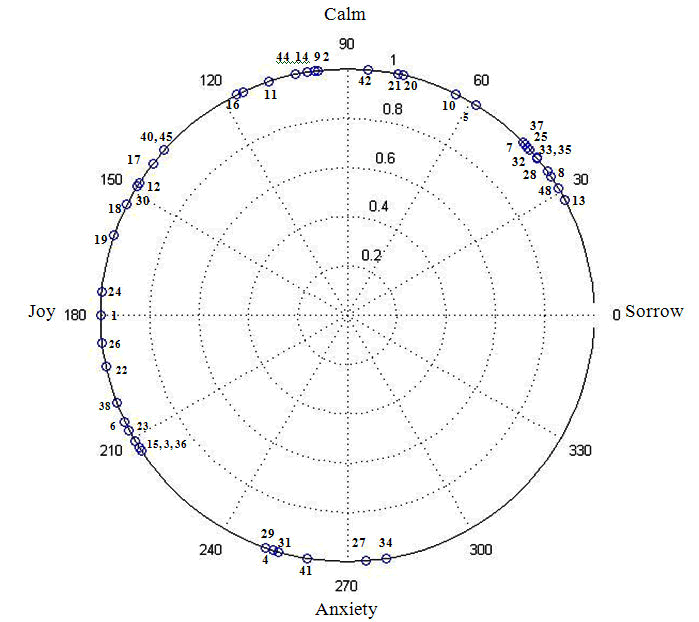
| An analogous unit circle can be constructed for human emotional states. The infinitely many points on the surface of the circle would completely specify all possible emotional states, and the symmetry of the surface would ensure their equivalence. It would also automatically specify the transformations required to take one emotional state to another in more than one way, which should be of considerable heuristic and therapeutic value. The reason behind choosing a unit sphere is to normalize arousal, i.e. scale all arousals to a common value, arbitrarily chosen to be unity. The emotional circular plot obtained from the human response data is given in Figure 10. |
| Each of the point in the circular plot represents the emotional arousal corresponding to a chosen clip (the clip numbers are shown against each and every point in the plot). Within the sample size of the chosen musical clips, we chose a basis of two axes–the X axis denotes Happiness and Sadness, while the Y axis denotes Anxiety and Calmness. This set of bases is not unique and can be arbitrarily varied (rotated)–a basic postulate of Hilbert space theory. However, the data (lengths of the vectors) remain the same under such rotationsonly their components change. The fundamental predictions of the theory are the occurrence of (1) interference effects between neighbouring and overlapping states, (2) contextuality, i.e. the dependence of emotional states on the context of listening, and (3) entanglement. Noncontextuality is the conventional classical notion that a physical property of a system cannot depend on the context in which it is measured or observed. It has always been a tenet of classical physical science that whatever exists in the objective world is independent of our observations which only serve to reveal them to us. Put more technically, what this means is that the result of a measurement is (i) predetermined and is (ii) not affected by how or in what context the value is measured. To put this hypothesis to test and study contextuality in the human brain, we propose in future to shuffle the order in which the clips are played to the listeners randomly in order to find out whether the order changes the ambiguous states produced We also want to create a transformation matrix which will transform a given ambiguous state to another. This technique will have considerable therapeutic value, because, if successful, it will help transform the emotional state of a patient to a desired one. As with all scientific methods, this technique has the danger of being misused. Entanglement will be a more difficult thing to formulate and test. |
Conclusion and Future Work
|
| In conclusion, we want to emphasize that the wide of spectra of this multi-faceted subject covered in this report is entirely new even in the global perspective when it comes to the neuro-cognitive physics based study of music and its effect on human brain. All these studies taken together will help in better understanding of the intimate relationship between music and the emotional experience and its neuro-cognitive significance which in turn can guide to use proper music as an effective therapeutic agent. Application of derived knowledge from the work in different physiological counseling centers, chronic physiological ailing persons and in school education. |
Tables at a glance
|
 |
| Table 1 |
|
Figures at a glance
|
 |
 |
 |
 |
| Figure 1 |
Figure 2a |
Figure 2b |
Figure 3 |
 |
 |
 |
 |
| Figure 4 |
Figure 5 |
Figure 6 |
Figure 7 |
 |
 |
 |
| Figure 8 |
Figure 9 |
Figure 10 |
|
| |
|
|
