Keywords
Kimyasal kompozisyon, Kolesterol, Yag asitleri profili, Yag, Deniz Baligi
Introduction
As compared to other food products, fish is an important constituent in the human diet that has been linked for several decades to health benefits. From a nutritional point of view, fish is considered a precious food item for its easy digestibility, high mineral, vitamin and protein content. Besides high quality protein, many marine fish species are known to have low levels of linoleic acid (C18:2n6) and linolenic acid (C18:3n3) and to be excellent dietary sources of polyunsaturated fatty acids (PUFAs), especially the long chain n-3 PUFAs eicosapentaenoic acid (EPA; C20:5n3) and docosahexaenoic acid (DHA; C22:6n3). EPA and DHA are essential constituents of human diets and are found in considerable amounts in fatty fish species like mackerel (Scomber colias), sardines (Clupea pilchardus), Atlantic salmon (Salmo salar), Albacore tuna (Orcynus albacora) and scabbard fish (Aphanopus carbo) (Leaf and Weber, 1988). In the last few decades, these long chain polyunsaturated fatty acids have gained attention because of the potential prevention of human coronary artery disease, improvement of retina and brain development (Crawford, 1993), and also decreased incidence of breast cancer, rheumatoid arthiritis, multiple sclerosis, psoriasis and inflammation (Kinsella, 1988).
Based on the importance of fish as part of a healthy diet, an outstanding promotion of fish and seafood consumption as a predominant source of n-3 PUFAs has been published. As a consequence, in the last few years, fish demand has generally increased and contextually, a cultural change has been taking place in the food sector at both production and distribution levels. Today’s society consumers seem to be strongly conditioned by the search for quality but also, there has been an overall rise in the degree to which consumer choice is dictated by consideration of health benefits, food safety, environmental and animal welfare concerns. In the choice of different food items, the contribution of fundamental elements, such as proteins and lipids, tends to represent almost a common point of reference in the daily diet, because they are the best for growth and maintenance of the human organism (Reale et al., 2006). However, in spite of the general acceptance of seafood high nutritional value, there is limited information available on the chemical and nutritional value of marine species. Moreover, there is a remarkable difference in the chemical composition (including fatty acids, cholesterol and minerals) between and within fish species, which depends on several factors including the region and the season of fishery; the sex and the age of the fish; stage of maturity, individual variability and the food available to the fish (Özogul, et al., 2009). Moreover, the content of some fatty acids which varies within defined ranges, depends both on the species and the nature of the tissues under study (Rueda, et al., 1997). The relative importance of the lipid deposition sites varies markedly among fish species, and includes liver, perivisceral adipose tissue or the muscle, which is the only truly edible part. Liver and other visceral organs are taken out and discarded during the dressing of fish and this could mean the loss of important biochemical compounds of vital importance to the animal feed industry.
The primary focus of this research was to investigate the proximate composition, cholesterol content and fatty acid profile of fourteen marine species captured in Northeastern Atlantic. The selected species used in this study represent approximately 56% of the commercialized species in Portugal and all have high relevancy for the fisheries economy of the country and for Mediterranean human diet.
Materials and Methods
Sampling
Fourteen commercially important fish species were chosen and collected for determination of proximate composition. These were: black scabbard (Aphanopus carbo), lesser amberjack (Seriola fasciata), fork-beard (Phycis phycis), red scorpion fish (Scorpaena scrofa), white sea bream (Diplodus sargus), offshore rockfish (Pontinus kuhlii), bluefish (Pomatomus saltatrix), black tail comber (Serranus atricauda), pink dentex (Dentex gibbosus), red porgy (Pagrus pagrus), blue jack mackerel (Trachurus picturatus), Atlantic chub mackerel (Scomber colias), white trevally (Pseudocaranx dentex) and gilthead sea bream (Scorpaena scrofa). Gilthead sea bream was included in this study, as to investigate any possible differences between wild and cultured fish. Fish were 1 or 2 days post-captured on arrival at the laboratory and were maintained in ice during this period. Samples of each fish were weighted, gutted and filleted for determination of chemical composition. Livers of all fish were also collected for fatty acid and cholesterol determination. Prior to sample treatment, residual moisture was determined (Gibertini-Eurotherm dry weight balance) to correct to dry material (dm). The muscle tissue (edible muscle) and the livers material were freeze-dried (Savant freeze dry), milled, homogenized and stored in cold until analysis were made. Each muscle sample was analysed for moisture, ash, protein, cholesterol, lipid content and fatty acid profile.
Muscle chemical composition
The moisture (method 934.01) and ash content (method 942.05) were determined according to AOAC official methods (1990) and protein content was determined by the Kjeldahl method in a Kjeldahl Selecta Alcodest still equipment, using the nitrogen x 6.25 conversion factor. For the determination of total lipids, the milled samples were extracted with a mixture of chloroform-methanol (1:2; v/v), according to Bligh and Dyer (1959) method. The results were expressed as weight percent in the wet tissue, as a mean values ± standard deviation.
Cholesterol analysis
The extraction and quantification of cholesterol was based on the experimental procedure of Naemmi et al. (1995) as modified by Oehlenschläger (2000). The cholesterol was determined in a Agilent HP 6890 gas chromatograph equipped with a flame ionisation detector. The separation was carried out with helium as carrier gas in an HP-5 column (30 m of length, 0.32 mm i.d. and 0.25 μm film thickness). The column temperature was programmed to start at 100 ºC for 2 min and heating 15 ºC min-1 until 280 ºC. The injection and detector were maintained at 285 ºC and 300ºC, respectively. Cholesterol was identified by comparing the relative retention times of peaks from samples with the standard. The quantification was made using the 5-α-Cholestane (Sigma) as internal standard and the results are expressed as mg per g of dry material, as a mean values ± standard deviation.
Transesterification and fatty acids analyses
Methyl esters fatty acids (FAMEs) were prepared according to the Lepage & Roy (1996) method, modified by Cohen et al. (1988). The FAMEs quantitative analyses were performed in a gas chromatograph (Agilent HP 6890) equipped with a flame ionisation detector and a mass selective detector (5973 Agilent). The separation was performed in a polyethylene glycol capillary column (Supercolwax-Supelco) with 30 m of length, 0.25 mm i.d. and 0.25 μm film thickness. The column is subjected to a temperature program starting at 140 ºC for 5 min, heating 4 ºC min-1 at 240 ºC, giving clear and good separation between the FAMEs. Samples fatty acids were identified by comparing the retention time of FAMEs with retention times of standard FAMEs mixtures and by comparison of their mass spectra with the equipment mass spectral library or their fragmentation profiles with published data. The results were calculated using the Agilent G1701DA ChemStation program and are expressed as mg per g of dry material or weight percent of the total fatty acids, as a mean values ± standard deviation.
Chemicals
All reagents and standards were of 99.9% purity and choromatographic grade (Merck, Sigma-Aldrich or Fluka). The FAMEs standards used for fatty acids identification was the Supelco 37 components FAME Mix.
Statistical analysis
The obtained resulting data were presented as mean ± standard deviation (SD) of three separated determinations. The data were subjected to one-way analysis of variance (ANOVA) and if significant differences were found (p<0.05), Duncan’s multiple range test was used to rank the groups based on the chemical composition and in main fatty acids among the different species. Statistics was done using SPSS 14.0 (2006) software package (SPSS; Chicago, IL). Within chemical composition, the different species were grouped or classified using hierarchical cluster analysis based on their similarities yielded in the data. Cluster analysis was displayed using average linkage between groups. The linkage in a dendrogram shows the order of similarity designated as Squared Euclidean distance. Correlation between cholesterol and fat content was determined using Pearson correlation coefficient (two-tailed).
Results and Discussion
Chemical composition of muscle samples of the target species is presented in Table 1. According to Murray & Burt (2001), the muscle of finfish contains 18 to 22 g of protein per 100 g of edible portion, which is consistent with the results found in this study. Protein content ranged from 18.5% in fork-beard to 32.7% in white sea bream. The last, together with gilthead sea bream, was significantly different from the remaining species (p<0.05). Except for the above mentioned species, the observed variability in protein content among studied fish was not significant and could be explained by differences in feeding habits, age and sex of the fish or fat and water contents of the flesh.
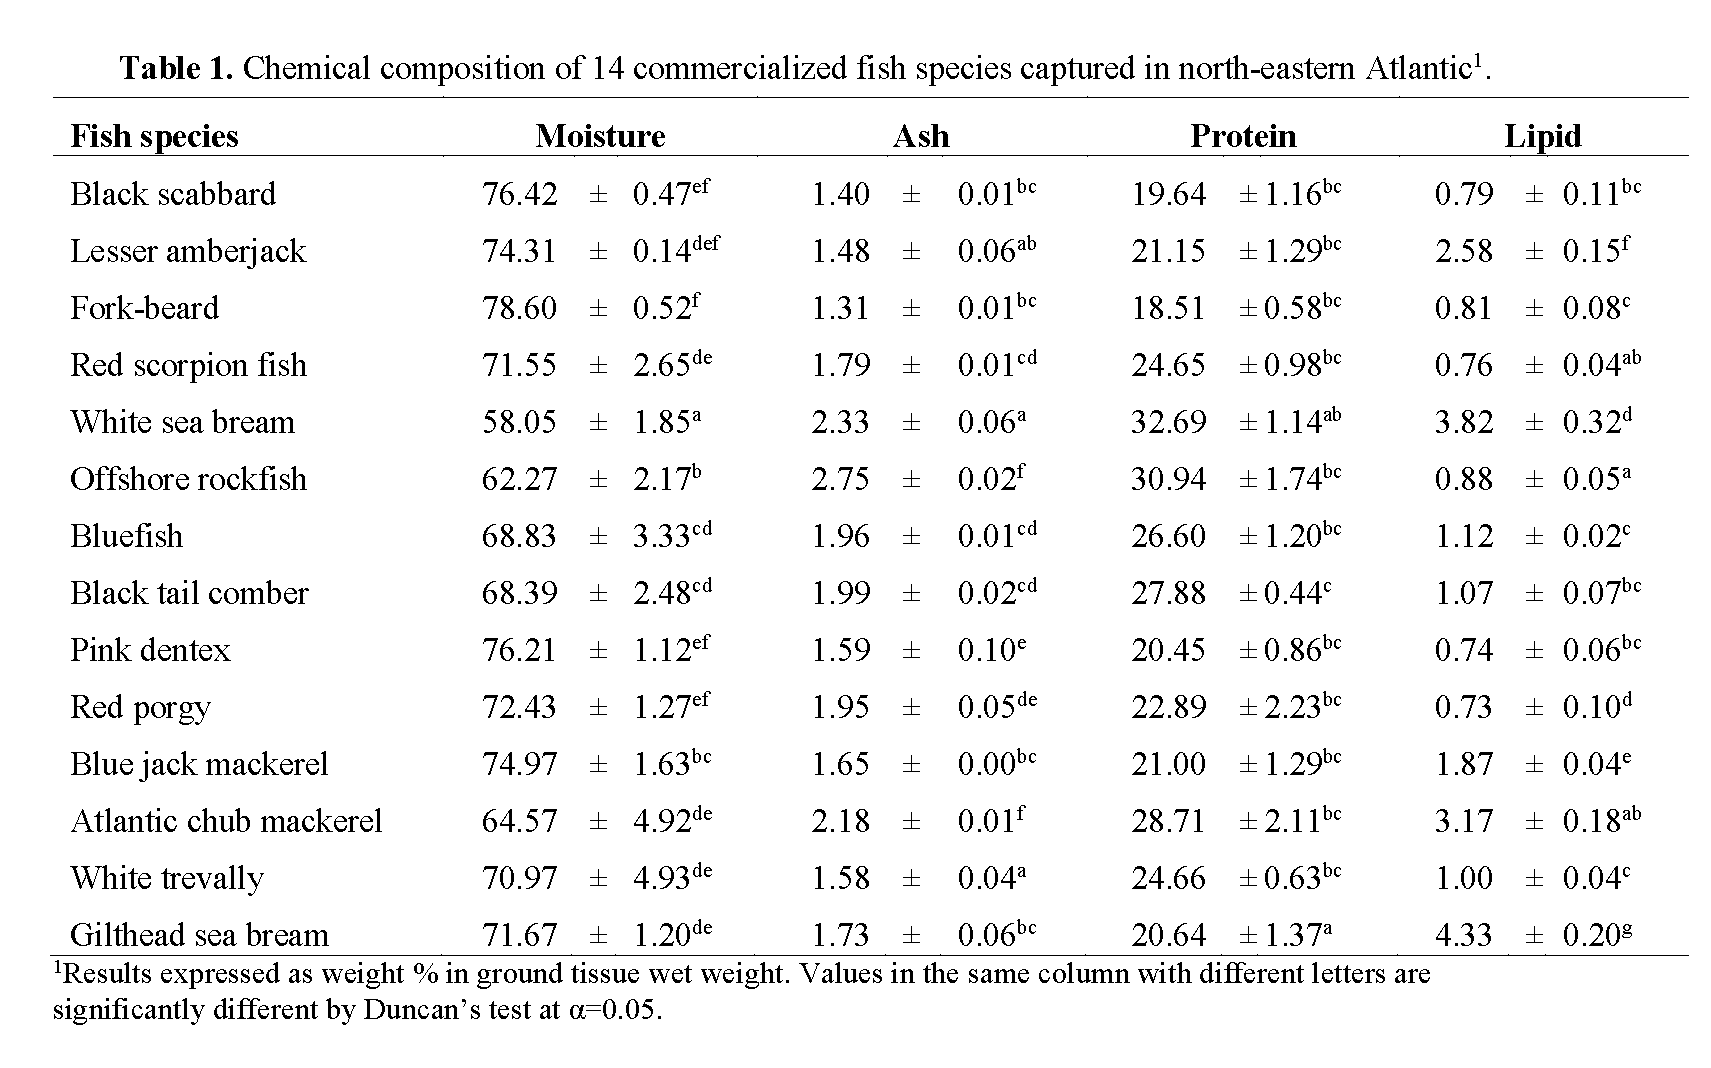
Table 1: Chemical composition of 14 commercialized fish species captured in north-eastern Atlantic1.
Highest lipid content was found in gilthead sea bream (4.3%) followed by white sea bream (3.8%), whereas red porgy and pink dentex presented the lowest lipid content (c.a. 0.7%) (Table 1). Red porgy results are consistent with the results found by Rueda et al. (1997) for the same species (0.65%). The higher lipid content in gilthead sea bream may be explained by the fact that specimen of this species were obtained from fish farms, meaning that fish were fed commercial pellets, with biochemical composition very distinct from natural food items, especially regarding the amount of lipids. Nevertheless, seabream results from our study presented lower lipid content than what Yildiz (2008) and Baki et al. (2009) found in cultured seabream (9.5% and 10.1%, respectively).
According to our results and based on the classification cited by Ackman (1990) with the exception of gilthead sea bream, all of the analyzed fish can generally be considered as ‘lean’ or ‘low fat’ fish.
Water content is a good indicator of the relative content of energy, protein and lipids in the fish. A linear relation between water and lipid contents has been determined for various species (Clupea harengus, Stroud, 1972; Merluccius hubbsi, Scomber japonicus marplatensis, Engraulis achota, Calabrese, 1966). Love (1970) and Stroud (1972) have also shown the relation between protein and water contents for Gadus morhua and Clupea harengus, respectively. The establishment of these correlations could be useful to estimate one of the contents based on the determination of the other. Based on the abovementioned, it is generally agreed that the lower the percentage of water, the greater lipids and protein contents and higher the energy density of the fish. In the present work, muscle moisture content, varied between 58.1% and 78.6%. Though statistically not significantly correlated (p>0.05; r= -0.25), an inverse trend between water content and protein was noticed. Fish with higher moisture content presented less protein content, meaning that white sea bream presented the lowest moisture content (58.1%), followed by offshore rockfish (62.3%), while fork-beard presented the highest water content (78.6%), followed by black scabbard and pink dentex with 76.4% and 76.2%, respectively (Table 1). No significant correlation was found for lipid and moisture content (p>0.05; r= -0.06).
Cluster analysis performed for chemical composition is shown in Figure 1. The dendrogram was classified into groups by arbitrarily applying the Squared Euclidean Distance method. Of the 14 analysed species, gilthead sea bream had the least similarity with the other species, followed by white wea bream. In addition, cluster results revealed two major groups; one constituted by offshore rockfish and blue jack mackerel and a second group composed by the ten remaining species. Within this group, an obvious and very similar cluster was formed between red scorpion fish, white trevally, bluefish and black tail comber. The dissimilarity of gilthead sea bream and white sea bream may be related with nutritional aspects. White sea bream is an omnivorous species that has different nutrient requirements than the remaining species that are mainly hunting predators.
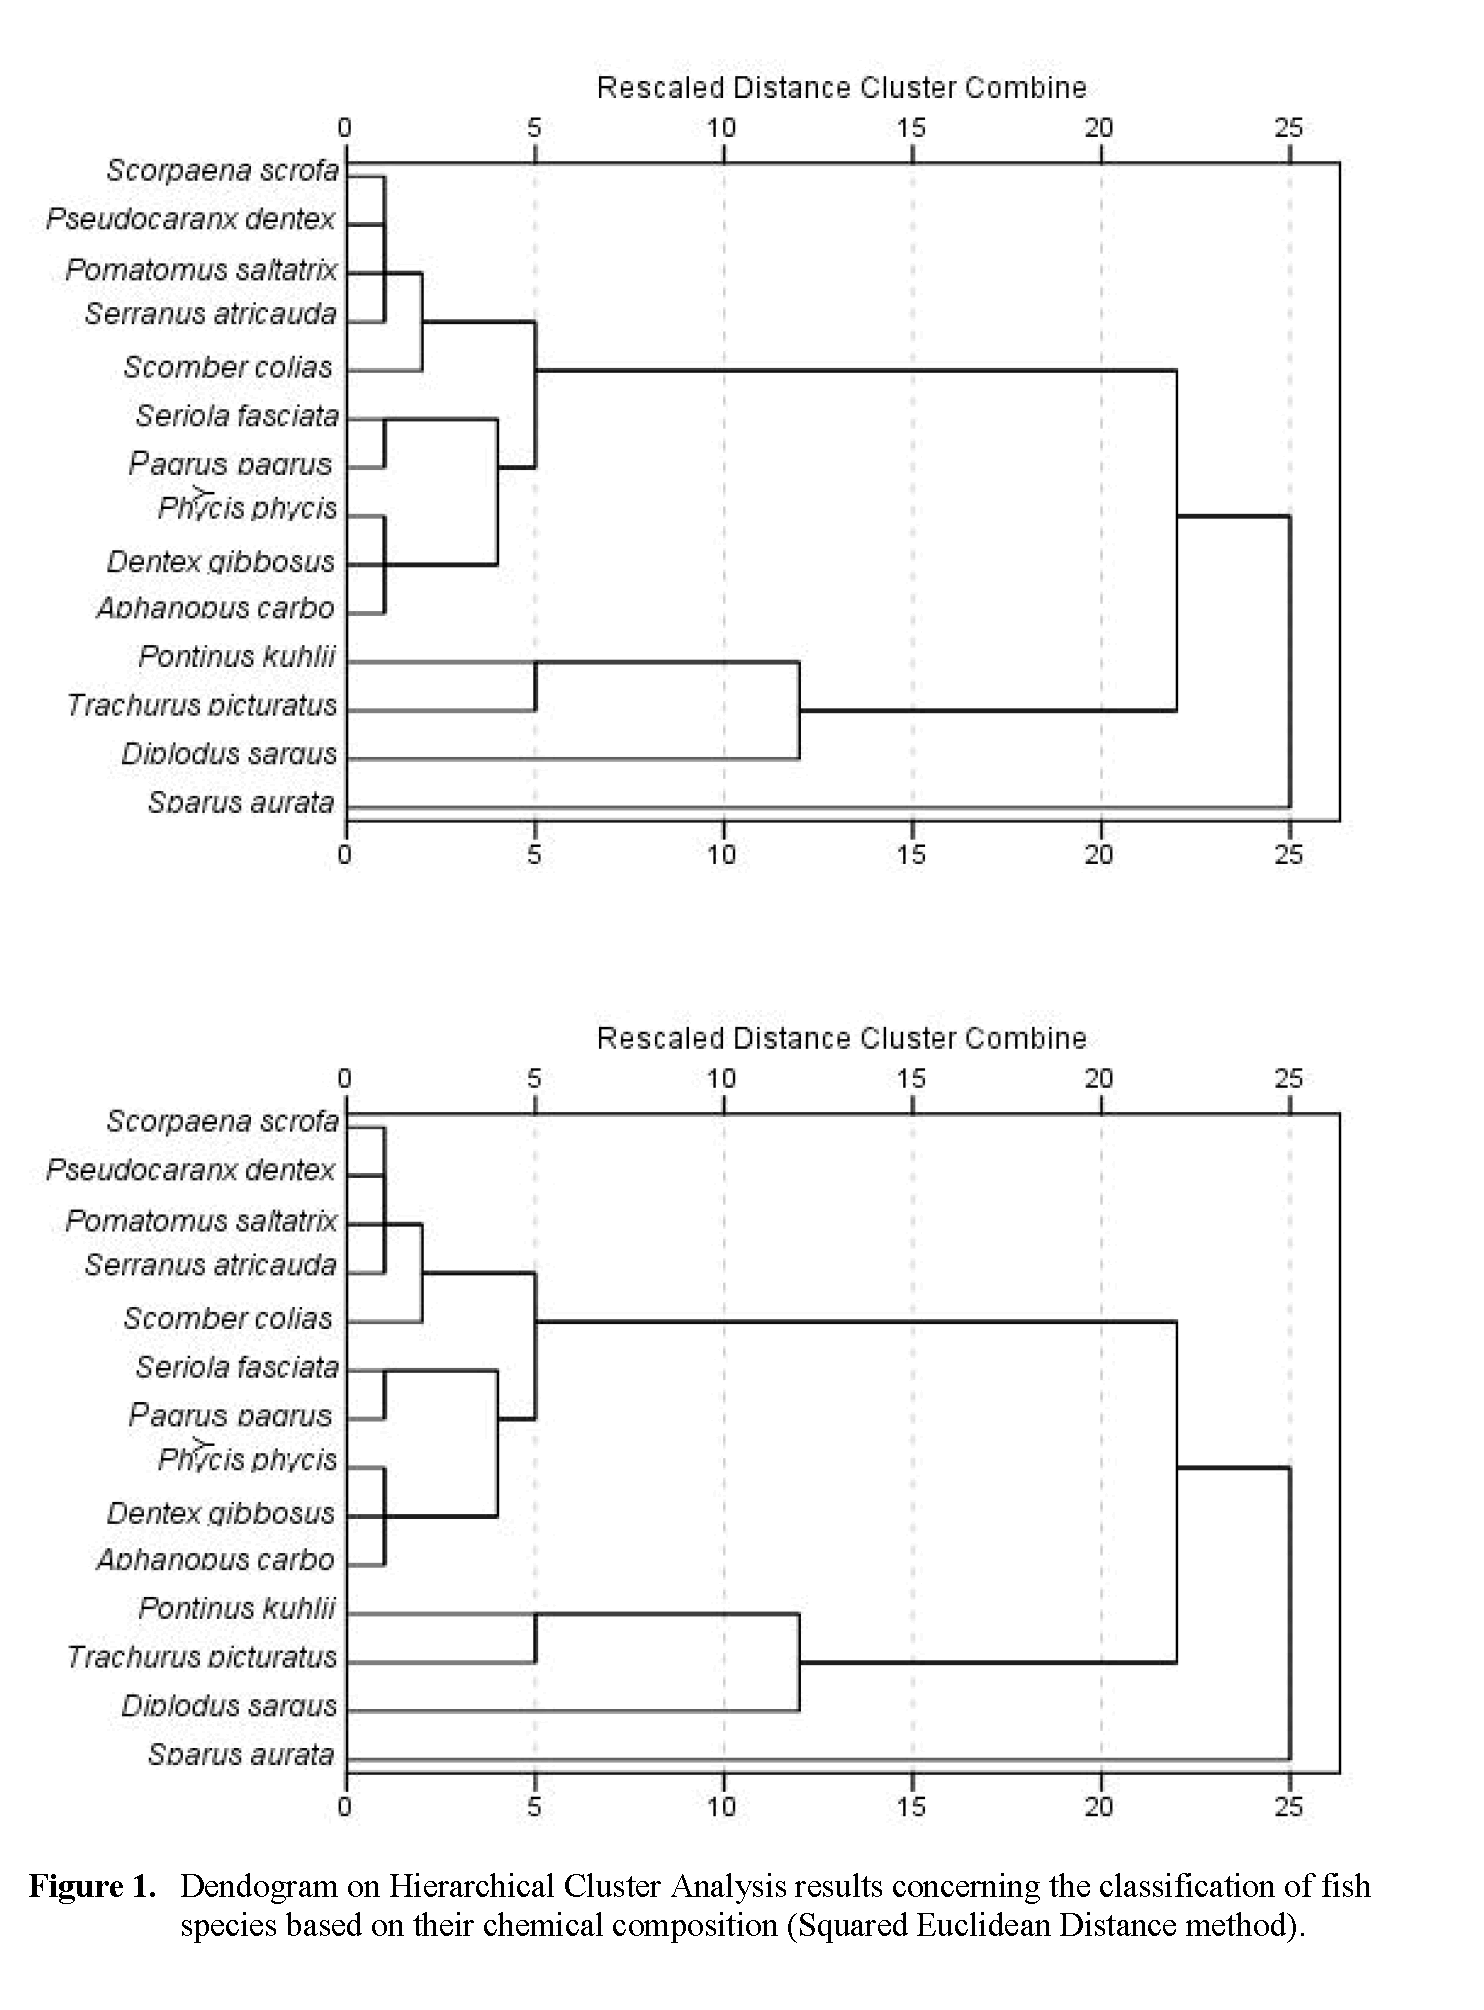
Figure 1: Dendogram on Hierarchical Cluster Analysis results concerning the classification of fish species based on their chemical composition (Squared Euclidean Distance method).
The fatty acid profile was determined by Gas Chromatography and a total of 30 FAMEs were detected in the fish samples under study. Table 2 summarizes the fatty acid percentage distribution (% w/w of total fatty acids) in the muscle of the analyzed species. Results show that the percentage of fatty acids varied widely among the considered fish species, ranging from 26.2% to 35.8% saturated (SFAs); 10.5% to 37.6% monounsaturated (MUFAs) and 28.7% to 57.5% polyunsaturated (PUFAs) fatty acids. Among them, those occurring in higher proportions were palmitic acid (C16:0; 18-26%) and stearic acid (C18:0; 4-10%) as SFAs; oleic acid (C18:1; 9-26%) as MUFAs and docohexaeanoic acid (C22:6n-3; 15-48%) as PUFAs. It was also observed that the proportion of these fatty acids changed significantly between species (p<0.05). Palmitic acid contributed 61.2-72.2% of the total SFAs in all species, presenting the highest proportion in fork-beard and lowest in Atlantic chub mackerel. Oleic acid, the most represented of the MUFAs for all species, accounted for 68.6% of total MUFAs in Atlantic chub mackerel and 87.5% in bluefish. This acid has particular importance in human feeding for the stimulation of bile secretion, which is necessary for digestion and absorption of fats (Reale et al., 2006). As expected, the major PUFA were docosahexaenoic acid (DHA, C22:6n-3) and eicosapentaenoic acid (EPA, C20:5n-3). These two fatty acids, for which marine fish lipids are well known to be rich in, play a vital role in human nutrition and disease prevention. In fact, general recommendations for daily dietary intakes of DHA/EPA ratios have been established. DHA maximum content was found in red porgy, accounting for 82.9% of total PUFAs, whereas reared gilthead sea bream, followed by white sea bream, presented the lowest DHA content (14.8% and 15.6%, respectively). Again, DHA content in cultured seabream and white seabream may be correlated with dietary sources. Indeed, Sargent & Henderson (1995) already established the transmission of fatty acids through marine food webs and showed that the fatty acid composition of the fish is highly influenced by the lipids in fish diets. EPA, which was not detected in black tail comber and red porgy, presented its highest content in Atlantic chub mackerel (5.9%), accounting for 13.1% of total PUFAs. Interestingly, Atlantic chub mackerel was also found to be the species with lower proportion of palmitic acid in total SFAs (61.2%) and oleic acid in total MUFAs (68.6%). Analyses of red scorpion fish results revealed a lower proportion of EPA in total PUFAs than what Özogul & Özogul (2007) found for the same species. On the other hand, Reale et al. (2006), also working with red scorpion fish, had similar results to those found in our study. Differences found between studies enlighten the natural variability in fatty acid compositions of different individual fish of the same species. Furthermore, it is known that marine fish can neither synthesize DHA and EPA de novo, nor from shorter chain precursors such as C18:3n-3. Based on this assumption, differences found in DHA and EPA percentages for the same species, by different authors, may be owned due to a multitude of factors, such as food available to the fish, location of catch, and size of the fish, individual variability, fishing season or even starvation (Lie and House, 1992). Fish are the main contributors of n-3 PUFAs for the human diet. Minimum value of recommended PUFA/SFA ratio is 0.45 (HMSO, 1994), which is lower than those obtained for all fish species considered in this study. The highest PUFA/SFA ratio obtained was in red porgy (1.89), followed by pink dentex (1.73), whereas the lowest values were found on white sea bream (0.81), lesser amberjack (1.15) and blue jack mackerel (1.20) (Table 2).
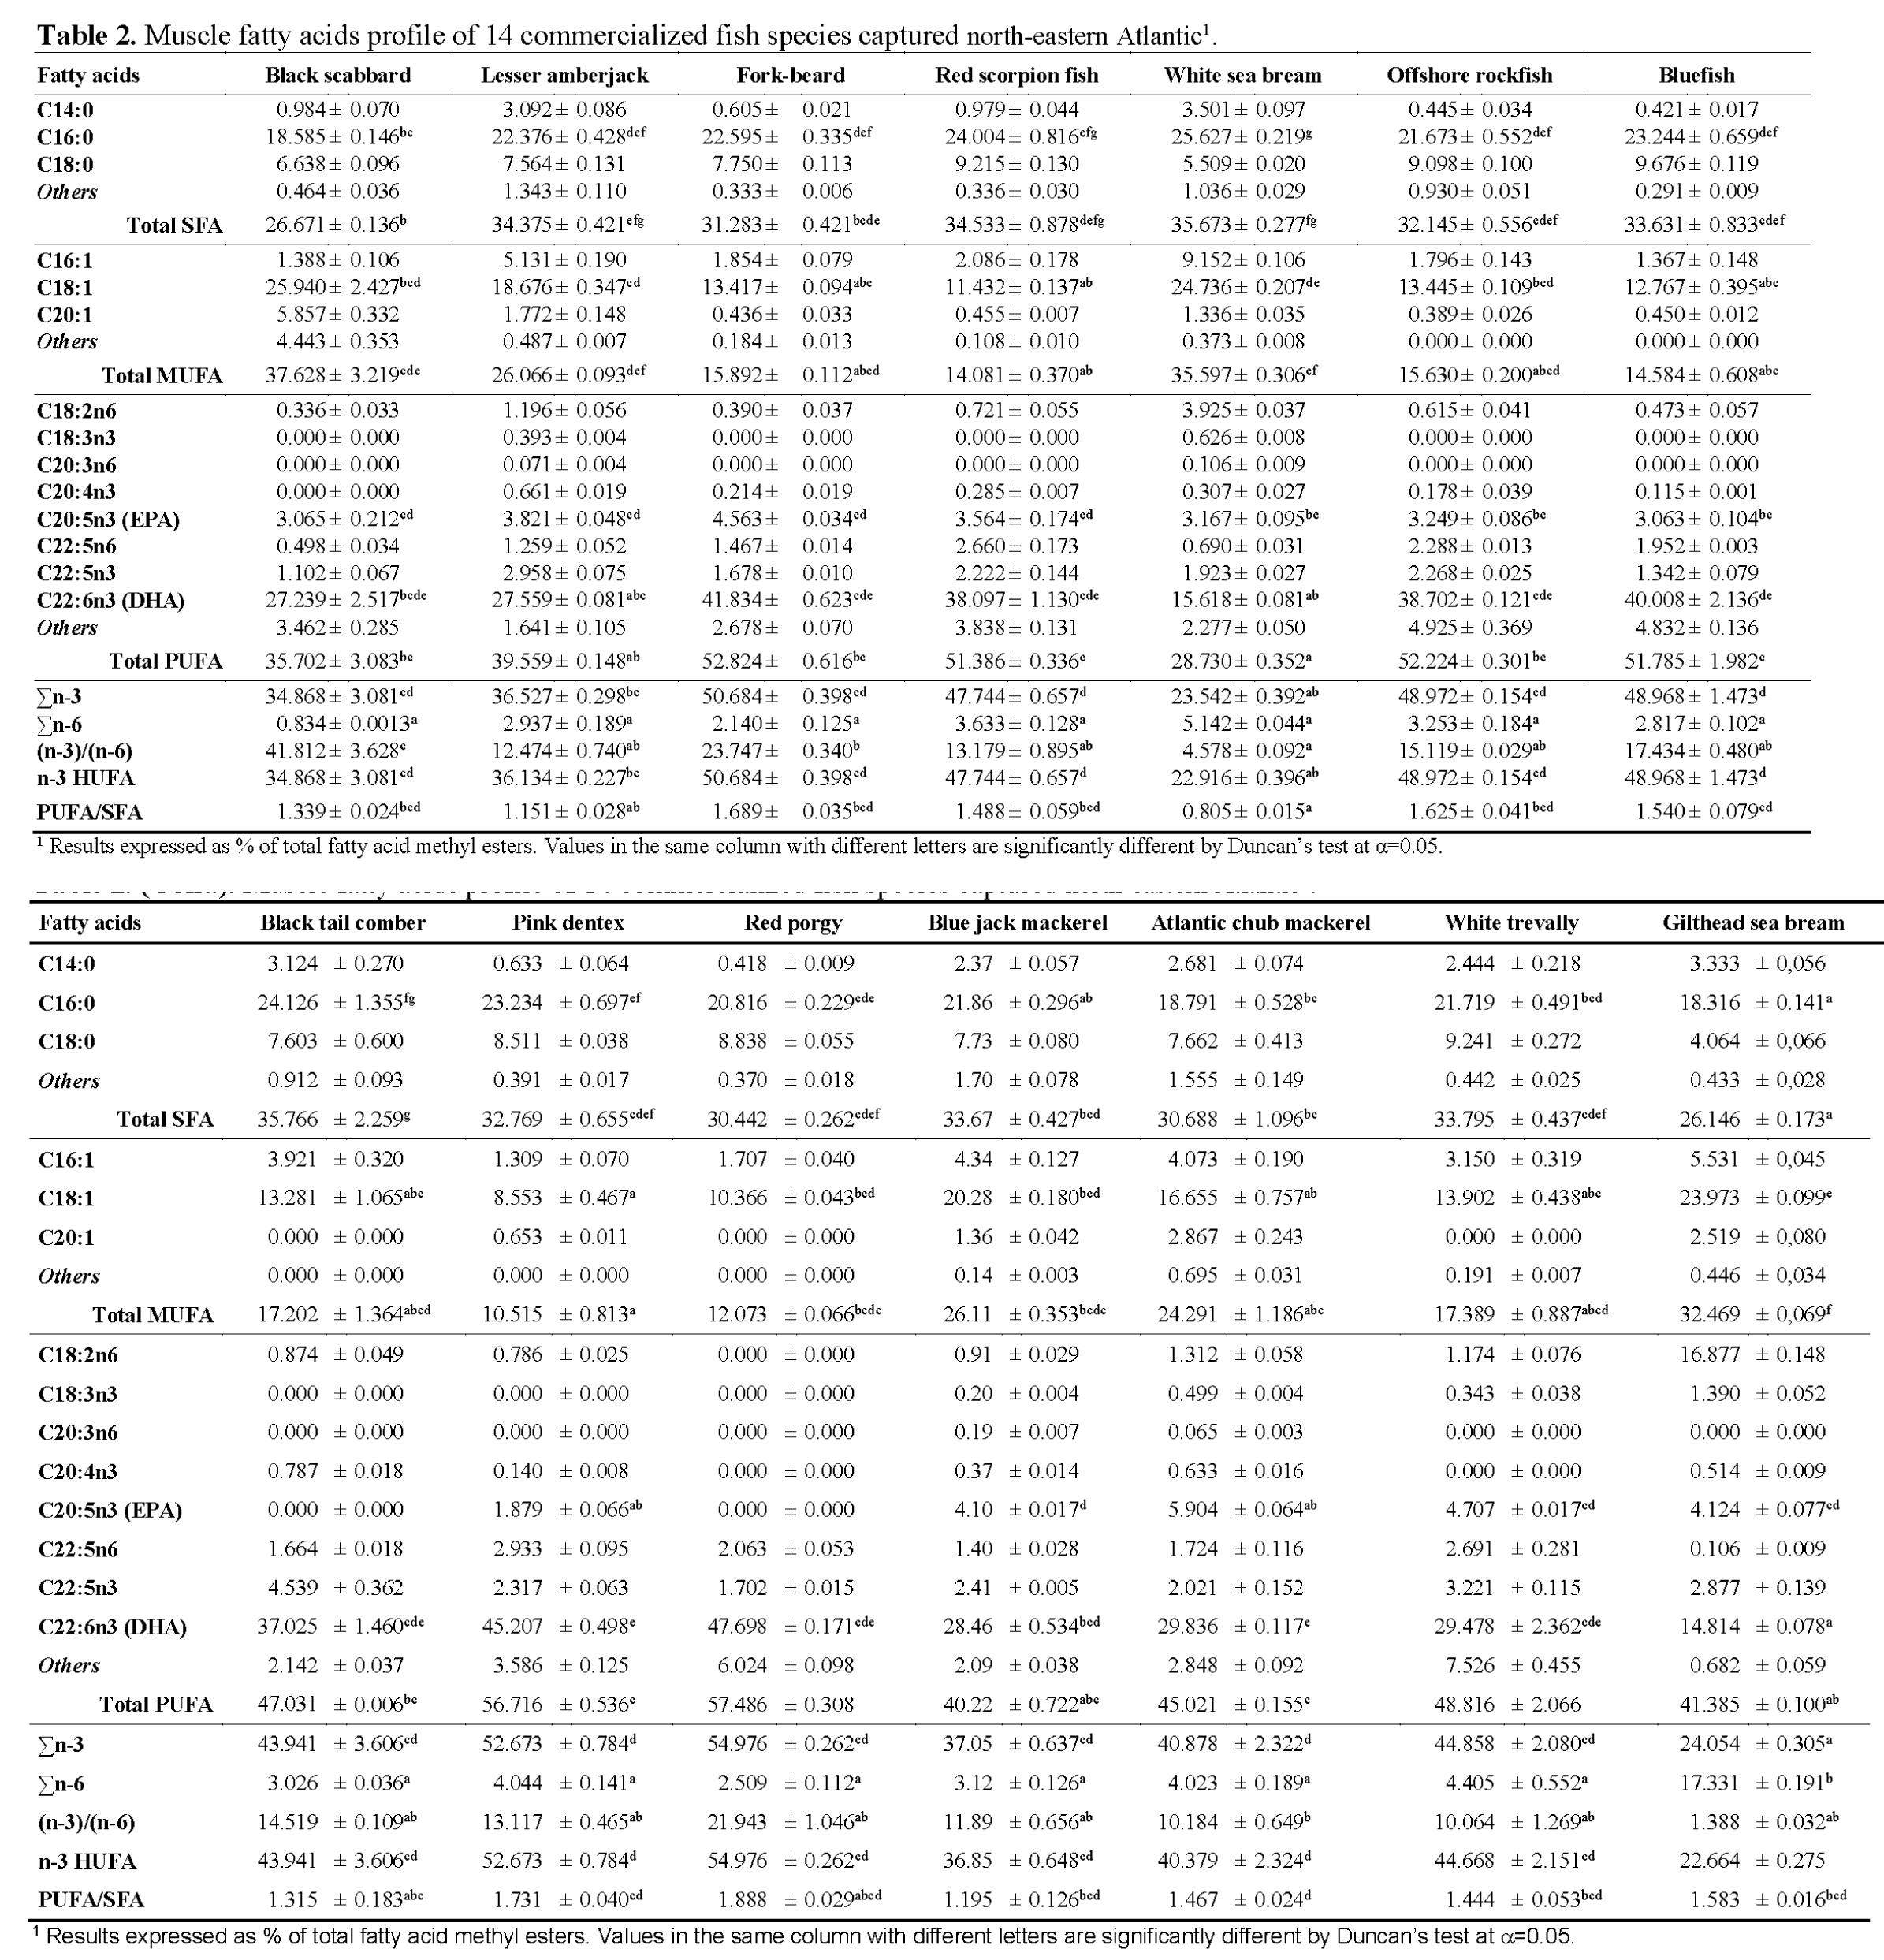
Table 2: Muscle fatty acids profile of 14 commercialized fish species captured north-eastern Atlantic1.
Numerous clinical and epidemiological studies have correlated the long term consumption of PUFAs of the n-3 series with reduced risk of heart disease and high blood pressure; prevention of blood clots, protection against cancer and even alleviation of depression. All of the studied species presented higher levels of n-3 fatty acids than those of the n-6 series, which is typical of marine fish. Σn-3 ranged from 23.5% for white sea bream and reared sea bream (24.1%), to a maximum of 55.0% in red porgy. The significantly lower level of n-3 HUFAs in the farmed marine fish species is because the manufactured feed usually includes high proportions of lipids rich in SFAs and MUFAs, but deficient in n-3 PUFAs, naturally originated from marine phytoplankton and other microorganisms (Ackman and Takeuchi, 1986). As a consequence, low level of n-3 HUFAs in gilthead sea bream specimens may reduce the nutritional quality of their lipid components and effects on disease prevention. The level of the n-6 series was found to be low, ranging from 0.8% in black scabbard to a maximum of 5.1% for white sea bream, excluding gilthead sea bream, as percentage of the n-6 series for this species was around 17.3%. Due to the observed values of the n-6 family, the ratio (n-3)/(n-6) was found to range from 1.39 for reared gilthead sea bream to 41.81 in black scabbard. The use of dietary supplement containing essential fatty acids in a correct ratio (n-3)/(n-6) is very important for humans as it provides the body with useful assistance in dealing with a large number of systemic and cutaneous disorders (Tawfik, 2009). Alterations in the (n-3)/(n-6) ratio can alter the physico-chemical properties of the membranes, due to the competition of both the fatty acid series for the enzymes involved in the metabolism (Illingworth and Ullmann, 1990). Indeed, the (n-3)/(n-6) ratio has been suggested as good marker for comparing nutritional value of fish oils, being considered the most important indicator of fish lipid quality and best reflecting the quality of fish as food.
Because of the increasing interest in fish nutritional value, investigators are also looking for good alternative sources of biomedical significant components to use as raw materials for products such as dietary supplements and pharmaceuticals. Fish hepatic lipids (fatty acid composition) may constitute a valid source of these biomedical components. Table 3 presents the livers fatty acid percentage distribution for all the analyzed species. Considering the most abundant SFAs, palmitic acid showed the lowest level for black scabbard (12.4%), whereas bluefish was found to have the highest percentage (36.3%). As in muscle, oleic acid was the most representative of MUFAs, varying between 8.9% for bluefish and 43.4% for black scabbard. The lowest proportion of oleic acid in total MUFAs was observed in black tail comber (60.4%) and the highest in blue jack mackerel (75.1%). Among the PUFAs, EPA showed the highest levels in lesser amberjack, followed by blue jack mackerel (6.0% and 5.7%, respectively), accounting for 16% and 15% of the total PUFAs, respectively. Statistically significant differences (p<0.05) were also observed among the species for the total of SFAs, MUFAs and PUFAs. Data reported on Table 3 highlights black scabbard as the species with the lowest SFAs (20.5%) and PUFAs (18.1%) content, distinct from pink dentex and red porgy, that presented the highest SFAs (54.8%) and PUFAs (40.7%) contents, respectively. Statistically significant differences were also observed among the different species for the PUFA/SFA ratio, namely between red scorpion fish (1.7) and pink dentex (0.5).
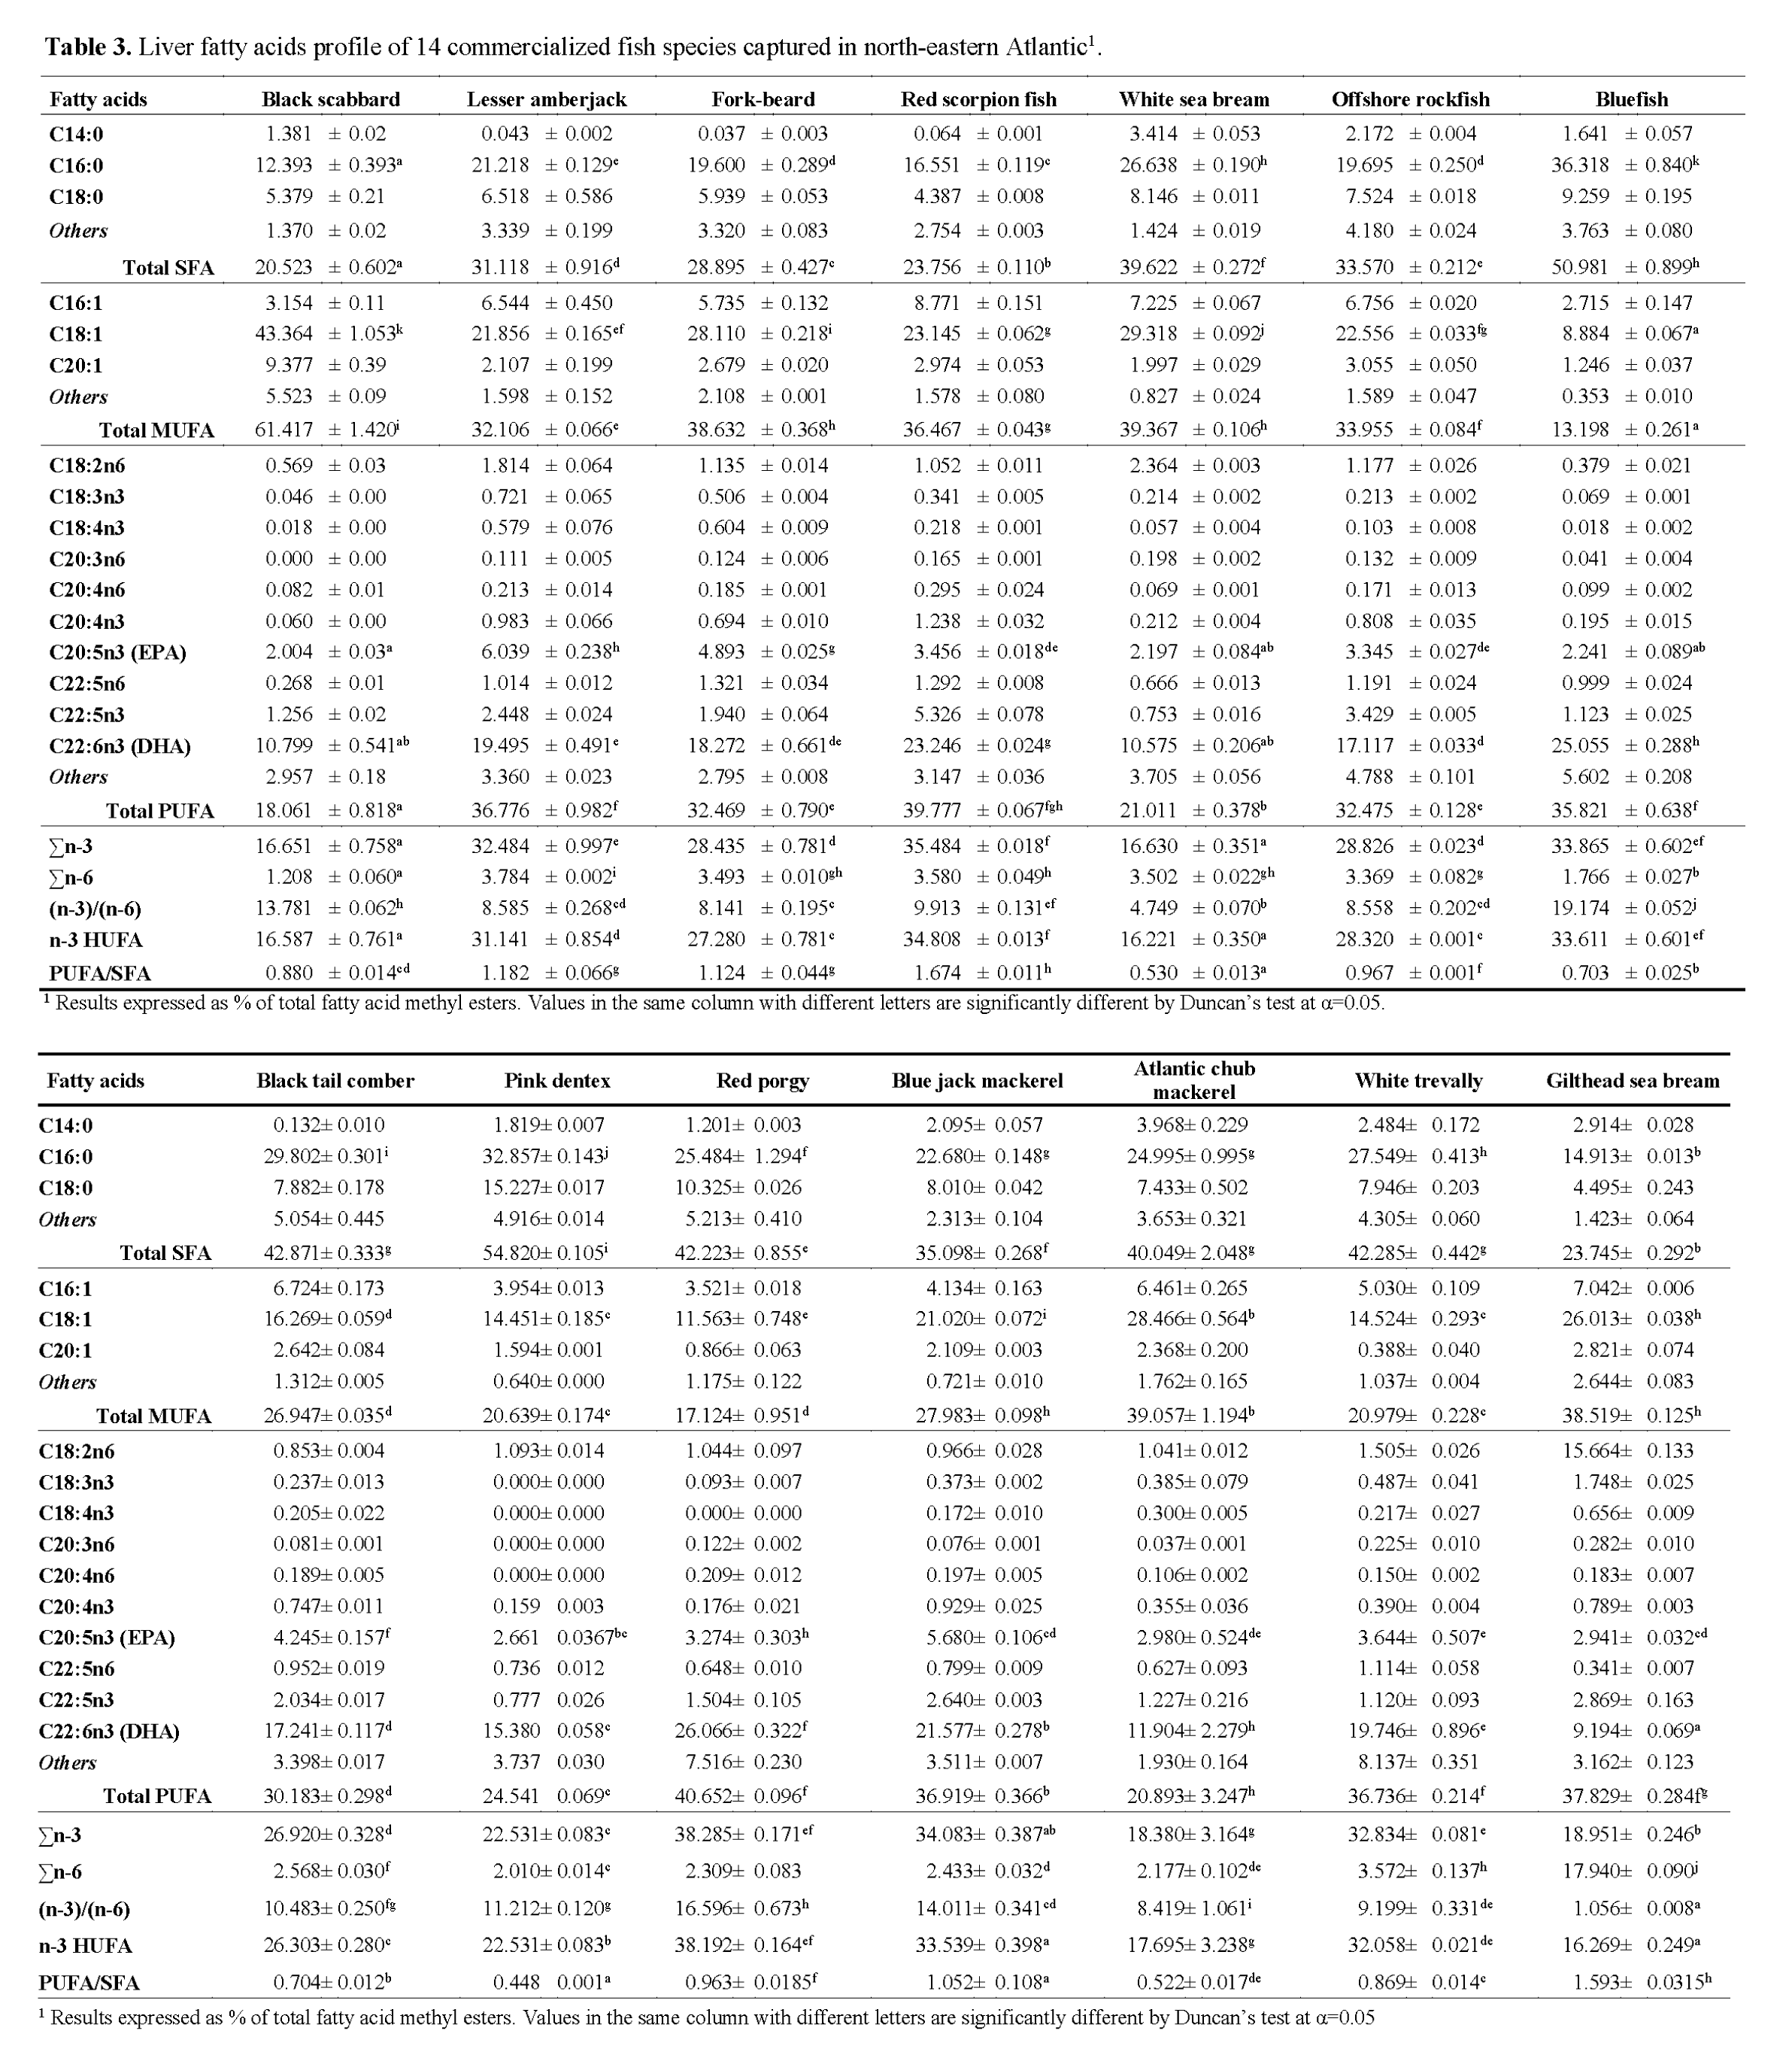
Table 3: Liver fatty acids profile of 14 commercialized fish species captured in north-eastern Atlantic1.
As well as in fish muscle, liver showed a high content of PUFAs due to the high percentage of the n-3 series, especially DHA and EPA. The (n-3)/(n-6) ratio was always >1 which is quite a satisfactory value for human diet.
A general comparison between fish muscle and liver fatty acid composition allows us to comprehend that both muscle and liver presented very high SFAs percentage, considering that fish usually have relatively low contents of SFAs (<30%) (Ackman, 1989). Previously published studies concluded that a decrease in water temperature results in an increase in the degree of unsaturation. Higher SFA contents in found in our study may be related to the fact that total SFAs tend to increase in fish leaving in warm waters. Miniadis-Meimaroglou et al. (2007) reported that the Total SFAs of examined frozen red porgy (Senegal marine region, east Atlantic Ocean) was quite similar to the one reported for Sardinella madeirensis, Sardinella aurita and Cephalopoholis taeniops, also from the east Atlantic ocean, but higher than those of wild red porgy from north Aegean Sea. It was also observed that a large group of the studied species tends to accumulate more SFAs and less PUFAs in the livers rather than in the muscle. While SFAs composition increases indiscriminately, PUFAs lower percentage in livers is owned mainly because of a lower proportion of DHA. Nevertheless, total fatty acid (mg/g sample, Table 4) is significantly higher in liver than in muscle (mean total fatty acid content in livers was almost 7 fold higher than in muscle), suggesting that livers should not be discarded as an alternative source of PUFAs for human diet. Besides PUFA contribution for the reduction of the appearance of cardiovascular diseases, a direct link exists between high levels of cholesterol and the incidence of heart diseases. Cholesterol content in liver revealed significant differences ranging from 0.05±0.01 mg/g in red scorpion fish to 7.58±0.19 mg/g in black scabbard. Cholesterol content in the muscle was comparatively low and independent of fat content (p>0.05; r = 0.05), total fatty acid (p>0.05; r = -0.11) and total PUFA (p>0.05; r = 0.06). Of the seven species analysed for cholesterol content, red porgy presented the lowest value (0.58±0.01mg/g), whereas Atlantic chub mackerel presented the highest (1.74±0.17 mg/g), followed by offshore rockfish (1.58±0.12 mg/g). Mathew et al. (1999) studied cholesterol content of 97 Indian fish and found that 55% of the analyzed species had cholesterol contents between 45 and 65 mg/100 (w/w), which is consistent with our findings. According to the World Health Organization (1982), the maximum recommended intake of cholesterol is 300 mg/day. Taking these facts into account and considering the existence of a linear relationship between dietary cholesterol and blood cholesterol in humans, emphasis on the importance of an increased consumption of fish or fish products must be taken, in order to reduce the risk of the earlier-mentioned diseases, especially cardiovascular diseases.
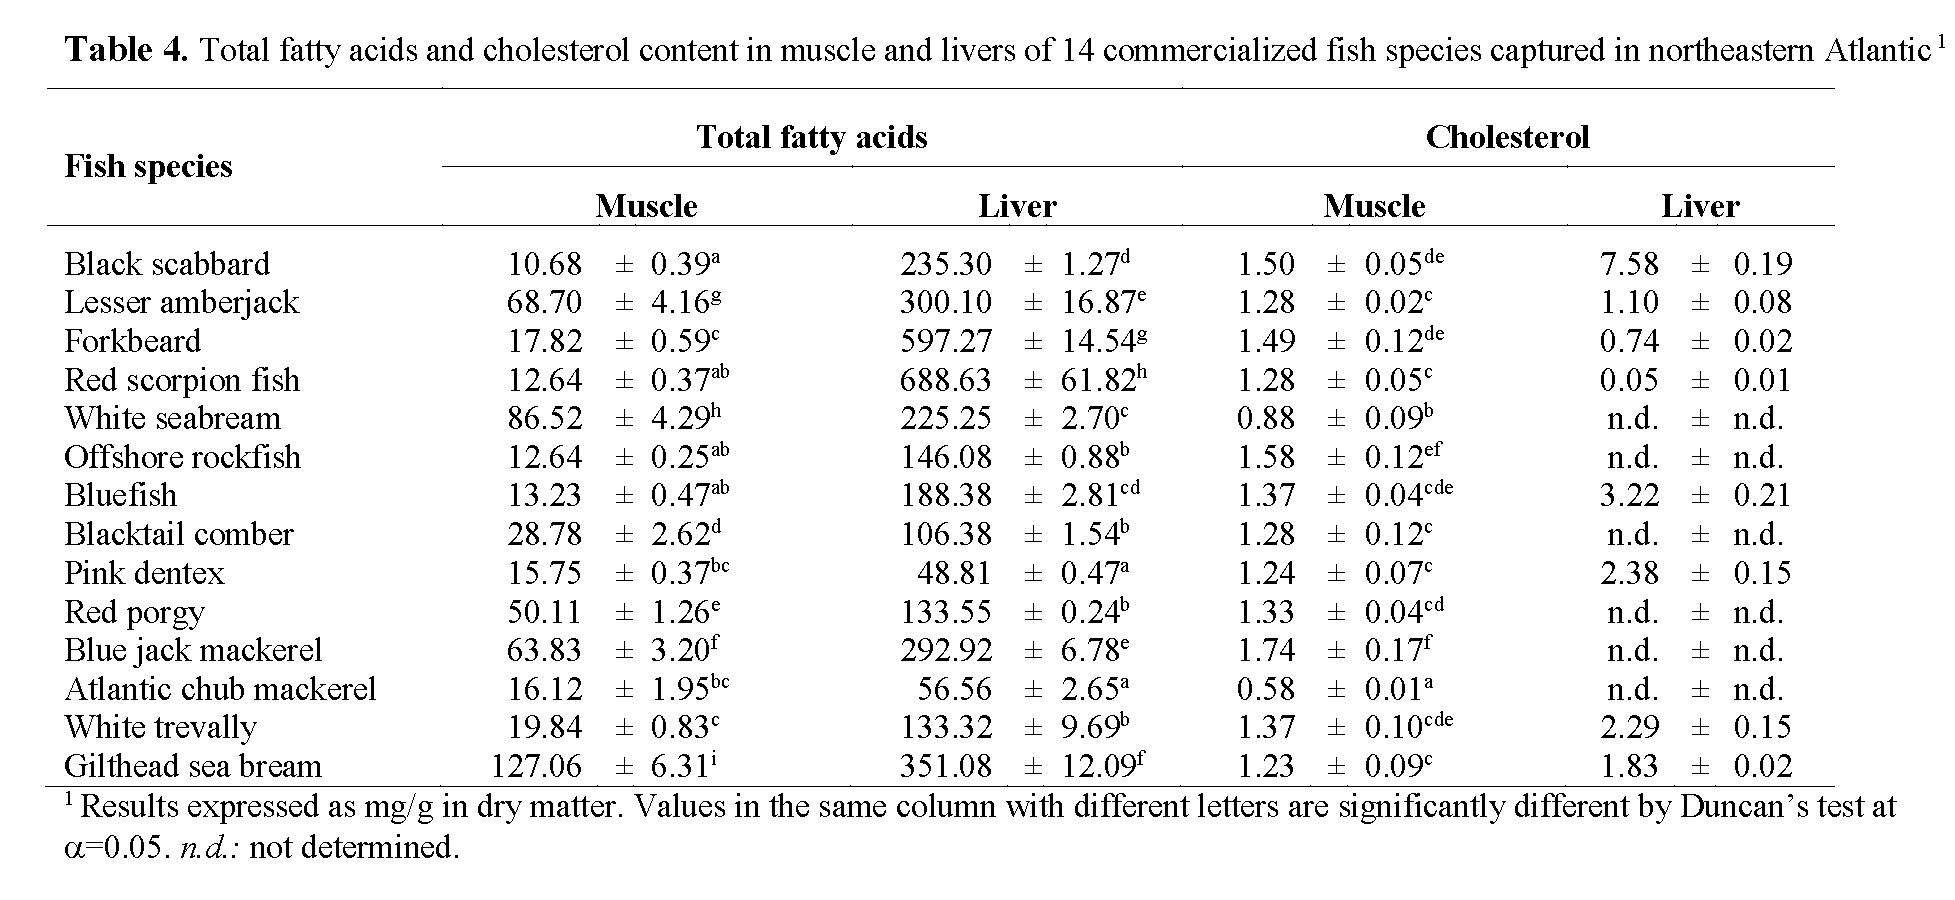
Table 4: Total fatty acids and cholesterol content in muscle and livers of 14 commercialized fish species captured in northeastern Atlantic1
Conclusions
Consumer awareness regarding the nutritional value of food is increasing worldwide. Labelling of all marketed food products with their nutrient contents, in order to support consumer healthier regimes, is becoming mandatory, particularly in developed countries. The results of this study broaden the nutritional knowledge of several consumed species in Mediterranean countries. Although there were differences in lipid content and fatty acid composition, this study revealed that all of the analyzed species were considered to be low fat species (less than 4% of lipid content) and the majority of this fat is polyunsatured with high levels of omega-3 fatty acids, especially DHA and EPA. On the other hand, cholesterol levels, which are found high in most food rich in protein, including poultry, and red meat were found to be not significant in all of the investigated species.
Seabream (Scorpaena scrofa) is one of the most important cultured species around the Mediterranean. The inclusion of this species, in our study, proved that fish origin may influence its nutritional quality thus illustrating that fish fatty acid composition may be tailored depending on fish’s diet composition.
As a conclusion, though fat, cholesterol and fatty acid composition of marine fish lipids is multifarious, (fish biological and physiological conditions, diet, water temperature and season), our results showed that all of the analysed species, are concomitant with the idea that fish can and should be included in diets for at least three reasons: as a general source of nutritional components; as low-fat and high protein food; and as an excellent source of polyunsaturated fatty acids.
Moreover, fish consumption seems to be one way that could assist to implement four of the dietary guidelines currently recommended by various health organizations: eat a variety of foods, maintain desirable weight, and avoid too much fat (namely saturated) and cholesterol.
Acknowledgments
The authors wish to thank “Direcção Regional de Pescas - Secretaria Regional do Ambiente e Recursos Naturais”, for kindly providing the samples.
441
References
- Ackman, R.G., (1989). Nutritional composition of fats in seafoods, Progress in Food and Nutrition Science, 13: 161-241
- nAckman, R.G., Takeuchi, T., (1986). Comparison of fatty acids and lipids of smelting hatchery fed and wild Atlantic salmon (Salmo salar), Lipids, 21: 117-120. doi: 10.1007/BF02534431
- nAckman, R.G., (1990). Seafood lipids and fatty acids, Food Reviews International, 6: 617-646. doi: 10.1080/87559129009540896
- nAOAC, (1990). In K. Helrich (Ed.), Official Methods of Analysis (15th ed.). Arlington, VA, USA: Association of Official Analytical Chemists, Inc
- nBaki, B., Kaba, N., Yucel, S., (2009). Comparative Analysis of Nutritive Composition, Fatty Acids, Amino Acids and Vitamin Contents of Wild and Cultured Gilthead Sea bream (Scorpaena scrofa L. 1758), Journal of Animal and Veterinary Advances, 8(3): 541-544
- nBligh, E.C., Dyer, W.J., (1959). A rapid method of total lipid extraction and purification, Canadian Journal of Biochemistry and Physiology, 37: 913-917. doi: 10.1139/o59-099
- nCalabrese, R.H., (1966). Correlación entre agua y lipidos en merluza, caballa y anchoita del mar argentino (Merluccius Merluccius hubbsi, Scomber japonicus marplatensis, Engraulis anchoita). Comision Asesora Regional de Pesca para el Atlântico Sudoccidental CARPAS, III Período de Sesiones, Montevideo, Uruguay, Abril 25-30, Technical Document Nº 2, Contribuciones del Instituto de Biologia Marina Nº. 37
- nCohen, Z., Von Shak, A., Richmond, A., (1988). Effect of environmental conditions on fatty acid composition of the red algae Porphyridium cruentum: correlation to growth rate, Journal of Phycology, 24: 328-332
- nCrawford, M.A., (1993). The role of essential fatty acids in neural development: implications for perinatal nutrition, American Journal of Clinical Nutrition, 57: 703-710
- nHMSO, UK., 1994. Nutritional aspects of cardiovascular disease (report on health and social subjects No. 46). London: HMSO
- nIllingworth, D.R., Ullmann, D., (1990). Effects of omega-3 fatty acids on risk factors for cardiovascular disease. In: R.S. Lees & M. Karel (Ed.), Omega-3 Fatty Acids in Health and Disease, New York (USA) and Basel (Switzerland), Marces Dekker, Inc., pp.39-69
- nKinsella, J.E., (1988). Food lipids and fatty acids: importance in food quality, nutrition and health, Food Technology, 42(10): 124-145
- nLeaf, A., Weber, P.C., (1988). Cardiovascular effects of n-3 fatty acids, The New England Journal of Medicin, 318: 549-557. doi: 10.1056/NEJM198803033180905
- nLepage, G., Roy, C.C., (1996). Direct transesterification of all classes of lipids in one-ste reaction, Journal of Lipid Research, 27: 114-119
- nLie, Ø., House, I., (1992). The effect of starvation on the composition of Atlantic salmon (Salmo salar), Fiskeridirektoratet Skrifter serie Ernaering, 5: 11-16
- nLove, R.M., (1970). The chemical biology of fishes. London and New York: Academic Press
- nMathew, S., Ammu, K., Viswanathan, P.G., Devadasan, K., (1999). Cholesterol content of Indian fish and shellfish, Food Chemistry, 66: 455-361. doi: 10.1016/S0308-8146(99)00050-3
- nMiniadis- Meimaroglou, S., Dimizas, C., Loukas, V., Moukas, A., Vlachos, A., Thomaidis, N., Paraskevopoulou, V., Dasenakis, M., (2007). Proximate composition, fatty acids, cholesterol, minerals in frozen red porgy, Chemistry and Physics of Lipids, 146(2): 104-110. doi: 10.1016/j.chemphyslip.2006.12.009
- nMurray, J., Burt, J.R., (2001). The composition of fish. Torry Advisory Notes No. 38. Ministry of Technology. Torry Research Station
- nNaemmi, E.D., Ahmad, N., Al-Sharrah, T.K., Behbahani, M., (1995). Rapid and simple method for determination of cholesterol in processed food, Journal of AOAC International, 78: 1522-1525
- nOehlenschläger, J., (2000). Cholesterol content in edible part of marine fatty pelagic fish species and other seafood. In: S.A. Georgakis (Ed.), Proceedings of 29th WEFTA Meeting, (pp. 107-115). 10-14 October, 1999. Greece
- nÖzogul, Y., Özogul, F. (2007). Fatty acid profiles of commercially important fish species from the Mediterranean, Aegean and Black Seas, Food Chemistry, 100: 1634-1638. doi: 10.1016/j.foodchem.2005.11.047
- nÖzogul, Y., Özogul, F., Ççek, E., Polat, A., Kuley, E., (2009). Fat content and fatty acid compositions of 34 marine water fish species from the Mediterranean Sea, International Journal of Food and Science Nutrition, 6: 464-475. doi: 10.1080/09637480701838175
- nReale, A., Ziino, M., Ottolenghi, F., Pellusi, P., Romeo, V., Condurso, C., Sanfillipo, M., (2006). Chemical composition and nutritional value of some marine species from the Egadi Islands, Journal of Chemistry Ecology, 22(1): 173-179
- nRueda, F.M., López, J.A., Martínez, F.J., Zamora, S., (1997). Fatty acids in muscle of wild and farmed red porgy, Pagrus pagrus, Aquaculture Nutrition, 3: 161-165. doi: 10.1046/j.1365-2095.1997.00088.x
- nSargent, J.R. and Henderson, R.J., (1995). Marine (n-3) polyunsaturated fatty acids. In: R.J. Hamilton (Ed.), Developments in Oils and Fats, London: Blackie Academic and Professional, pp. 32-65. doi: 10.1007/978-1-4615-2183-9_2Stroud, G.D. 1972. The herring. Torry Advisory Note, Nº 57
- nTawfik, M. 2009. Proximate composition and fatty acid profiles in most common available fish species in Saudi Market, Asia Pacific Journal of Clinical Nutrition, 1(1): 50-57. doi: 10.3923/ajcn.2009.50.57
- nWorld Health Organization, (1982). Expert Committee: prevention of coronary heart disease. WHO Technical Report Series 678
- nYildiz, M., Sener, E., Timur, M., (2008). Effects of differences in diet and seasonal changes on the fatty acid composition in fillets from farmed and wild sea bream (Scorpaena scrofa L.) and sea bass (Dicentrarchus labrax L.), International Journal of Food Science & Technology, 43: 853-858. doi: 10.1111/j.1365-2621.2007.01526.x