Research Article - (2022) Volume 10, Issue 6
Comparative LCMS/MS Drug Analysis of paired Urine, Oral Fluid and Capillary Blood Samples in Addiction Therapy
Bernd Huppertz1*,
Michael Bottcher2,
Stefan Lierheimer2,
Prisca Gottwald3,
Sergej Bleicher4 and
Martin Schafer3
1Forensic toxicology and special chemistry, MVZ Labor Dr. Quade and Kollegen, Cologne, Germany
2Analysis of legal and illicit drugs, MVZ Medizinische Labore Dessau Kassel GmbH, Dessau, Germany
3Psychiatry, psychotherapy, psychosomatics and addiction medicine, Evang. Kliniken Essen-Mitte, Essen, Germany
4Drug analysis/forensic toxicology, Synlab Medizinisches Versorgungszentrum Weiden GmbH, Weiden in der Oberpfalz, Germany
*Correspondence:
Bernd Huppertz,
Forensic toxicology and special chemistry, MVZ Labor Dr. Quade and Kollegen, Cologne,
Germany,
Email:
Received: 02-May-2022, Manuscript No. IPACLR-22-12769;
Editor assigned: 04-May-2022, Pre QC No. IPACLR-22-12769(PQ);
Reviewed: 18-May-2022, QC No. IPACLR-22-12769;
Revised: 09-Jun-2022, Manuscript No. IPACLR-22-12769(R);
Published:
16-Jun-2022, DOI: 10.36648/2386-5180.22.10.416
Abstract
Background: For many years, drug of abuse analysis was typically performed on urine using enzyme immunoassays with Gas Chromatography–Mass Spectrometry (GCMS) confirmation. However, analytical instruments improved significantly over the last decades, allowing analysis of smaller sample volumes and other matrices, such as capillary blood and oral fluid, with lower drug concentrations. To our knowledge, the present study is the first to compare the matrices urine, capillary blood and oral fluid using similar analytical techniques and paired samples.
Method: Samples were collected from patients admitted for detoxification to Huyssens-Stiftung, Essen, Germany over a period of maximum 14 days. Each patient provided samples of all three matrices at almost the same time during each collection cycle. All analyses were performed with Liquid Chromatography with tandem Mass Spectrometry (LCMS/MS).
Results: Detection periods vary between the matrices depending on the analytes and several positiv results in one matrix could not be confirmed in one or two of the others. In particular capillary blood showed some implausible results.
Conclusion: It depends on the formulation of the question which of the matrices is better suitable for any given purpose. The highest positive rates, for example, for 6-Monoacetylmorphine (6-MAM) can be found in oral fluid, and the longest detection periods for cannabis and benzodiazepine detection can be found in urine. Although, again depending on the formulation of the question, the very long detection periods may make it advisable to use a cut off for urine in the range of 10 to 50 ng/ml, depending on the analyte.
Ethical approval: The study was authorized by the ethics commission of the Medical Faculty, University of Duisburg-Essen/Germany on July 15th, 2016
Keywords
Urine, Oral fluid, Capillary blood, LCMS/MS
Introduction
Drug screenings play an important part in adherence monitoring
in addiction therapy. Biological samples are analyzed to detect
concomittant use and observe therapy progress. But what guides
a clinician's choice of matrix?
For many years, drug of abuse analysis was typically performed
on urine using enzyme immunoassays with GCMS confirmation.
In 1984, for example, Richard L. Hawks described the general use
of immunoassays and chromatography in urine drug detection and recommended using a confirmation analysis for all samples
that screened positive [1]. A certain preference for urine may be
attributed to ease of collection as well as high concentrations
of drugs and metabolites which allow for comparatively long
detection times [2]. However, several substances require urine
samples to be hydrolyzed. Furtherrmore, urine is prone to various
forms of manipulation [3]. Also, to avoid sample substitution in an attempt to submit 'clean' urine, collection needs to be executed
either under direct supervision or using a chemical marker to
verify the identity of the sample donor [4].
As the sensitivity of new analytical devices such as LCMS/MS
and high-resolution mass spectroscopy improved over the last
years, it became possible to investigate materials with lower
concentrations of addictive drugs and low sample volumes.
Verstraete [5] determined the detection periods for various
drugs in oral fluid, urine and blood using different cut offs from
different studies of up to 48 h in blood and plasma, up to 50 h for
oral fluid and 96 h for urine.
Numerous publications regarding the detection of drugs in urine,
blood and oral fluid using various analytical procedures have
been available for a long time already. Reviews were provided
e.g. by Moeller et al. [6] in 1998 or Schramm et al. [7], Dolan
et al. [8]. Over the past years, one focus has been directed at
the investigation of capillary blood for various drugs of abuse,
including the analysis of Dried Blood Spots (DBS) [9-11].
Comparative measurements between capillary blood and
DBS showed a significantly broader fluctuation rate and lower
concentrations for cocaine and benzoylecgonine in DBS than in
venous blood [12]. Furthermore, the hematocrit has an influence
on formation of the DBS and the determined concentration of
drugs [13,14]. In our investigation capillary blood was collected in
EDTA coated tubes so that hematocrit has no significance.
The concentration of the drugs in oral fluid depends on the
amount of free, unbound drugs and lipophilic metabolites in
the blood. The oral fluid concentrations are a function of the
drugs' pKa values and of the pH values of the blood as well as the
oral fluid and the protein-bound parts of the drugs. The saliva/
plasma ratio (S/P ratio) can be calculated using the Henderson-
Hasselbalch equation [15]. The pH value in the saliva depends on
the salivation flow. Stimulated saliva has a higher pH value than
unstimulated saliva [16]. Saliva secretion is controlled by the
parasympathetic nervous system and the sympathetic nervous
system and can be influenced by various stimuli. For example,
patients taking medications affecting the nervous system may
show a different oral fluid composition [17]. Please note that
even though the terms saliva and oral fluid may have been used
in an interchangeable manner in literature quoted in this article,
for the purpose of this investigation the term oral fluid is used.
The aim of the study was to evaluate the advantages and
disadvantages of the matrices urine, capillary blood and oral fluid
with paired samples and comparable, sensitive analytical methods
as High-Performance Liquid Chromatograpy (HPLC) coupled with
mass-spectroscopy. The method of sample collection for each
matrix is described in 2.2.
To our best knowledge, comparative measurements from urine,
capillary blood and oral fluid with paired samples and comparable
analytical methods as performed in this study have not been
investigated before.
Methods
General overview: Paired samples of urine, oral fluid and capillary
blood produced by 46 patients investigated for drugs.
Patients
The paired samples originated from 46 patients who were
admitted to the addiction ward of Huyssens-Stiftung, Essen,
Germany, for addictive drug detoxification. 41 patients were
male and 5 female. 16 were between 30-39 years of age, 17
patients between 40-49, and 9 between 50-59. Four patients
were younger than 30 or older than 60 years of age, respectively.
24 of the patients had used two, 15 three, 6 one and 1 four
substances in the past. 33 patients were addicted to heroin, 19
to benzodiazepines, 18 to cocaine, 13 to Tetrahydrocannabinol
(THC) and 4 to amphetamines.
Samples
Urine samples were collected without direct observation using
the Ruma® Marker-System (Ruma GmbH, Cologne, Germany)
[18], oral fluid samples were collected using the Greiner
(Greiner Bio One GmbH, Kremsmünster, Austria) collection
system, and 20 μl capillary blood samples were collected with
an ethylenediaminetetraacetic acid (EDTA) coated Minivette®
(Sarstedt, Nümbrecht, Germany). Oral fluid samples and
capillary blood samples were taken at the same time. The urine
samples were passed within one hour before or after collecting
the other matrices. The samples were labeled with barcodes
and transferred to the respective laboratory in refrigerated
containers. The urine samples were analyzed by MVZ Labor Dr.
Quade & Kollegen, Cologne, Germany, the oral fluid samples by
MVZ Synlab, Weiden, Germany, and the capillary blood samples
by MVZ Labor Dessau, Dessau, Germany.
Samples were collected on the day the patients were admitted
to the ward (day 1) as well as on days 3, 5, 7, 9, 11 and 13 or 14,
respectively. For the first 10 study participants, samples were only
taken for a period of 7 days after the patient was admitted to the
ward. Since it became apparent that the period of detectability is
longer than 7 days in several matrices, the period of investigation
was extended to 2 weeks for the following patients. No further
samples were collected after a patient tested negative in all three
matrices for two consecutive days. Patients who stopped therapy
before the end of the 2 week period were excluded.
Analytical Method
The analytical method used for all three matrices was triple quad
mass spectroscopy after HPLC or LCMS/MS. Depending on the
executing laboratory, equipment by different manufacturers
was used. Agilent (Santa Clara, CA, USA) for oral fluid, Shimadzu
(Kyōto, Japan) for urine and Waters (Milford, MA, USA) for
capillary blood. Additionally, the urine samples were also tested
using the Siemens enzyme multiplied immunoassay technique
(EMIT). The results of the immunoassay are shown in Table 1.
| Substance |
|
Urine EIA |
Urine |
Urine > |
Oral Fluid |
Capillary Blood |
| THC/THC-COOH |
Cut Off |
20 |
0.6 |
10 |
0.5 |
1 |
|
positive d1 |
13 |
16 |
12 |
5 |
11 |
|
from that negative d3 |
1 |
2 |
5 |
3 |
3 |
|
positive d13/14 |
7 |
11 |
4 |
0 |
1 |
|
last positive |
>=14 |
>=14 |
>=14 |
3 |
>=14 |
| Cocain/BZE |
Cut Off |
35 |
1.7 |
35 |
0.5 |
1 |
|
positive d1 |
11 |
18 |
12 |
14 |
15 |
|
from that negative d3 |
4 |
0 |
2 |
3 |
1 |
|
positive d13/14 |
0 |
6 |
1 |
1 |
3 |
|
last positive |
11 |
>=14 |
>=14 |
>=14 |
>=14 |
| Morphine/Opi |
Cut Off |
100 |
0.4 |
25 |
0.5 |
1 |
|
positive d1 |
23 |
23 |
23 |
23 |
23 |
|
from that negative d3 |
8 |
0 / d5=1 |
2 |
9 |
1 |
|
positive d13/14 |
0 |
11 |
0 |
0 |
6 |
|
last positive |
5 |
>=14 |
7 |
11 |
>=14 |
| Codeine |
Cut Off |
|
0.8 |
25 |
0.5 |
1 |
| positive d1 |
|
19 |
18 |
17 |
18 |
|
from that negative d3 |
|
5 |
17 |
16 |
7 |
|
positive d13/14 |
|
1 |
0 |
0 |
3 |
|
last positive |
|
>=14 |
3 |
3 |
>=14 |
| 6-MAM |
Cut Off |
|
1.8 |
|
0.5 |
1 |
| positive d1 |
|
19 |
|
25 |
9 |
|
from that negative d3 |
|
18 |
|
14 |
5 |
|
positive d13/14 |
|
0 |
|
0 |
2 |
|
last positive |
|
3 |
|
7 |
9/>=14 |
| Acetylcodeine |
Cut Off
positive d1 |
|
0.3
12 |
|
0.5
16 |
1
1 |
|
from that negative d3 |
|
12 |
|
16 |
1 |
|
positive d13/14 |
|
0 |
|
0 |
0 |
|
last positive |
|
1 |
|
1 |
1 |
| Amphetamine/s |
Cut Off |
500 |
0.7 |
50 |
5 |
1 |
|
positive d1 |
5 |
8 |
6 |
5 |
9 |
|
from that negative d3 |
3 |
3 |
2 |
2 |
3 |
|
positive d13/14 |
0 |
3 |
0 |
0 |
2 |
|
last positive |
5 |
>=14 |
7 |
7 |
>=14 |
| Oxazepam/BZO |
Cut Off |
200 |
0.3 |
50 |
0.5 |
1 |
|
positive d1 |
14 |
16 |
11 |
1 |
9 |
|
from that negative d3 |
0 |
0 |
0 |
0 |
0 |
|
positive d13/14 |
7 |
11 |
6 |
1 |
4 |
|
last positive |
>=14 |
>=14 |
>=14 |
7/>=14 |
>=14 |
| Diazepam |
Cut Off |
|
0.5 |
|
0.5 |
1 |
| positive d1 |
|
12 |
|
10 |
13 |
|
from that negative d3 |
|
2 |
|
0 |
1 |
|
positive d13/14 |
|
3 |
|
7 |
1 |
|
last positive |
|
>=14 |
|
>=14 |
>=14 |
| Nordiazepam |
Cut Off |
|
1.3 |
50 |
0.5 |
1 |
| positive d1 |
|
13 |
7 |
6 |
11 |
|
from that negative d3 |
|
2 |
3 |
0 |
0 |
|
positive d13/14 |
|
8 |
2 |
5 |
8 |
|
last positive |
|
>=14 |
=>14 |
>=14 |
>=14 |
| Temazepam |
Cut Off |
|
1 |
50 |
0.5 |
1 |
| positive d1 |
|
15 |
12 |
1 |
8 |
|
from that negative d3 |
|
1 |
3 |
0 |
0 |
|
positive d13/14 |
|
9 |
5 |
0 |
1 |
|
last positive |
|
>=14 |
>=14 |
5 |
>=14 |
| Clonazepam(NH) |
Cut Off |
|
2.6 |
|
0.5 |
1 |
| positive d1 |
|
6 |
|
2 |
5 |
|
from that negative d3 |
|
2 |
|
0 |
2 |
|
positive d13/14 |
|
0 |
|
0 |
0 |
|
last positive |
|
11 |
|
7 |
9 |
Table 1: The number of positive samples of the different analytes in the three matrices at the first and last day. It is also shown how many of the positive samples were negative at day 3 and the day the last positive result occurred. The cut off values are in ng/ml. If not shown the cut off for capillary blood was 1 and for oral fluid 0.5 ng/ml.
In urine and oral fluid the drug concentrations were quantified.
For capillary blood a semiquantitative method was used,
respectively. The concentration in capillary blood was estimated
without considering the hematocrit value because DBS were not
used.
Our investigation covered a wide range of substances or substance
groups. Five individual substances from the substance group
of opiates were investigated. These were morphine, codeine, dihydrocodeine, 6-monoacetylmorphine and acetylcodeine. In
capillary blood, morphine glucuronide and codeine glucuronide
were additionally analyzed as plausibility checks. For cocaine
detection, cocaine and the main metabolite benzoylecgonine
were measured in capillary blood and oral fluid, in urine only
benzoylecgonine. For the detection of cannabis consumption,
oral fluid and capillary blood were tested for THC and the main
metabolite 11-Nor-9-carboxy-Δ9-tetrahydrocannabinol (THCCOOH).
Urine was tested only for the metabolite THC-COOH.
With all three matrices, amphetamine, methamphetamine,
Methylenedioxyamphetamine (MDA), Methylenedioxy-
Methylamphetamine (MDMA) and Methyl Diethanolamine
(MDEA) were analyzed for the class of amphetamines. For the
detection of benzodiazepines, investigation was performed
for diazepam and metabolites (nordiazepam, temazepam
and oxazepam), bromazepam, flunitrazepam, nitrazepam,
clonazepam, midazolam, flurazepam, alprazolam, lorazepam,
clobazam, triazolam or their metabolites, respectively. Urine
was primarily analyzed for the metabolites, whereas capillary
blood and oral fluid were primarily analyzed for the parent
substances. The results of the Siemens EMIT urine screening
procedure were not explicitly included in the evaluation as they
are semiquantitative group tests. However, they were used as a
comparison to LCMS/MS testing.
The results were individually analyzed for each substance. Only
those substances were considered in the evaluation that showed
values above the cut off or the detection limit, respectively,
on the first day in at least one matrix (Table 2). The evaluation
provides an analysis of samples collected over two weeks of the
individual matrices for the various analytes. As the last day of
sample collection varied between day 13 and day 14, the results of
those two days were pooled. Data on specific substances for patients
who did not reach the endpoints – negative for the substance on
two consecutive days of measurement in at least two matrices or
sample collection over 13/14 days – was not included.
| Analyte |
Urine: limit of detection |
Capillary blood: cut off |
Oral fluid: cut off |
| Morphine |
0.4 |
1.0 |
0.5 |
| Codeine |
0.76 |
1.0 |
0.5 |
| 6-MAM |
1.75 |
1.0 |
0.25 |
| Acetylcodeine |
0.29 |
1.0 |
0.25 |
| THC-COOH |
0.6 |
1.0 |
- |
| THC |
|
1.0 |
1 |
| Benzoylecgonine |
1.65 |
1.0 |
0.5 |
| Cocaine |
|
1.0 |
0.5 |
| Diazepam |
0.5 |
1.0 |
0.5 |
| Nordiazepam |
1.26 |
1.0 |
0.5 |
| Oxazepam |
0.3 |
1.0 |
0.5 |
| Temazepam |
0.93 |
1.0 |
0.5 |
| NH-Clonazepam |
2.61 |
1.0 |
0.5 |
| Clonazepam |
|
1.0 |
|
| Bromazepam |
|
1.0 |
0.5 |
| OH-Bromazepam |
3.09 |
- |
- |
| NH-Flunitrazepam |
0.16 |
0.1 |
0.5 |
| Flunitrazepam |
|
1.0 |
0.5 |
| Amphetamine |
0.68 |
1.0 |
5 |
| Methamphetamine |
0.11 |
1.0 |
5 |
| MDA |
0.19 |
1.0 |
5 |
| MDMA |
0.13 |
1.0 |
5 |
Table 2: Level of detection (ng/ml) of the tested analytes in urine and cut off (ng/ml) for the tested drugs in oral fluid and capillary blood. Analytes with no value in one or more matrices were not measured in this matrix.
All materials and solvents were of LCMS grade. Analytical
standards were purchased from Merck (Darmstadt, Germany)
and LGC Standards GmbH (Wesel, Germany). Solvents of
analytical grade purchased at Carl Roth (Karlsruhe, Germany) or
Merck (Darmstadt, Germany) as well as urine and serum controls
from ACQ Science GmbH (Rottenburg, Germany) and Medichem
(Rendsburg, Germany) were used.
Detection of drugs in urine: Urine analysis was carried out on a
Shimadzu LCMS 8050 with a Multiple Reaction Monitoring (MRM)
method with two or three transitions for each analyte. A liquid/
liquid extraction procedure was utilized for sample preparation.
All drugs were measured in one analysis run. Most of the results
are quantitative. Some analytes (acetylcodeine, OH-bromazepam,
NH-clonazepam) were measured semiquantitatively. 100 μl
urine was mixed with 10 μl internal standard (5-50 ng/ml of
each analyte), 10 μl buffer, 10 μl BG-turbo ß-glucuronidase and
40 μl methanol. The mixture was incubated for 14 h at 60 °C.
After incubation, 25 μl 3 M NH3, 1.6 ml saturated NaCl-solution
and 2 ml ethyl acetate/dichlormethan (1:1) were added to the
sample in a glass vial. The vial was mixed in an overhead mixer
for 10 min and then centrifuged for 5 min at 1500 rpm. The
supernatant was transferred in a separate vial. In a second step
2 ml ethyl acetate/diethylether (1:1) were added to the residue
in the original vial and mixed overhead for 10 min. Then, the
sample was again centrifuged for 5 min at 1500 rpm and the
supernatant of the second step was added to the supernatant of
the first step. 50 μl 10% Hydrochloric Acid (HCl) was added and
the sample was dried under nitrogen at 37 °C. The residue was
solved in 50 μl methanol/water. 5 μl of the sample was applied
on a Restek biphenyl column 150*3 mm 2.7 μl and separated
with a water-methanol gradient containing 0.1% acetic acid
and 2 mmol ammonium formate. Eluent A was containing 100%
water and eluent B 100% methanol. The column was first flushed
with 10% eluent B for 0.5 min. Thereafter, as a linear gradient,
the percentage of eluent B was increased in a first step to 40% at
2.5 min, in a second step to 90% B after 5.5 min and held until 8.5
min. After 9 minutes the eluent contained 10% B again until the
method ended at 10 minutes. The flow decreased from 0.35 ml/
min to 0.2 ml/min after 9 minutes. The method target analytes
were accredited according to DIN EN ISO 17025 regulations.
Detection of drugs in oral fluid: The samples were collected
with the oral fluid collection system (Greiner Bio One GmbH,
Kremsmunster, Austria). The particular advantage of this kit is
the active stimulation of salivary flow by a sampling fluid which
itself is an aqueous solution containing citric acid and the ternary
dye tartrazine, buffered to pH 4.2. During our investigation the
probands rinsed their mouth with the sampling fluid for a period
of one to two minutes. After spitting it out into a collection cup,
the sample was transferred to evacuated tubes where sodium
azide was added as a preservative. Since the sampling fluid was part of the sample, the proportion of saliva was determined in the
laboratory by photometry. Because of the frequent occurrence
of very viscous and sometimes slimy samples, extraction via a
solid phase appeared more suitable here than a liquid/liquid
extraction. The selected solid phase, Isolute HCX, 300 mg (Biotage,
Uppsala, Sweden), contained two components for the retention
of neutral and slightly basic substances. The solid phase was first
conditioned with 1 mL of methanol and equilibrated to pH 4 with
1 mL ammonium formate buffer (380 mg/L with 0.01% formic
acid). 1 mL sample was added with deuterated standards (LGC
and Lipomed) and diluted with 1 mL ammonium formate buffer
in 2 mL Eppendorf tubes, mixed and then centrifuged (5 min,
14000 rpm). The solid phase was loaded with the sample, which
is slowly forced through the column bed by overpressure (UTC,
Positive Pressure Manifold, up to 800 kPa, 0.5 mL/min). This was
followed by two washes with 1 mL of ammonium formate buffer
and 3 mL of a 1:1 mixture of methanol and ammonium formate
buffer. The column bed was dried with high nitrogen flow for 5
min. The analytes were extracted from the solid phase by 1 mL
of methanol with 5% ammonia (Merck, 25 %, for analysis). The
extract was evaporated to dryness at 40 °C and gentle nitrogen
flow and then taken up with 100 μL of a mixture of ammonium
formate buffer and MeOH (60:40) and centrifuged in 1.5 mL
reaction rubes (5 min, 14000 rpm). Part of the extract was used
for analysis and the remainder is stored in the refrigerator in
order to be able to carry out a reinjection in case of any possible
carry-over. 5 μL were injected into the LC/MSMS instrument.
All analytes were measured by liquid chromatography (Agilent,
1260 Infinity II) coupled tandem mass spectrometry (Agilent,
6470 A). The analytes were separated by a gradient starting with
95% of an aqueous ammonium formate solution (380 mg/L, 0.01% formic acid) to 100% of acetonitrile (Carl Roth, HPLC degree)
with 0.01% formic acid over 10 min on an analytical separation
column (Agilent, Zorbax Eclipse Plus C18, 100 mm × 2.1 mm ×
1.8 μm). The molecules were ionized by electrospray ionization
(ESI) in positive mode. For this purpose, the parameters of the ESI
source were optimized for the ionization of THC. At least three
MS/MS transitions were recorded.
The method target analytes were accredited according to DIN EN
ISO 17025 regulations.
Detection of drugs in capillary blood: The capillary blood samples
were collected from the finger pad of ring or middle finger.
Prior to the finger prick the finger was wiped with a disinfectant
solution containing ethanol. After that, 20 μl of sample were
taken twice each time using an EDTA coated Minivette® (Sarstedt,
Nümbrecht, Germany). The sample volume was subsequently
transferred into a 1.5 mL reaction vial and sent to the laboratory
via postal service. The sample arrived dried in most cases. The
residue was dissolved by 1 min vortexing with 220 μL acetonitrile
and 10 μL deuterated internal standard in methanol. Internal
standard concentrations were chosen to be 50% below cut
off concentration in whole blood. After centrifugation the
supernatant was transferred into a 96 well micro-titer plate
where 10 μL ethylene glycol has been previously added to each
cavity. Subsequently, evaporation was performed within 60 min
at 30°C with the plate positioned into a centrifugal evaporator
(Eppendorf AG, Hamburg). The remaining ethylene glycol was
solved with 80 μl water and 10 μl methanol. After vortexing the
plate 10 μl of the sample was injected into an ultraperformance
liquid chromatography-tandem mass spectrometry (UPLC-MS/
MS) system consisting of an UPLC I-Class connected to an Xevo TQ-XS (both Waters GmbH, Eschborn, Germany) operating in
selected reaction monitoring (SRM) and positive ionization
mode. Separation was conducted on an ACQUITY UPLC® BEH
Phenyl 1.7 μm, 2.1 mm x 100 mm column (Waters GmbH,
Eschborn, Germany) within 11-minute gradient elution, followed
by a 0.5-minute re-equilibration step. Mobile phase A consisted
of 20 mM ammonia formate with 0.1% formic acid and mobile
phase B was methanol with 0.1% formic acid. Three transitions
were recorded for all analytes and two transitions for the internal
standards. The method targets 65 analytes and were accredited
according to DIN EN ISO 15189 regulations.
Results
The results of the different matrices were separately compared for each analyte.
Table 1 shows a comparison of positive results for the three matrices over the 14 days of investigation. The number of positive results the first day and the used cut off was specified. Moreover, the numbers of patients who were positive the first day and negative at day three and the number of positive patients the last day were listed. If no patient was positive the last day, the day was specified when at a minimum one patient was positive for the analyte. Because of the high positive rates and long detection times for urine using the level of detection, the positive rates for a higher cut off were also investigated. The lower level of quantification of the German chemical toxicological investigation (Chemisch-Toxikologische Untersuchung, CTU) criteria of the medical psychological investigation program for recovering the driver's license after driving under drug influence (CTU criteria) [19] was used as an alternative urine cut off. In comparison to the LCMS/MS testing the popular enzyme immunoassay was evaluated. The EMIT drug tests by Siemens have been used with the manufactures recommended cut offs.
The results for THC or THC-COOH, respectively, regarding urine with LCMS/MS and a 10 ng/ml cut off, enzyme immunoassay (EIA) and capillary blood were similar the first 3 days. After 14 days the positive rates in urine were higher, even with EIA, than in the other matrices. The detection rates and time in oral fluid were lower than for the other matrices. The last positive result in oral fluid was detected after three days. The S/P-ratio for THC is 0.03, so this result was expected [20].
Cocaine or its metabolite benzoylecgonine show comparable detection times and rates for all the matrices. The highest positive rates were found for urine if the Limit of Detection (LOD) was applied. 6 of the 18 positive patients who were positive on the first day were even positive for benzoylecgonine after 14 days. The S/P-ratio for cocaine is 1, so the findings were plausible [20].
23 patients were morphine positive the first day in all matrices. Positive morphine results the last day in urine and capillary blood could be found. The number of positive patients after 3 and more day was lower for oral fluid, which can be explained by the S/Pratio of 7 for morphine. The S/P-ratio for codeine is also 7 which matches similar positive rates seen for codeine [20].
For 6-MAM and acetylcodeine the highest number of positive results was observed in oral fluid, for 6-MAM also the longest time of detection.
The number of patients positive for amphetamine in oral fluid was comparable to the number of patients positive in urine with a 50 ng/ml cut off. This also applied to the detection time. In capillary blood and urine without a cut off used, there were patients positive after 14 days. As the S/P-ratio of amphetamine is nearly 7 [20] a longer detection time in oral fluid was expected.
Diazepam metabolites had the highest positive rates and longest detection times in urine, for oxazepam and temezapam even if a 50 ng/ml cut off was used. Nordazepam appeared similar in all matrices. Just on the first day the positive rate was lower for oral fluid. Diazepam was comparable on the first day for all matrices. However, it had the highest number of positive results in oral fluid. The S/P ratio is 0.02 so this result was surprising [20].
Clonazepam or its metabolite had a good correlation between all matrices. For urine, instead of clonazepam itself only the metabolite 7-amino-clonazepam was measured because it can be detected for a longer period of time. For temazepam urine seemed to be the most appropriate matrix for detection. In oral fluid temazepam was difficult to detect because only one patient was positive.
The figures not only show the number of positive samples for one matrix at the different days. They also show the correlation between the different matrices. Specifically, how many samples were positive for all matrices or only in two or one matrix, respectively? In the example of Figure 1 at day 14, 3 samples were positive for urine and 2 for capillary blood, but only one of the samples was positive for both matrices. Over all, four samples were positive.
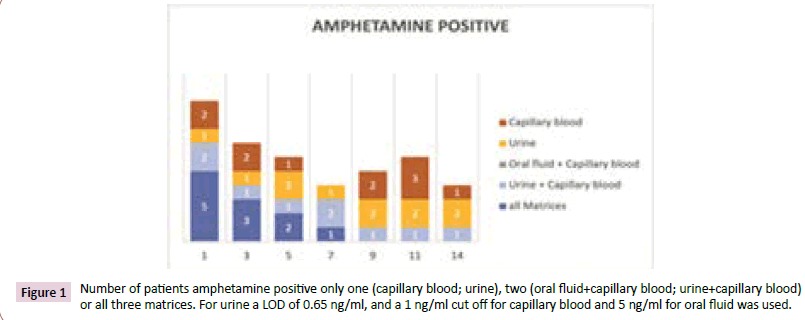
Figure 1: Number of patients amphetamine positive only one (capillary blood; urine), two (oral fluid+capillary blood; urine+capillary blood) or all three matrices. For urine a LOD of 0.65 ng/ml, and a 1 ng/ml cut off for capillary blood and 5 ng/ml for oral fluid was used.
Amphetamines
Figures 1 and 2 the best correlation between the matrices was observed during the first days. After 9 days, urine samples investigated with a cut off 50 ng/ml no longer registered as positive and only capillary blood samples were positive. It was astonishing to us that the number of positive capillary blood samples increased from day 9 to day 11. However, implausible results were measured in capillary blood for one patient on day 9 and two other patients on day 11. These three patients were only positive on that respective day and only in capillary blood, not in urine or oral fluid.
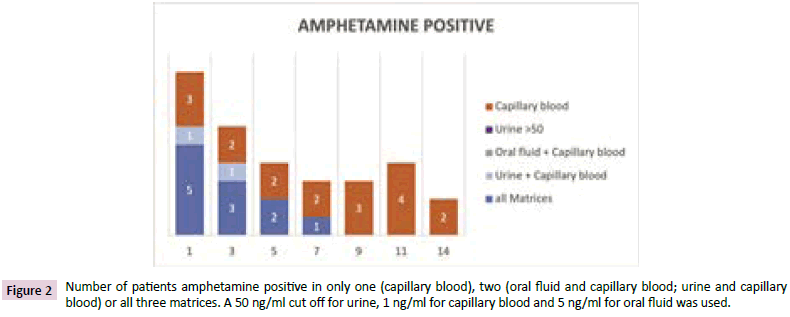
Figure 2: Number of patients amphetamine positive in only one (capillary blood), two (oral fluid and capillary blood; urine and capillary blood) or all three matrices. A 50 ng/ml cut off for urine, 1 ng/ml for capillary blood and 5 ng/ml for oral fluid was used.
Cannabis
Figure 3 the number of positive cannabis (THC or THC-COOH) results was less for oral fluid than for the other matrices. None of the patients was positive only in oral fluid the first five days. At day seven one patient showed a high THC concentration in oral fluid even after he was negative at day five. This patient showed decreasing THC-COOH concentrations on day seven compared to day five in urine. Some patients were positive in capillary blood and urine but after seven days most of the cannabis positive patients had only a positive result in urine. After 14 days 10 of the 14 positive patients from the first day were positive in urine, only one in capillary blood. For half of the urine positive patients concentrations >10 ng/ml were measured.
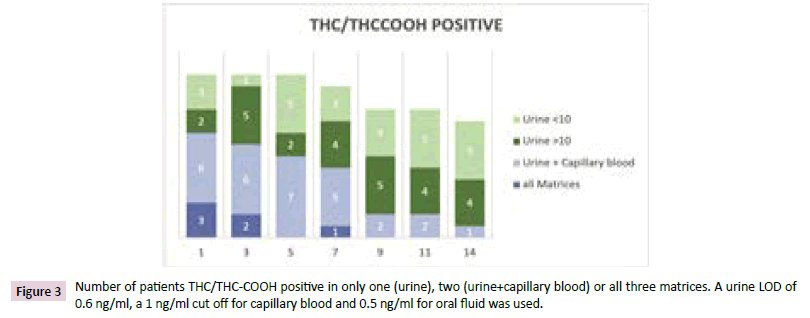
Figure 3: Number of patients THC/THC-COOH positive in only one (urine), two (urine+capillary blood) or all three matrices. A urine LOD of 0.6 ng/ml, a 1 ng/ml cut off for capillary blood and 0.5 ng/ml for oral fluid was used.
Morphine
Figures 4 and 5 all 23 morphine positive patients meeting the criteria for the study were positive in all three matrices on the first day (Figure 4). The third day 22 patients were urine positive, 13 of them in all matrices, 9 in capillary blood and urine and one in oral fluid and urine. After 7 days two patients had positive results in all matrices, 13 in capillary blood and urine, and 7 only in urine. In total, 22 of the 23 positive patients from day 1 were positive in at least one matrix. At the 9th day one patient was only positive in oral fluid and capillary blood, respectively, 17 in urine only. Even after 14 days 14 of the patients showed a positive result in one [11] or two matrices [3]. The number of patients positive in urine and oral fluid decreased over the investigated time. In capillary blood the number of positive patients increased from the 9th to the 14th day from three to six. That meant patients were positive again after they were negative the days before. For most of the capillary blood positive patient’s only morphine and no morphine glucuronide was found. A positive result after a negative one the days before normally was a hint for a relapse. By contrast, the results in urine showed that this was not the case. Three of the patients were only positive in capillary blood.
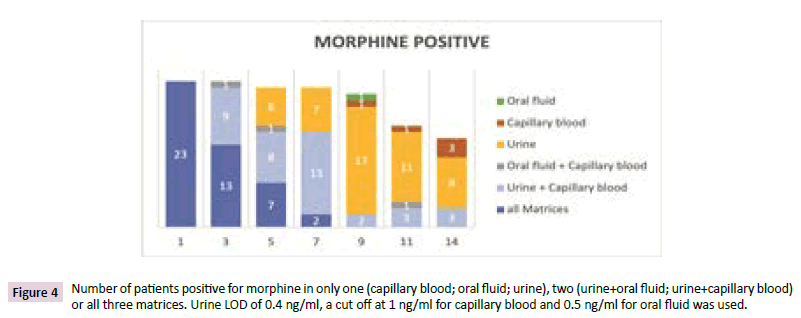
Figure 4: Number of patients positive for morphine in only one (capillary blood; oral fluid; urine), two (urine+oral fluid; urine+capillary blood) or all three matrices. Urine LOD of 0.4 ng/ml, a cut off at 1 ng/ml for capillary blood and 0.5 ng/ml for oral fluid was used.
Figure 5 shows the results when urine cut off 25 ng/ml was used. The first three days were quite similar to the results without cut off. The number of patients with positive urine results decreased much faster. The last patient positive in oral fluid was detected on day 9. After 11 and 14 days some patients were only positive in capillary blood. As mentioned before, it was amazing that the positive capillary blood samples increased from day 9 to 14.
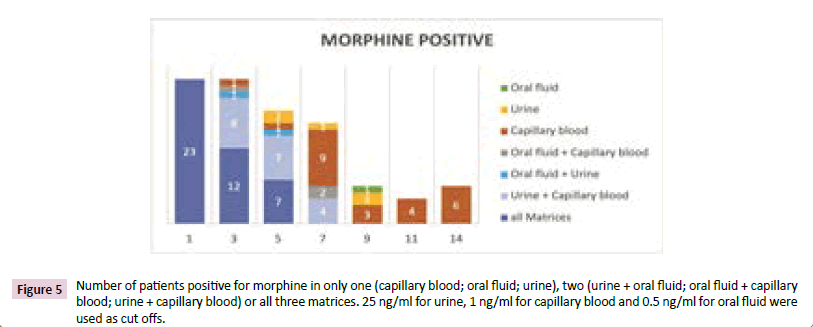
Figure 5: Number of patients positive for morphine in only one (capillary blood; oral fluid; urine), two (urine + oral fluid; oral fluid + capillary blood; urine + capillary blood) or all three matrices. 25 ng/ml for urine, 1 ng/ml for capillary blood and 0.5 ng/ml for oral fluid were used as cut offs.
6-MAM
Figure 6 at the first day 25 patients were measured 6-MAM positive in at least one matrix. All 25 patients were positive in oral fluid, 19 in urine and 9 in capillary blood. At the 5th day patients were only positive in oral fluid and capillary blood but only one patient in both matrices. Amazingly, one patient was capillary blood positive only that day and only in capillary blood. On day 7, three patients showed positive results in oral fluid and one in capillary blood. Two of the oral fluid positive patients from day 1 were negative at day 5.
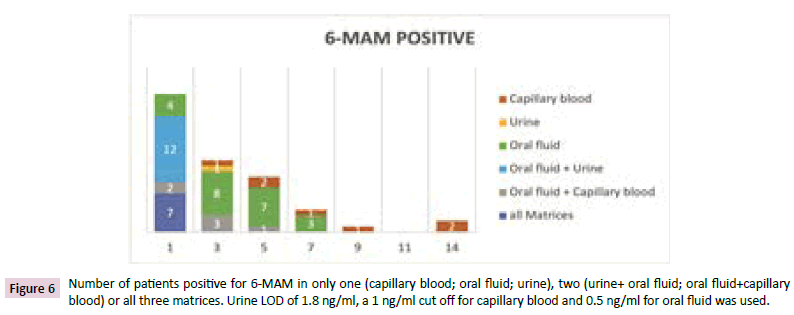
Figure 6: Number of patients positive for 6-MAM in only one (capillary blood; oral fluid; urine), two (urine+ oral fluid; oral fluid+capillary blood) or all three matrices. Urine LOD of 1.8 ng/ml, a 1 ng/ml cut off for capillary blood and 0.5 ng/ml for oral fluid was used.
After 9 days one patient was positive only in capillary blood. But this patient was negative at day 5 and 7. No patient was positive for 6-MAM in any matrix on the 11th day but 2 patients were positive at day 14 in capillary blood. One of them was never 6-MAM positive in capillary blood before, only in oral fluid until day 7.
Acetylcodeine
The street-heroin marker acetylcodeine was only positive the first day. One patient was positive in all matrices, 9 in oral fluid and urine, and 5 in oral fluid only and one only in urine.
Codeine
Codeine was only positive for patients with higher morphine concentrations and an impurity of the heroin used by the patients. The codeine concentrations found were quite low. Oral fluid and urine at a cut off at 25 ng/ml have nearly the same positive rates and the last positive patient result after three days. The positive urine samples after 7 and more days showed concentrations less than 1.1 ng/ml. Only in capillary blood patients showed codeine concentrations between 2 and 12 ng/ml after 14 days, though the concentrations were lower or negative at day 9 and 11.
Diazepam
Figure 7 in figure 7, the number of positive results of diazepam or one of its metabolites is shown. Patients rated as positive if diazepam or one of its metabolites nordiazepam, oxazepam or temazepam was positive. The first 7 days most of the positive patients were positive in all three matrices. The time of detection was longer in urine and capillary blood than in oral fluid. Even in oral fluid, diazepam or nordiazepam was measurable with 5 of the 10 positive patients. 8 of these patients were positive in capillary blood and all of them in urine. The target analytes for oral fluid were diazepam and nordiazepam, whereas oxazepam and temazepam were positive for one patient each. The number of positive patients was also lower for capillary blood for oxazepam and temazepam in comparison to diazepam and nordiazepam. Only in urine the number of positive patients was similar for all metabolites but lower for diazepam.
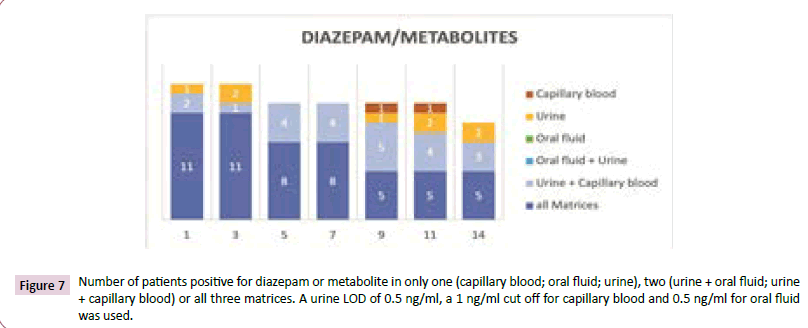
Figure 7: Number of patients positive for diazepam or metabolite in only one (capillary blood; oral fluid; urine), two (urine + oral fluid; urine + capillary blood) or all three matrices. A urine LOD of 0.5 ng/ml, a 1 ng/ml cut off for capillary blood and 0.5 ng/ml for oral fluid was used.
Clonazepam
Figure 8 the confirmation of clonazepam intake was carried out measuring clonazepam in oral fluid and capillary blood and its metabolite 7-aminoclonazepam in urine. Clonazepam itself can be found in urine but was not measured in this study. Two patients were clonazepam or metabolite positive in all three matrices for seven days. The last positive patient was found after 11 days in urine. This patient was positive in urine and capillary blood at the 9th day and positive in all matrices at day seven. The time of detection for most patients was longer in urine than for capillary blood, which had longer detection times than oral fluid.
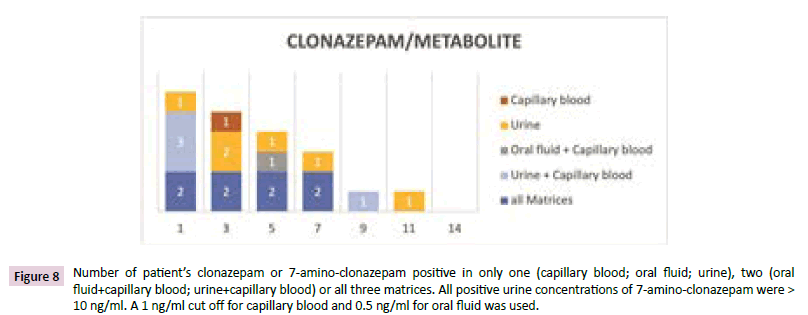
Figure 8: Number of patientâ??s clonazepam or 7-amino-clonazepam positive in only one (capillary blood; oral fluid; urine), two (oral fluid+capillary blood; urine+capillary blood) or all three matrices. All positive urine concentrations of 7-amino-clonazepam were > 10 ng/ml. A 1 ng/ml cut off for capillary blood and 0.5 ng/ml for oral fluid was used.
Cocaine
Figures 9-11 in urine, only the cocaine metabolite benzoylecgonine was detected because cocaine was only detectable in urine a short time after consumption. Both analytes measured in oral fluid and capillary blood. Further cocaine metabolites were not measured.
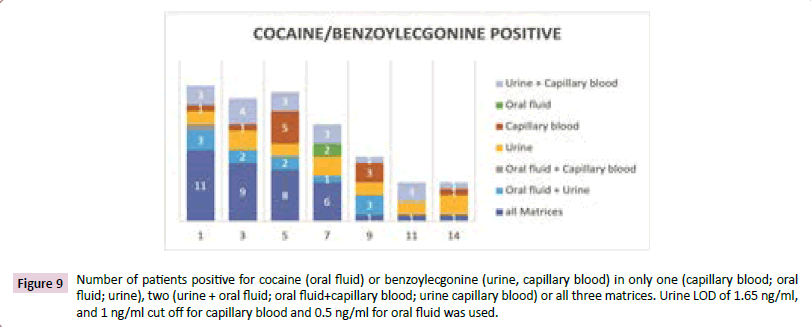
Figure 9: Number of patients positive for cocaine (oral fluid) or benzoylecgonine (urine, capillary blood) in only one (capillary blood; oral fluid; urine), two (urine + oral fluid; oral fluid+capillary blood; urine capillary blood) or all three matrices. Urine LOD of 1.65 ng/ml, and 1 ng/ml cut off for capillary blood and 0.5 ng/ml for oral fluid was used.
In Figures 9 and 10 the number of positive patients is illustrated for urine at the limit of detection and with a cut off at 35 ng/ ml (CTU criteria). During the first week of investigation most of the cocaine positive patients were positive in three or two matrices. The patients who were positive in urine only, had benzoylecgonine concentrations lower than 10 ng/ml aside from one patient at days 11 and 14.
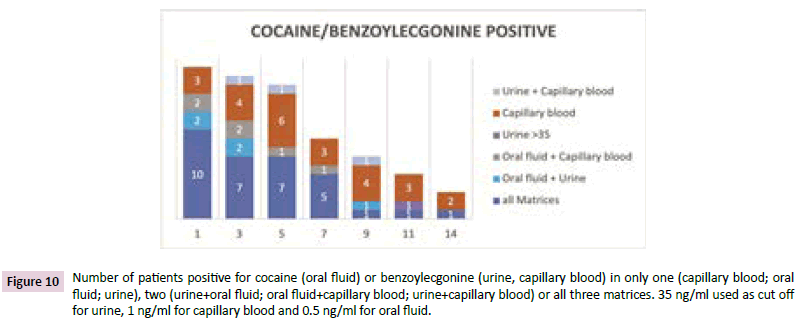
Figure 10: Number of patients positive for cocaine (oral fluid) or benzoylecgonine (urine, capillary blood) in only one (capillary blood; oral fluid; urine), two (urine+oral fluid; oral fluid+capillary blood; urine+capillary blood) or all three matrices. 35 ng/ml used as cut off for urine, 1 ng/ml for capillary blood and 0.5 ng/ml for oral fluid.
Two patients at the 7th day were only positive in oral fluid with a concentration of approx. 0.5 ng/ml of cocaine. The patients with positive results for capillary blood showed concentrations between 1.2 and 8 ng/ml of cocaine or benzoylecgonine, respectively. Some of these patients were cocaine negative on one day and positive again some days later. For example one patient was capillary blood positive for benzoylecgonin at a concentration of approx. 5 ng/ml at day 5 and showed benzoylecgonine and cocaine positive results at 20 ng/ml benzoylecgonine and 7.5 ng/cocaine, while cocaine was negative before. The other matrices showed no increase of the concentration of cocaine or benzoylecgonine. At day five there were more positive patients than on day 3 because a patient was negative in all matrices at day 3 and positive for benzoylecgonine only in capillary blood on day 5 (Figure 9).
Figure 11 shows an example for a relapse of patient consuming cocaine. The concentration of cocaine or its metabolite increased for all matrices at the 7th day. In urine the concentration also rose on day 9 whereas the concentrations in the other matrices decreased at day 9.
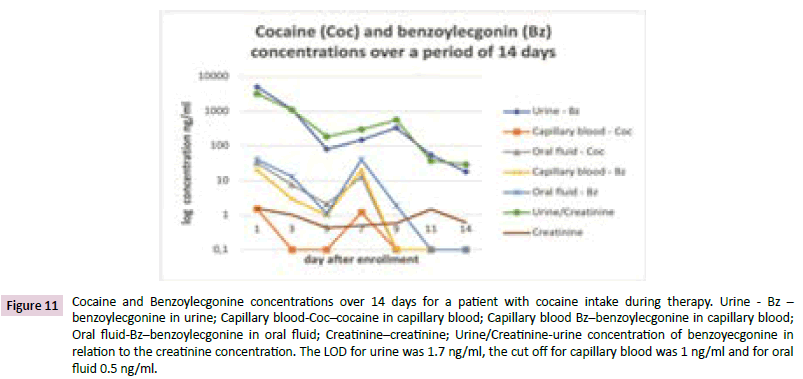
Figure 11: Cocaine and Benzoylecgonine concentrations over 14 days for a patient with cocaine intake during therapy. Urine - Bz â?? benzoylecgonine in urine; Capillary blood-Cocâ??cocaine in capillary blood; Capillary blood Bzâ??benzoylecgonine in capillary blood; Oral fluid-Bzâ??benzoylecgonine in oral fluid; Creatinineâ??creatinine; Urine/Creatinine-urine concentration of benzoyecgonine in relation to the creatinine concentration. The LOD for urine was 1.7 ng/ml, the cut off for capillary blood was 1 ng/ml and for oral fluid 0.5 ng/ml.
Discussion
The performed comparative measurements show that no
procedure has only advantages. More often, the optimal choice of matrix rather depends on the question to investigate. Some
possible questions which influence the selection of matrix are the
detection time, the substance and the way of sample collection.
If heroin is the target analyte, oral fluid shows the best results
and longest detection times. However, for benzodiazepines and
THC urine should be preferred.
Urine collection is not invasive. However, urine is also prone
to manipulation attempts in various forms. For example, the
samples may be swapped for substance-free specimen, diluted
or contaminated with chemical agents to present as 'clean'.
And even though these attempts mostly prove ineffective in
the end, they force investigators to include additional analytical
steps. Sample substitution may be detected using either direct
observation or, more reliably, using urine markers [3]. The latter
even prove effective considering volume of fluid intake, alcohol consumption or urine flow [21]. Chemical manipulation also
proves detectable [22]. Still, countering manipulation attempts is
costly and time-consuming. The necessary manipulation checks
impede the process though. Either direct observation or a marker
such as the Ruma® marker with subsequent manipulation testing
has to be used. Both procedures do not provide 100% security
against manipulation. However, the marker additionally helps to
detect sample substitution. During the course of our investigation
we detected two results for one patient that indicated swapped
samples, day 1 and 3, using the Ruma® Marker-System. Another
additional implausible urine result that did not contain any
marker was also detected. For oral fluid and capillary blood there
are significantly less options to manipulate. The influence of the
pH value in oral fluid on drug secretion can be avoided by using
a collection system that uses a buffered solution to rinse the
mouth.
Supervision of oral fluid collection is less invasive than for urine.
However, the matrix oral fluid itself has proven to be a challenge
for investigators as a vast number of factors influences the
production of oral fluid which, in turn, may also have varying
effects on the investigated substances. For example, a number
of collection systems use acidic media for stimulation and thus
alter the pH value of the sample [23,24]. At this time it has not
been conclusively determined which effect any chosen collection
system may have on the quality of the respective samples.
Furthermore, preserving agents or buffer solutions may also have
different effects on different substances. And of course, factors
regarding the individual test subjects such as metabolism, grade
of hydration or form of drug use also have to be considered.
And lastly, the amount of oral fluid in the collected sample is not
constant, so it has to be measured if quantification is needed.
Also, the amylase has to be detected for verification that the
sample contains oral fluid. This entails additional work and costs
for the laboratory. Drawing capillary blood requires close contact
between staff and patient which may be unpleasant at times
for both parties involved. Capillary blood is composed of blood
and tissue fluid to varying degrees, so for exact quantification
the detection of the hematocrit value is discussed. Furthermore,
mechanical stimulation of the extraction site should be avoided as
it increases the amount of tissue fluid in the sample. Educational
materials on clinical chemistry cite a margin of error in volume
of up to 15% [25]. Instead, a hyperemic ointment may be used
to improve blood flow. However, contamination cannot be
excluded [26].
On the analytical side urine has the advantage of higher
drug concentrations compared to the other matrices, so the
requirements on analytical devices are lower. A time-consuming
factor is that samples have to be hydrolyzed before analysis
because of several glucuronides. Some benzodiazepines, THCcarbonic
acid and opiates and opioids form glucuronides. Matrix
effects are a problem when using Electrospray Ionization (ESI)
for MS. Oral fluid is the matrix with the lowest matrix effects
because it contains less interfering substances like phospholipids,
proteins or salts. Consequently, matrix effects on LCMS/MS are
less frequent for oral fluid than for capillary blood and urine..
That makes sample preparation easier and the chromatograms
are more clearly structured compared to the other matrices.
But some samples are of mucous consistence which may be
difficult to handle. In addition to low concentrations and several
interfering substances like proteins, phospholipids and others,
capillary blood has the smallest sample volume. If only one
capillary of blood is drawn, as is usually the case, there is not
enough material to perform a second analysis if the first fail.
However, many analytes present the longest detection periods
for urine, in particular when the detection limits of a LCMS/
MS method is used as basis for the decision between negative
and positive. It depends on the question of drug testing. For an
addiction therapy the detection time in urine is quite long. The
level of quantification the CTU criteria require for abstinence
testing is mostly suitable but for analytes like morphine or
oxazepam a higher cut off is proposed. An overview of the results
is shown in Table 2. On the first day the highest number of positive
samples was found for urine with the exception of 6-MAM and
acetylcodeine which were more often positive in oral fluid.
The decrease of positive results from day 1 to day 3 is mostly
higher in oral fluid.
The longest detection times (last positive) or the highest number
of positive samples after 13/14 days, respectively, was found in
urine, except 6-MAM and codeine, which were detected longer
in oral fluid (6-MAM) and capillary blood (codeine). For example,
5 and 4 instead of 11 patients were still positive for THC-COOH in
urine after 14 days at cut off at 10 or 20 ng/ml. In capillary blood
and oral fluid the detection period for cannabis was at maximum
9 days. For some diazepam metabolites approx. 50% of the
patients were also still positive after 14 days. Our investigation
shows that the detection windows in oral fluid are distinctly
shorter for many analytes. They are, to some extent, comparable
to urine if a cut off between 50 and 100 ng/ml is used. Well
liposoluble analytes such as cannabis and some benzodiazepines
such as oxazepam and temazepam present distinctly shorter
detection windows in oral fluid even with these parameters. To
verify heroine consumption through the metabolite 6-MAM, oral
fluid appears to be the most suitable matrix with the longest
detection period and the highest positive rates on the first day
which is quite consistent with the results of Vindenes et al. [27].
Capillary blood often showed long detection windows comparable
to urine. However, implausible results were found more often.
Patients were positive again at the end of the study after testing
negative for these analytes over several days before and negative
results in the other matrices. Also, during the investigation period
occasional positive results, e.g. for amphetamine, were found
only in capillary blood although nothing suggests intermediate
consumption. For one patient, cocaine use during therapy was
verified in oral fluid and urine by showing strongly increasing
concentrations. For capillary blood the patient was above the
measuring range during the entire investigation period.
The positive results in capillary blood that cannot be explained
by intermediate consumption were found for cocaine, opiates,
6-MAM, THC and amphetamine. Two implausible amphetamine
positive patients did not specify using amphetamines before.
Such results could not be observed for benzodiazepines which
are taken orally. It appears that the contamination of the skin cannot be removed entirely even by cleaning the finger pad with
alcohol prior to sample collection. An analytical contamination is
improbable as we verified that the respective samples that had
been injected into the LCMS immediately before the implausible
samples were processed were negative or so low that a carryover
could be excluded. The concentrations in urine are even higher
than in capillary blood, so carryover as a reason for implausible
results should be higher for urine. But the opposite was the
case. A contamination of the skin due to contamination of the
clothes might be possible. But the implausible result for 6-MAM
can´t be explained by the hypothesis above because 6-MAM is
produced in the body out of heroin. A residual amount of the
drug in one of the upper dermal layers could be an explanation.
Implausible drug testing results in capillary blood were found by
different authors. During the investigation of finger prints for
drugs Costa et al. [28] found a false positive rate of 2.5% with
cocaine. Ismail et al. [29] observed positive results with nondrug
users of 13% for cocaine, 5% for benzoylecgonine and 1%
for 6-MAM. Being wrongly suspected of current drug use could
have far reaching consequences for the test subject including
but not limited to exclusion from further therapy in the ward,
loss of probation privileges and or trust in addiction treatment.
Further investigation should be performed to determine whether
capillary blood sample collection from the lobe of the ear might
provide fewer false results.
Conclusion
The test methods are not only suitable for drug of abuse control
during therapy. They also could be used for instance in workplace
testing, traffic control, the penal system, probationary services
and abstinence monitoring. The sample collection is non-invasive
or microinvasive because only low sample volumes are necessary.
Urine is the best choice if a longer detection time for a wide range
of analytes is wanted. Oral fluid and capillary blood can easily be
taken in roadside testing because no toilet or medical personal
is required. Oral liquid has short detection times for THC and
some benzodiazepines but for some indications this might be
no issue. Capillary blood showed longer detection times than
oral fluid for most analytes. But the sample volume is so low
that a verification analysis of a sample in a laboratory is not
possible. Another issue is that isolated implausible results can
occur. None of the matrices allows a suitable inference to
serum concentrations.
Consent and Ethical Approval
As per university standard guideline participant consent and
ethical approval has been collected and preserved by the authors.
Funding
Equipment and materials were provided by the participating
laboratories for the purposes of this study. The urine marker
substances used in this study were provided by Ruma GmbH free
of charge.
Conflict of Interest
None to declare
REFERENCES
- Hawks RL, Chiang CN (1986) Urine Testing for Drugs of Abuse. NIDA Research Monograph 73.
Indexed at, Google Scholar
- Moeller KE, Lee KC, Kissack JC (2008) Urine drug screening: practical guide for clinicians. Mayo Clin Proc 83: 66-76.
Indexed at, Google Scholar, Cross Ref
- Scholer A (2004) The effect of urine manipulation on substance abuse testing. ToxChem und KrimTech 71: 127-137.
Indexed at, Google Scholar, Cross Ref
- Baum K, Schüler-Springorum M, Huppertz B (2018) Process Reliability and Psychological Stress in Urine Sample Collection for Drug Testing: A Pilot Study. J Appl Life Sci Int 19: 1-12.
Google Scholar, Cross Ref
- Verstraete AG (2004) Detection times of drugs of abuse in blood, urine, and oral fluid. Ther Drug Monit 26: 200-205.
Indexed at, Google Scholar, Cross Ref
- Moeller MR, Steinmeyer S, Kraemer T (1998) Determination of drugs of abuse in blood. J Chromatogr B Biomed Sci Appl 713: 91-109.
Indexed at, Google Scholar, Cross Ref
- Schramm W, Smith RH, Craig PA, Kidwell DA (1992) Drugs of abuse in saliva: a review. J Anal Toxicol 16: 1-9.
Indexed at, Google Scholar, Cross Ref
- Dolan K, Rouen D, Kimber J (2004) An overview of the use of urine, hair, sweat and saliva to detect drug use. Drug Alcohol Rev. 23: 213-17.
Indexed at, Google Scholar, Cross Ref
- Sadones N, Capiau S, De Kesel PM, Lambert WE, Stove CP, et al. (2014) Spot them in the spot: analysis of abused substances using dried blood spots. Bioanalysis. 6: 2211-27.
Indexed at, Google Scholar, Cross Ref
- Quraishi R, Jain R, Ambekar A (2013) The use of dried Blood Spot Samples in Screening Drugs of Abuse. Pharmacology and Pharm 4(2): 152-59.
Indexed at, Google Scholar, Cross Ref
- Velghe S, De Troyer R, Stove C (2018) Dried blood spots in therapeutic drug monitoring and toxicology. Expert Opin Drug Metab Toxicol 14: 1-3.
Indexed at, Google Scholar, Cross Ref
- Ellefsen KN, da Costa JL, Concheiro M, Anizan S, Barnes AJ, et al. (2015) Cocaine and metabolite concentrations in DBS and venous blood after controlled intravenous cocaine administration. Bioanalysis 7: 2041-56.
Indexed at, Google Scholar, Cross Ref
- De Kesel PM, Sadones N, Capiau S, Lambert WE, Stove CP, et al. (2013) Hemato-critical issues in quantitative analysis of dried blood spots: challenges and solutions. Bioanalysis 5: 2023-2041.
Indexed at, Google Scholar, Cross Ref
- Daousani C, Karalis V, Malenović A, Dotsikas Y (2019) Hematocrit effect on dried blood spots in adults: a computational study and theoretical considerations. Scand J Clin Lab Invest 79(5): 325-333.
Indexed at, Google Scholar, Cross Ref
- Spiehler V, Baldwin D, Hand C (2000) Cut-Off Concentrations for Drugs of Abuse in Saliva for DUI, DWI or Other Driving-Related Crimes. Probl of Forensic Sci 42: 160-168.
Google Scholar
- Dawes C, Jenkins GN (1964) The effects of different Stimuli on the Composition of Saliva in Men. J Physiol 170: 86-100.
Indexed at, Google Scholar, Cross Ref
- Aps JK, Martens LC (2005) Review: The physiology of saliva and transfer of drugs into saliva. Forensic Sci Int 150(2-3): 119-131.
Indexed at, Google Scholar, Cross Ref
- Huppertz B, Gauchel G, Feiertag H, Schweizer H, Krieger H, et al. (2004) Urine labeling with orally applied marker substances in drug substitution therapy. Clin Chem Lab Med 42(6): 621-626.
Indexed at, Google Scholar, Cross Ref
- Musshoff F (2014) Urteilsbildung in der Fahreignungsbegutachtung - Beurteilungskriterien. Z für Verkehrssicherheit 60: 33-37.
Google Scholar
- Langel K, Gjerde H, Favretto D, Lillsunde P, Oiestad EL, et al. (2016) Comparison of drug concentrations between whole blood and oral fluid. Drug Test Anal. 6: 461-471.
Indexed at, Google Scholar, Cross Ref
- Baum K, Einwachter S, Bibl M, Huppertz B (2018) Urine-kinetics of low molecular polyethylene glycols following an oral capsule ingestion. J Appl Life Sci Int 15: 1-6.
Google Scholar, Cross Ref
- Huppertz B, Bartling C, Baum K (2018) Adulteration of urine samples, discovery and mitigation. J Appl Life Sci Int 16: 1-8.
Indexed at, Google Scholar, Cross Ref
- Crouch DJ (2005) Oral fluid collection: the neglected variable in oral fluid testing. Forensic Sci Int 150: 165-173.
Indexed at, Google Scholar, Cross Ref
- Kato K, Hillsgrove M, Weinhold L, Gorelick DA, Darwin WD, et al. (1993) Cocaine and metabolite excretion in saliva under stimulated and nonstimulated conditions. J Anal Toxicol 17: 338-341.
Indexed at, Google Scholar, Cross Ref
- Müller K, Müller S (2022) Original -Prüfungsfragen mit Kommentar GK 2. Klinische Chemie, 15th ed. Stuttgart: Georg Thieme Verl.
- Zavorsky GS, Cao J, Mayo NE, Gabbay R, Murias JM, et al. (2007) Arterial versus capillary blood gases: a meta-analysis. Respir Physiol Neurobiol 155(3): 268-279.
Indexed at, Google Scholar, Cross Ref
- Vindenes V, Enger A, Nordal K, Johansen U, Christophersen A, et al. (2015) Very long Detection Times after High and repeated intake of Heroin and Methadone, measured in Oral Fluid. Scand J Forensic Sci 20: 34-41.
Google Scholar, Cross Ref
- Costa C, Webb R, Palitsin V, Ismail M, de Puit M, et al. (2017) Rapid, Secure Drug Testing Using Fingerprint Development and Paper Spray Mass Spectrometry. Clin Chem 63(11): 1745-52.
Indexed at, Google Scholar, Cross Ref
- Ismail M, Stevenson D, Costa C, Webb R, de Puit M, et al. (2018) Noninvasive Detection of Cocaine and Heroin Use with Single Fingerprints: Determination of an Environmental Cutoff. Clin Chem 64(6): 909-17.
Indexed at, Google Scholar, Cross Ref
Citation: Huppertz B, Bottcher M, Lierheimer S, Gottwald P, Bleicher S (2022) Comparative LCMS/MS Drug Analysis of paired Urine, Oral Fluid and Capillary Blood Samples in Addiction Therapy. Ann Clin Lab Res. Vol.10 No.6:416


