Research Article - (2023) Volume 15, Issue 3
Design and Evaluation of Artocarpus heterophyllus Incorporated Herbal Effervescent Granules
Yash Shah1*,
Chiragi Patel2,
Tanvi Kachhiya3,
Subhashchandra Patel4 and
DR. Tejal Gandhi5
1Research Scholar, Anand Pharmacy College, Anand, Gujarat, India
Research Scholars, Anand Pharmacy College, Anand, Gujarat, India
2Research Scholars, Anand Pharmacy College, Anand, Gujarat, India
3Associate Professor, Department of Pharmacognosy, Anand Pharmacy College, Anand, Gujarat, India
4Professor and Principal, Department of Pharmacology, Anand Pharmacy College, Anand, Gujarat, India
*Correspondence:
Yash Shah, Research Scholar, Anand Pharmacy College, Anand, Gujarat,
India,
Tel: 9157809430,
Email:
Received: 01-May-2023, Manuscript No. ijddr-23-13735;
Editor assigned: 04-May-2023, Pre QC No. P-13735;
Reviewed: 18-May-2023, QC No. Q-13735;
Revised: 22-May-2023, Manuscript No. R-13735;
Published:
29-May-2023
Abstract
The jackfruit, or Artocarpus heterophyllus Lam., is a tropical climacteric fruit that is a member of the Moraceae family. The jackfruit is full of nutrients; some of the phytochemicals are proanthocyanidin, flavonoids, and artemisinin. The jack fruits, leaves, and bark, have been extensively utilized in traditional medicine because of their anticarcinogenic, antiinflammatory, and hypoglycemic benefits. The present study was undertaken to formulate and evaluate the effervescent granules content of Artocarpus heterophyllus extract. Three batches of effervescent granules were prepared from which batch II was found to give good flow properties. The phytochemicals found in jackfruit extract were proanthocyanidin, flavonoids, polyphenols, and the creation of a new solvent system for thin-layer chromatography of methanolic (jackfruit) extract. Methanolic extract of jackfruit shows an Rf value of 0.38 by using a 70:30 ratio of Acetone to n-hexane. FTIR and UV spectroscopy and several post-formulation tests were used to identify the primary ingredient present in both extract and effervescent granules. The results revealed that the extract has the highest concentration of proanthocyanidin, flavonoids, and phenolic components, and the λmax was found to be at 278nm. Moreover, FTIR studies revealed that the extract from Artocarpus heterophyllous has no chemical interactions with the other substances.
Keywords
Artocarpus heterophyllus; Effervescent granules; Citric:
tartaric: sodium bicarbonate (1:2:4); Methanolic extract
INTRODUCTION
The mulberry family (Moraceae) tree species known
as Artocarpus heterophyllus is also known as Jackfruit.
Originally from the western ghats of India and Malaysia, it
can also be found in central and eastern Africa, southeastern
Asia, the Caribbean, Florida, Brazil, Australia, and a lot of
the Pacific islands. Morin, dihydromorin, cyanomacurin,
artocarpin, isoartocarpin, cycloartocarpin, artocarpesin,
oxydihydroartocarpesin, flavonoid, proanthocyanins
norartocarpetin, cycloartenon, and artocarpenon are
just a few of the Flavones that make up the Artocarpus
heterophyllus. It also has fatty acids, glycosides, free sugar
(sucrose), and some essential amino acids like arginine,
cysteine, and histidine. Artocarpus heterophyllus has various
medicinal components, including its flowers, leaves,
fruit, and seeds [1]. Anti-diabetic, antioxidant, antiinflammatory,
antibacterial, immunomodulatory, and
antifungal are among the various pharmacological effects.
The exterior rind of jackfruit is composed of hexagonal,
bluntly conical carpel apices that cover a thick, rubbery,
and whitish to yellowish wall and has a color ranging from
green to yellow-brown. Each seed is surrounded by flesh
with an acidic and sweet banana flavor. A central fibrous
core holds the heavy fruit together. Fruits are 30-40
centimeters in length and have an oblong shape. The seeds
are round, light brown, 2-3 cm long, 1-1.5 cm wide, and
covered in a thin, whitish membrane. Each fruit can have
up to 500 seeds. Seeds can be stored for up to a month
in cool, humid conditions because they are resistant.
Effervescent jackfruit extract granules have been created
and tested in this. Increasing the drug's absorption and
lowering hyperglycemia are the primary objectives. In
addition, it increases effervescent granule absorption and
patient compliance [2] (Fig. 1.).
Figure 1: (a) Jackfruit (b) Jackfruit
rags (c) Jackfruit seeds (d)
Jackfruit powder.
MATERIAL AND METHODS
Fruit authentication: The fruit was authenticated by the
Anand pharmacy college after being collected from the
local market in the Anand district. Aunthentification no:
APC/2023/07.
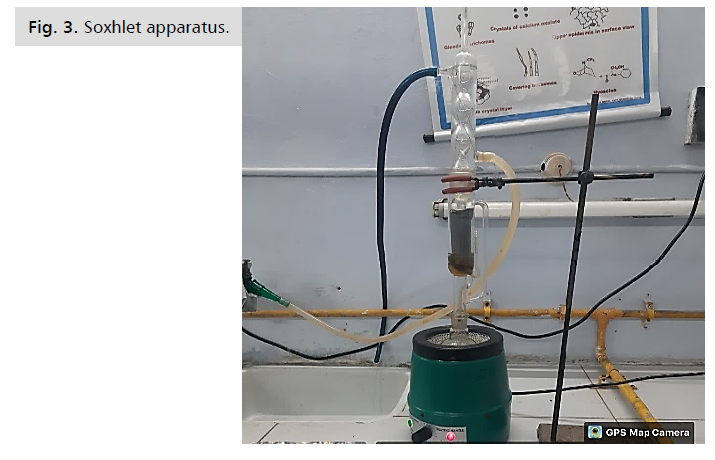
Extraction of fruits: The fruit was first dried in the sun
to make dried powder, and then 40 grams of the powder
were treated with petroleum ether to defat it as part of the
extraction process. The powder was then extracted for a
further 24 hours at room temperature using the Soxhlet
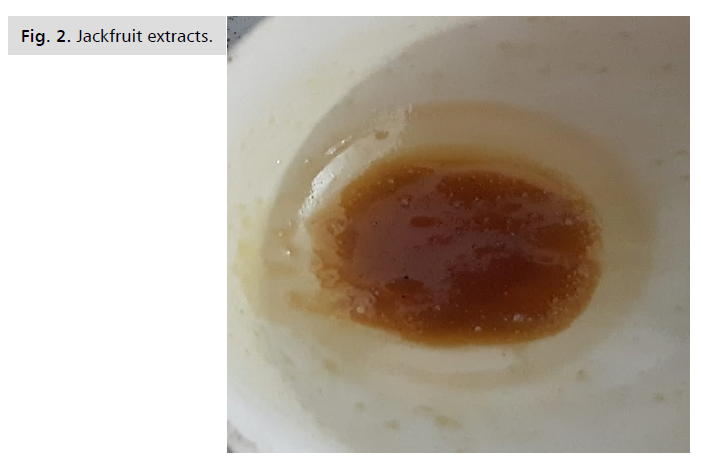
method [3] (Fig. 2,3.).
Figure 2: Jackfruit extracts.
Figure 3: Soxhlet apparatus.
PRELIMINARY PHYTOCHEMICAL
ANALYSIS
Chemical Test: Identification of flavonoids, alkaloids, and
tannins: Flavonoids, alkaloids, and tannins were identified
using the tube test technique and the proper reagents for
each type of component being tested.
Utilizing ammonia vapor reagents, flavonoids are
examined Alkaloid compounds are found using the Mayer
reagent, which is then used to determine whether or not
precipitation occurred [4].
By examining the color of the reaction product, the FeCl3
reactor is used to test for polyphenols (tannins)
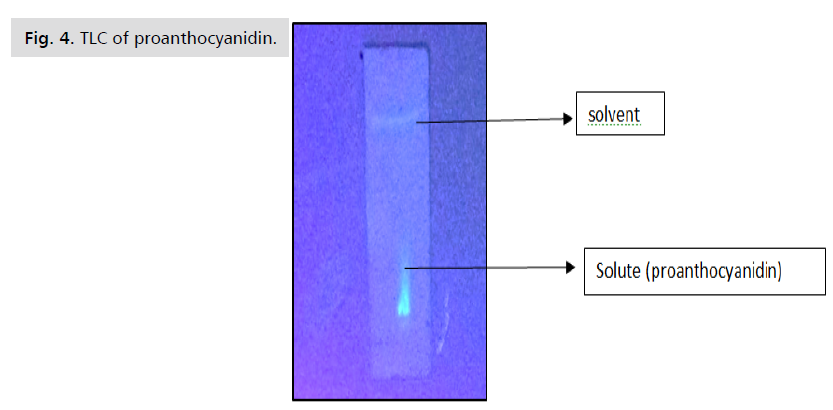
TLC: TLC plates that had been previously coated with
0.25mm layers of silica gel 60 F254 were used for TLC.
After extract application, the plates were developed to a
thickness of 19 cm in paper-lined chambers, which had
all been given at least 30 minutes to acclimatize. Acetonen-
hexane was employed in two mobile stages for this
experiment. By using a UV chamber, flavonoids, and
polyphenols may be seen. And 0.38 was discovered to be
the Rf value [5] (Fig. 4.).
Figure 4: TLC of proanthocyanidin.
STANDARD CALLIBRATION CURVE (UVANALYSIS)
The spectroscopy of photons in the UV-visible range is
connected to ultraviolet-visible spectrophotometry, or UVVis.
The visible spectrum or its nearby wavelengths are used
in UV-visible spectroscopy. The absorption in the visible
ranges is directly influenced by the color of the substances
involved. In various portions of the electromagnetic
spectrum, molecules go through electronic transitions. The
spectrometer automatically scans each of the component
wavelengths during a brief period. The visible section is
often between 400 and 800 nm, whereas the ultraviolet
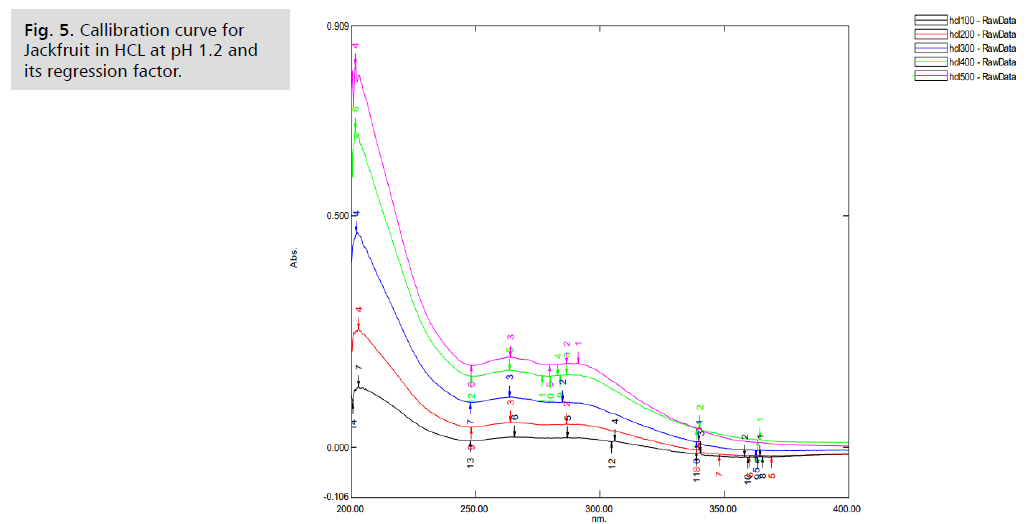
(UV) region is typically between 200 and 400 nm. A 100
ml volumetric flask containing 100 ml of methanol was
used to provide 100 μg of the Artocarpus heterophyllus'
methanolic extract. The solution's concentration was
then 1000 μg/ml [6]. Further dilution was performed
at volumes of 1 ml, 2 ml, 3 ml, 4 ml, and 5 ml, giving
concentrations of 100 μg/ml, 200 μg/ml, 300 μg/ml, 400
μg/ml, and 500 μg/ml, respectively. The extract was then
scanned in the UV-Visible spectrophotometer between
200 nm and 400 nm. The wavelength of the Lambda UV
spectrometer (Shimadzu, Japan) was adjusted in order to
determine the value of max, and the maximum absorbance
was calibrated using different blanks for each extract. After
inserting each sample solution, a wavelength between 400
and 200 nm was passed. It was noted what wavelength the
absorption was at its highest. The maximum is shown on a
plot of absorbance vs wavelength. The scanning graph and
associated absorbance values were recorded. The regression
factor for jackfruit in hcl ph. 1.2 was found to be 0.984
[7] (Fig. 5.).
Figure 5: Callibration curve for
Jackfruit in HCL at pH 1.2 and
its regression factor.
FORMULATION OF HERBAL EFFERVESCENT
GRANULES
The wet granulation technique was used to create
effervescent grains. All the components were weighed
in accordance with the recipe after being sieved with a
mesh size 10 sieves and dried in the oven for 30 minutes
beforehand. The combination was made from a semi-solid
extract of Artocarpus heterophyllus, tartaric acid, citric
acid, sodium bicarbonate, stevia, lactose, and PVP [8]. It was also sieved with a mesh size 10 and dried in a 50 °C
oven for 30 minutes. Dry granules are rescreened through
a sieve with a mesh size of 10. An airtight container was
used to pack the mixture. The resulting granules were
assessed. Colour, flavour, and taste are all examined as part
of the organoleptic assessment. Mainly three batches were
prepared from which batch II was found to give good post
formulation results. The formulation of granules can be
seen from below table [9] (Tab.1. and Fig.6.).
Figure 6: Effervescent granules.
Ingredients |
Batch I |
Batch II |
Batch III |
| Drug extract + lactose |
12 gm |
12 gm |
12 gm |
| Citric acid |
0.6 gm |
0.8 gm |
1 gm |
| Tartaric acid |
1.2 gm |
1.6 gm |
2 gm |
| Sodium bicarbonate |
2.4 gm |
3.2 gm |
4 gm |
| PVP K30 |
1.2 gm |
1.2 gm |
1.2 gm |
| Stevia |
0.8 gm |
2 gm |
2 gm |
| Lactose |
1.8 gm |
1 gm |
0 gm |
| Total |
20 gm |
21.8 gm |
22.2 gm |
Tab.1. Formulation of effervescent granules.
EVALUATION OF FORMULATED
HERBAL EFFERVESCENT GRANULES
Angle of repose: The angle of repose was measured
using the fixed funnel method. The angle of repose was
measured with a funnel. A funnel was secured above a
graph paper that was laid out horizontally on a flat surface
at a predetermined height (h). The mixture was carefully
poured through the funnel until the conical pile's apex just
touched the funnel's tip. The conical pile's base's radius was
measured. The following formula was used to determine
the angle of repose (θ):
Tan θ =h/r,
Where, θ = angle of repose, h is the height of the cone,
and r is the base's radius. If the angle of repose is ≤
30o, the material is usually free-flowing, while angles of
≥40o indicate poor flowing, 25-30 show excellent flow
properties, 31-35 show good flow properties, 36-40 show
fair flow properties, and 41-45 showing passable flow
properties [10].
Bulk density: 15 grams of powder mix are introduced
without compacting into a dry 100-milliliter cylinder.
Vo was read as the powder was levelled with care to avoid
compacting and the unsettled apparent volume. The
following formula was used to determine the bulk density:
ρb=M/Vo,
Where ρb is the apparent bulk density, M is the sample's
weight, and V is the powder's apparent volume [12].
Tapped density: The cylindrical container holding the
sample was struck 100 times after performing the steps
outlined in the determination of bulk density. The gap
between the subsequent measurement and the tapped
volume (Vf), which was measured to the closest graduated
unit, is less than 2%. The following method was used to determine the measured density in grams per millilitre.
ρt=M/Vf
Where ρt is the tapped density, M is the sample weight,
and Vf is the tapped volume of powder [13].
Carr’s index (%): A measurement of a powder's tendency
to be compacted is the compressibility index, also known
as Carr’s index. From the mass and tapped weights, it is
calculated. Theoretically, a substance is more flowable if
it is less deformable. It serves as a gauge for the relative
significance of particle interactions. Such interactions are
typically less important in a free-flowing powder, and the
values of the bulk and tapped densities will be closer. There
are commonly more particle contacts in poorly moving
materials, which results in a larger discrepancy between
the bulk and tapped densities. The Carr's Index, which
is determined using the following methods, reflects these
variations [14].
Carr’s index= [(ρt-ρb)/ ρt]/100
Where, ρb=bulk density, ρt=tapped density.
Hausner’s ratio: Hausner's ratio is a proximate indicator
of particle movement simplicity. The method used to
determine it is as follows.
Tapped density (t) / Bulk density (b) is known as Hausner's
Ratio.
Where b is the bulk density and t is the tapped density.
Hausner's ratios between 1.25 and 1.5 show middling
flow properties, while those over 1.5 show bad flow. Lower
Hausner's ratios (1.25) suggest better flow properties than
larger ones [15].
Determination of drug content: To determine the
percentage of drug content of Artocarpus heterophyllus
extract in the prepared granules, 600 mg of effervescent
granules were weighed, added to 250 ml of water, and
thoroughly mixed. The solution was then filtered and
analysed using a UV-visible spectrophotometer (UV 1800
shimadzo, Japan) at 278 nm. Each sample's drug content was calculated using the standard curve they had previously
created.
Fourier transforms infrared spectroscopy (FTIR)
study: The compatibility of the Artocarpus heterophyllus
extract with different excipients was examined using FTIR
spectroscopy. Using a disc of potassium bromate with
a wavelength of 4000-400 cm-1, the ftir spectra of the
extract, each component in the formula, and the chosen
formula were recorded [16].
RESULTS AND DISCUSSIONS
PHYTOCHEMICAL SCREENING
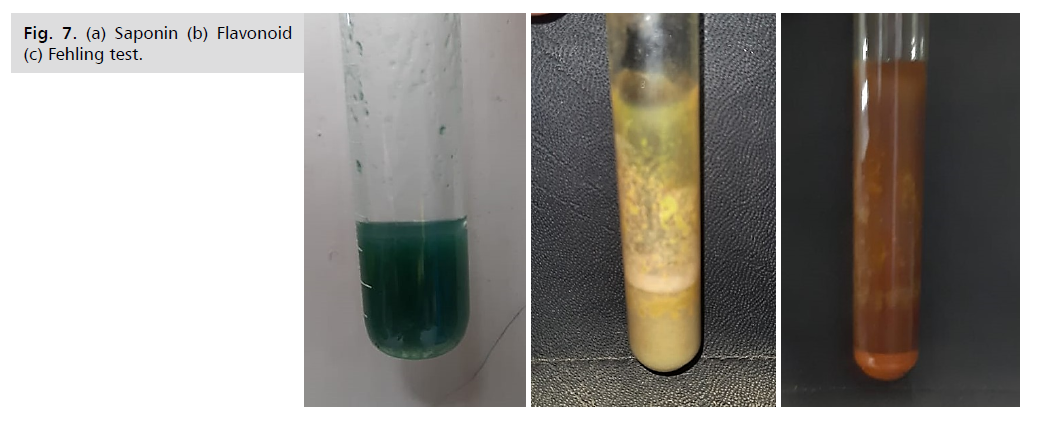
The phytochemicals present in the Artocarpus heterophyllus
are shown below in the (Tab. 2. and Fig. 7.).
Figure 7: (a) Saponin (b) Flavonoid
(c) Fehling test.
Test |
Petroleum ether extract |
Methanolic extract |
| Steroids (fats and oil) |
+ |
- |
| Saponin |
+ |
+ |
| Alkaloid |
- |
+ |
| Flavonoid |
- |
+ |
| Tannins |
- |
+ |
| Glycosides |
- |
+ |
| Amino acids |
- |
+ |
| Reducing sugar |
- |
+ |
| polyphenols |
- |
+ |
Tab. 2. Preliminary phytochemical test.
Post formulation studies and physical characteristics
of granules: After separation, the Methanolic extract
of Artocarpus heterophyllus yielded 21.6%w/w. Initial
chemistry analysis revealed the existence of flavonoids ,
glycosides, and tannins. All the three batches post formulation studies were conducted. The particles had
a distinctive odour and were dark green in appearance.
Batch II bulk density (b) and tapped density (tap) of the
grains were 0.466 and 0.539, respectively, while the angle
of repose was 25.83. Compressibility index (Carr's index)
reading of 15 and Hausner’s ratio of 1.15 demonstrate
the material’s flow good characteristics. Hence from three
batches mentioned below batch II was found to produce
good flow property [17] (Tab. 3.).
Sr.no |
Parameter |
Batch I |
Batch II |
Batch III |
| 1 |
Angle of Repose |
30.22+0.5 |
25.89+1.88 |
24.69+0.65 |
| 2 |
Bulk density |
0.472+0.0005 |
0.464+0.0015 |
0.479+0.0005 |
| 3 |
Tapped density |
0.561+0.005 |
0.539+0.0015 |
0.55+0.005 |
| 4 |
Carr, s index |
19 |
15 |
19 |
| 5 |
Hausner’s ratio |
1.18 |
1.15 |
1.19 |
| 6 |
Effervescent cessation time |
1-2 min |
1-2 min |
1-2 min |
| 7 |
Colour |
Olive green colour |
Olive green colour |
Olive green colour |
| 8 |
Odour |
Characteristic odour |
Characteristic odour |
Characteristic odour |
| 9 |
Appearance |
Amorphous granules |
Amorphous granules |
Amorphous granules |
Tab. 3. Physical evaluation of granules.
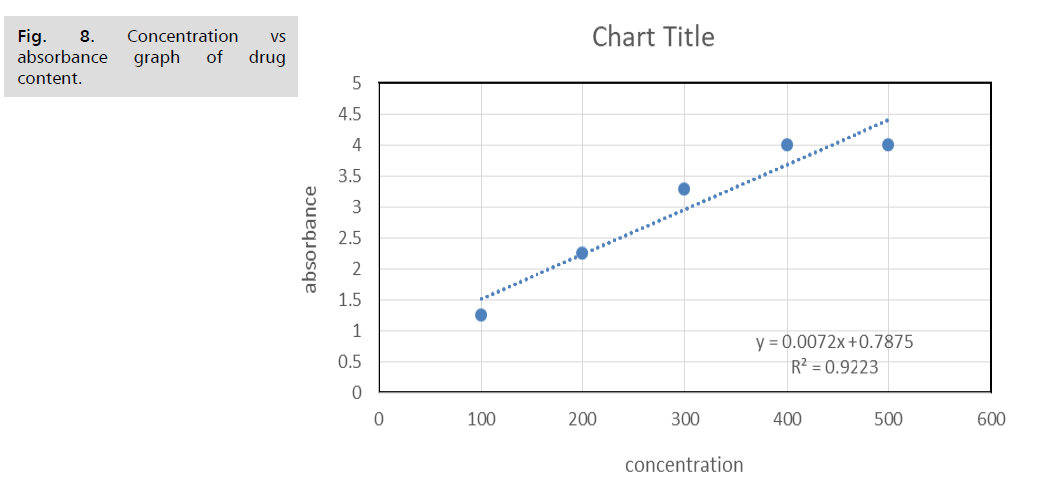
Determination of %drug content: Microsoft Excel
2019 was used to further gauge the drug content results.
The equation for the Artocarpus heterophyllus standard
calibration graph was taken into consideration. The highest
drug content was 95%, after which asymptotic equilibrium
was reached (Tab. 4. and Fig. 8.).
Figure 8: Concentration vs
absorbance graph of drug
content.
concentration |
absorbance |
µg/ml |
| 100 |
1.253 |
30.2122 |
| 200 |
2.255 |
53.8444 |
| 300 |
3.288 |
78.2075 |
| 400 |
4 |
95 |
| 500 |
4 |
95 |
Tab. 4. Drug content.
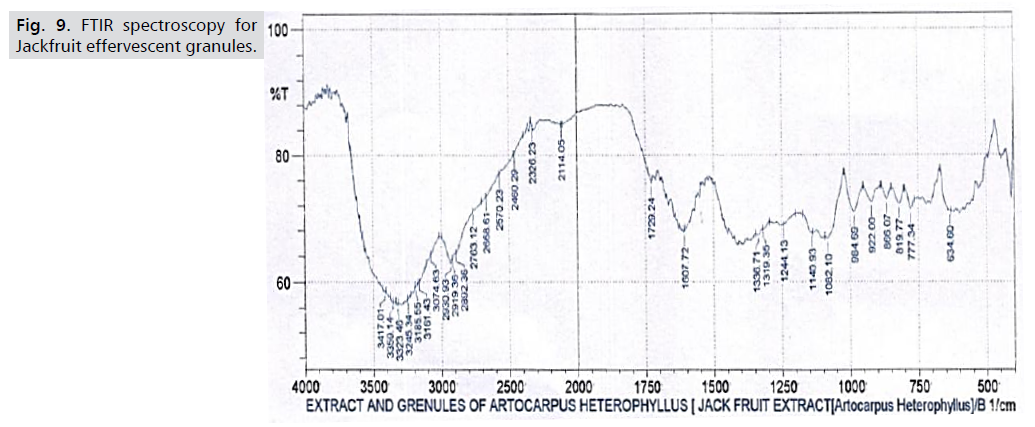
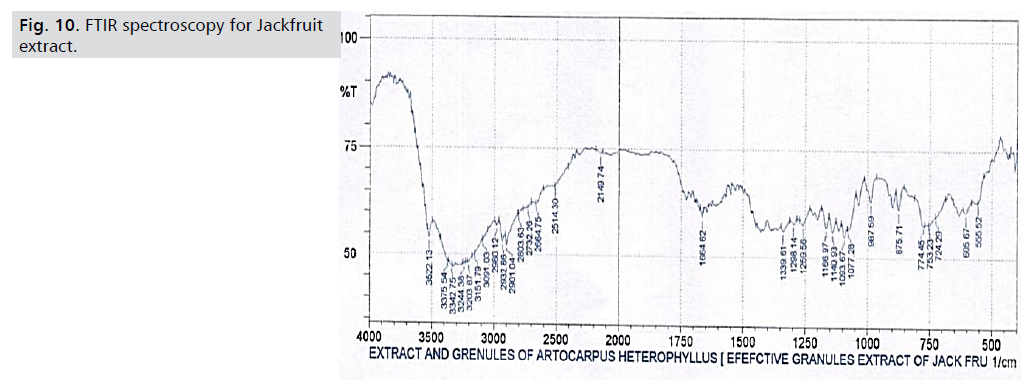
FTIR spectroscopy: Fig. 9 displays the findings of the FTIR
investigation. The peaks of the Artocarpus heterophyllous
extract are shown in Fig. 10, where strong bands for C-H,
C=C, O-H, and C-O are seen at 2919.36 cm-1, 1607.72 cm-
1, 1336.71 cm-1, and 1140.93 cm-1, respectively. The FTIR spectra of the granules from Artocarpus heterophyllus are
shown in Fig. 10. The outcome shows that the extract from
Artocarpus heterophyllous has no chemical interactions
with the other substances [18] (Tab. 5. and Fig. 9,10.).
Figure 9: FTIR spectroscopy for
Jackfruit effervescent granules.
Figure 10: FTIR spectroscopy for Jackfruit
extract.
Functional group |
Std wave number |
Extract (cm-1) |
Granules (cm-1) |
| C-H Stretching |
3350-3310 |
3323.46 |
3342.75 |
| C=C Stretching |
1670-1600 |
1607.72 |
1664.62 |
| O-H bending |
1390-1310 |
1336.71 |
1339.61 |
| C-O Stretching |
1205-1124 |
1140.93 |
1140.93 |
Tab. 5. FTIR spectroscopy.
Stability studies: After storage, no observable changes in
the granule's appearance were identified in stability tests
on the enhanced granule formulation (B2). The drug's content was found to be 94% after storage as opposed
to 95% before storage. The quantity of extract released
from the B2 before and after storage was 100% within 2
minutes during dissolving tests. There was no noticeable
difference in the average amount of extract released or the
drug content from B2 granules after being stored for three
months at 40oc/75% RH [19].
CONCLUSION
The present research focus on the formation and evaluation
of herbal effervescent granules, Different chemical
tests have been carried out to identify the component.
Additionally, TLC and UV analysis were used to confirm
the phytochemicals. A total of 3 batches of effervescent
granules have been made, with batch II showing good
flow characteristics. For its flow ability check, several
post-formulation investigations have been conducted.
Additionally, FTIR spectroscopy was used to identify
the functional group, and it was shown that there was
Fig. 10. FTIR spectroscopy for Jackfruit
extract.
no interaction between the extract and the effervescent
granules. The stability investigations for the three months
were completed last, and they revealed 94% drug content,
no color changes, and an effervescence period of two
minutes.
ACKNOWLEDGEMENT
Dr. Tejal R. Gandhi, Principal, Anand Pharmacy College,
Anand, is acknowledged by the writers for her unwavering
support and influence. Mr. Subhashchandra Patel, Dr
Vaishali Thakkar and Mr. Vimal Patel’s assisted in formula
creation and validation is also appreciated.
REFERENCES
- Prakash O, Kumar R, Mishra A, et al. Review Article Artocarpus heterophyllus. Jackfruit Rev Artic. 2009;6: 353-358.
Indexed at, Google Scholar, Crossref
- Bhatia BS, Siddapa GS, Lal G. Composition and nutritive value of jackfruit. Indian J Agric Sci. 1955;25: 303-306.
Indexed at, Google Scholar, Crossref
- Jagtap UB, Panaskar SN, Bapat VA. Evaluation of antioxidant capacity and phenol content in jackfruit (Artocarpus heterophyllus Lam.) fruit pulp. Plant Foods Hum Nutr. 2010;65: 99-104.
Indexed at, Google Scholar, Crossref
- Mishra A, Gupta R. General Guidelines for Methodologies on Research and Evaluation of Traditional Medicine. World Health Organization. 2000;3: 353-358.
Indexed at, Google Scholar, Crossref
- Grajang IB, Wahyuningsih I. Formulation of Sechium edule Extract Effervescent Granule with the Variation of Citric Acid, Tartrate Acid and Sodium Bicarbonate. Sci Technol Stud. 2019;9: 54-60.
Indexed at, Google Scholar, Crossref
- Mariana G, Claudia GT, Corina M, et al. Thin-layer chromatographic method for identifying vitamin c in fruits and drugs. J Liq Chromatogr Relat Tec. 2019;33: 239-244.
Indexed at, Google Scholar, Crossref
- Maleš Ž, Plazibat M, Vundać VB, et al. Thin-layer chromatographic analysis of flavonoids, phenolic acids, and amino acids in some Croatian Hypericum taxa. J Planar Chromatogr Mod. 2004;17: 280-285.
Indexed at, Google Scholar, Crossref
- Gunasekaran S. UV-VIS Spectroscopic Analysis of Blood Serum. Asian J Microbiolo Biotechnolo Environ Sci. 2003;5: 581-582.
Indexed at, Google Scholar, Crossref
- Saxena M, Saxena J. Evaluation of phytoconstituents of AcorusCalamus by FTIR and UV-VIS spectroscopic analysis. Int J Biolog & Pharmac Res. 2012;3: 498-501.
Indexed at, Google Scholar
- Palanisamy P. Formulation and Evaluation of Effervescent Tablets of Paracetamol. Ijprd. 2011;3: 76-104.
Google Scholar
- Jr A, Ansel H. Pharmaceutical Dosage Forms and Drug Delivery Systems. Am J Pharm Educ. 2001;70: 802-809.
Indexed at, Google Scholar
- Khandelwal KR. Practical Pharmacognosy. Nirali Prakashan. 2009;146-165.
Google Scholar
- Patel SS, Patel NM. Development of directly compressible co-processed excipient for dispersible tablets using 3 2 full factorial design. Int J Pharm Pharm Sci. 2009; 1: 125-148.
Indexed at, Google Scholar, Crossref
- Kokate CK. Practical Pharmacognosy. Nirali Prakashan. 2008;10-27.
Google Scholar
- James W, Aulton ME. Pharmaceutical preformulation: The physicochemical properties of drug substances. Pharmaceutics. 2006;2:113-138.
Google Scholar
- Senthil P, Suresh Kumar CH, Narasimha Raju, et al. Formulation and Evaluation of gastric oral floating tablet of glipzide. Int J Biol Pharm Res. 2010;1: 108-113.
Google Scholar
- Bhosale AV, Hardikar SR, Patil N, et al. Formulation and in vitro evaluation of microbially triggered ibuprofen. Int J PharmTech Res. 2009;1: 328-333.
Indexed at, Google Scholar
- Lachmann L, Liberman H, Kanig J. The theory and practice of industrial pharmacy. Verghese Publishing House. 1991; 320-321.
Indexed at, Google Scholar, Crossref
- Al-Mousawy J, Al-Hussainy Z, Alaayedi M. Formulation and Evaluation of effervescent granules of ibuprofen. Int J Appl Pharm. 2019;11: 66-69.
Indexed at, Google Scholar, Crossref


