Keywords
Vulnerability; Climate change; El Mex Bay; Rotifer; Physical-chemical pollution
Introduction
Plankton, because of their rapid response to ecosystem variability, their non-exploitation as commercial species and their amplification of subtle changes through non-linear processes, have been suggested to be indicators of climate variability (Taylor et al., 2002; Perry et al., 2004; Hays et al., 2005). Notably, the use of long-term plankton time-series can be a key tool to detect those changes (Perry et al., 2004; Alheit and Bakun, 2010; Mackas and Beaugrand, 2010).
The Mediterranean Sea (MS) is the largest quasi-enclosed sea on the Earth, its surface being similar to that of the largest semienclosed (e.g., the Gulf of Mexico) and open (e.g., the Caribbean Sea) marginal seas of the extant ocean (Meybeck et al., 2007). The MS’ size, location, morphology, and external forcing allow for a rich and complex physical dynamics that includes: i) unique thermohaline features, ii) distinctive multilayer circulation, iii) topographic gyres, and iv) meso-and sub-mesoscale activity. Nutrients and chlorophyll-a pools rank the basin as oligotrophic to ultraoligotrophic (Krom et al., 1991; Antoine et al., 1995). Oligotrophy seems to be mainly due to the very low concentration of inorganic phosphorus, which is assumed to limit primary production (Berland et al., 1980; Thingstad and Rassoulzadegan, 1995, 1999; Thingstad et al., 2005). Additional features of the MS are i) the decreasing west-east gradient in chl a concentration, as shown by color remote sensing (D’Ortenzio and Ribera d’Alcal´a, 2009; Barale et al., 2008) as well as by in situ data (Turley et al., 2000; Christaki et al., 2001), ii) a high diversity compared to its surface and volume (Bianchi and Morri, 2000), and iii) a relatively high number of bioprovinces (Longhurst, 2006), with boundary definition mostly based on the distribution of the benthos and the nekton (Bianchi, 2007). The MS is also a site of intense anthropic activity dating back to at least 5000 years BP, the impact of which on the marine environment has still to be clearly assessed and quantified. All these peculiar and contrasting characteristics should likely be reflected in the structure and dynamics of plankton communities.
Due to the several complains including the fishermen complains about the fishery decreasing in this area also, the vessels owners about the increasing of corrosion and the surrounding construction on the other hand, there are several problems on the public health of the bay surrounding peoples and declining the water quality of the bay including its odor and colour, the present work aims to examine the spatial and temporal variability in diversity of plankton and their relation to the environmental conditions changes. Also, Using GIS (ARCMAP 10) to produce maps illustrating the organism’s abundance and the prevailing environmental conditions. Determine which planktonic organisms can be used as bio-indicators on the prevailing environmental conditions. Finally, Planning prediction and recommendations to prevent the risks that threatening the environment.
Methodology
Study area
El-Mex Bay is located west of Alexandria City, Egypt at longitude 29º45' and 29º54' E and latitude 31º07' and 31º15' N, It extends for about 15 Km from Agami headland to the west to the Western Harbor to the east (Figure 1). The bay has a mean depth of 10 m. Its surface area is about 19.4 Km2, and its volume 190.3×10⁶ m3 (Said et al., 1991). The shoreline of El-Mex Bay is rocky with narrow sandy beaches. It receives a heavy load of wastewater (7×10⁹ m3/year) both directly from industrial outfalls (El- Umoum Drain) and indirectly from Lake Mariut via El- Mex Pumping Station (Mahmoud et al., 2009). El- Umoum Drain is mainly agricultural water. Lake Mariut also receives wastewater from the four sources in its eastern section, consisting of domestic, industrial and agricultural wastes; this liquid wastes discharged to the harbor via El-Mex Pumping Station.
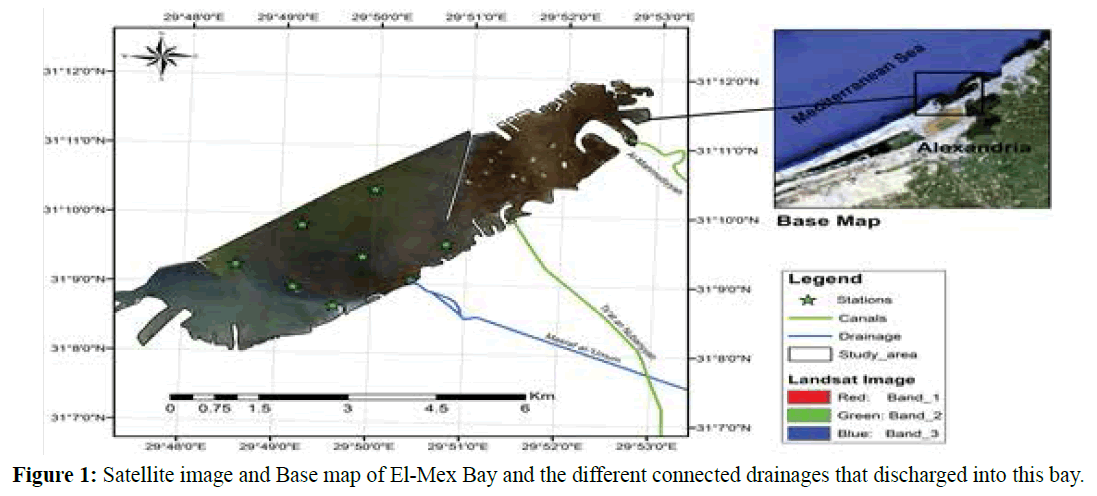
Figure 1: Satellite image and Base map of El-Mex Bay and the different connected drainages that discharged into this bay.
El-Mex Bay is located under stress condition due to the discharge of untreated domestic, industrial and agricultural effluents, beside the effect of ships movements from and to the harbors. Therefore, the condition at this bay is eutrophic and completely different from the open sea water. These are expected to continue and added to the climatic influence of increasing temperature and rising sea level in the future.
As a consequence of rapid population growth, industrial development, untreated or poorly treated industrial waste, domestic sewage, and agricultural runoff have moved to and from Mariut Lake south of the city and then released into the sea. This lake has also received a significant loading of agricultural runoff through canals and drains. El-Mex Bay subjected to severe environmental conditions.
Sampling
Samples were collected seasonally during a complete year cycle (from autumn 2011 to autumn 2012) at the selected stations. The stations will be selected to cover all possible climatic and environmental characteristics of the different parts of the study area. Eight stations were chosen in the El-Mex Bay for the present study, the locations of the sampling stations are shown in Figure 1. Samples were collected vertically by using standard plankton net (55 lm mesh size), lowered near the bottom and then pushed up to the water surface. The collected fauna which retained in the net were then transferred into small glass bottles and preserved in 5% neutralized formalin solution, and the sample volume was then adjusted to 100 ml. The samples were examined under a binocular research microscope.
The identification was undertaken to species levels. For the estimation of standing crop, sub samples of 5 ml were transferred to a counting chamber (Bogorov chamber) using a plunger pipette. This operation was performed three times, and the average of the three counts was taken. Rotifera were counted to species level, and the standing crop was calculated and estimated as organisms per cubic meter according to the following formula equation 1 (Santhanam and Srinivasan, 1994):
N=n ( v / V )*1000
Where; N: Total number of zooplankton per cubic meter. n: Average number of zooplankton in 1 ml of the sample. v: Volume of zooplankton concentrate (ml). V: Volume of total water filtered (L).
Additionally, at each station, water temperature was measured directly by usual thermometers, graduated to 0.1ºC, the pH values of the water samples were measured in the field by using a pocket digital pH meter (Oyster, inspected 82738, Extech instruments, Germany) and the salinity of water samples were measured by using Salino-meter by electrode (range 0-199.9 μm, 2-19.99 ms) model (Oyster, inspected 82738, Extech instruments, Germany). The phytoplankton biomass (Chlorophyll-a) was measured according to procedures described by Strickland and Parsons (1972) where sample filtered using Whatman GF/F filters (pore size 0.45 μm) then Chlorophyll- a is extracted by 90% acetone and measured at wavelengths (630, 645, and 665) this was done by using Spectrophotometer.
Photography of zooplankton species was done by using microscopic camera that replacement one eyepiece of binuclear microscope and connected to the computer.
Every single species was separated on glass slide with glycerin droplet and examine under binuclear microscope, some species that need anatomy for identifying their fifth legs “p5” such as copepods and the identification of the different species of zooplankton species was carried out according to Sars 1911 and 1918 (Copepoda), Rose 1933 (Mediterranean copepods), Tregouboff and Rose 1957 (Mediterranean plankton), Pontin 1978 (Freshwater plankton), Guerguess 1979, Hutchinson 1967 (Plankton as a general), Marshall 1969, Bick 1972, Paulmier 1997, Jörgensen 1924 (Protozoa), Gurney 1931, 1932, 1933 and Hardig and Smith 1960 (freshwater Copepoda), Wilson and Yeatman 1959, Edmondson 1959, Gurney, 1927 (Copepoda and Cladocera), Berzins 1960, Berzins and Pejler 1989 (Rotifera), Sars 1926 (Ostracoda) and Sars 1927, (Entomostraca).
Results and Discussion
There were 205 different zooplankton forms collected from El-Mex Bay belonging to 13 groups. Protozoa was the most diversified group 69 species and formed 34% of total zooplankton groups, followed by Copepoda, which was represented by 50 species in order to copepodite stages and nauplii that constituted 25%. Rotifera ranked the third diversified group formed 20 % and represented by 38 species besides their eggs and immature forms, Chordata represented by 9 forms while, Cnidaria, Mollusca and other Arthropoda represented by 6 forms for each one of them, Cypredina, Cladocera, and Annelida were represented by 12 forms, four to every single group. Two cirripedian forms and two Chaetognatha were recorded and finally one Porifera (Figure 2). Some zooplankton species among the collected samples considered good bio-indicators on the prevailing environmental conditions.
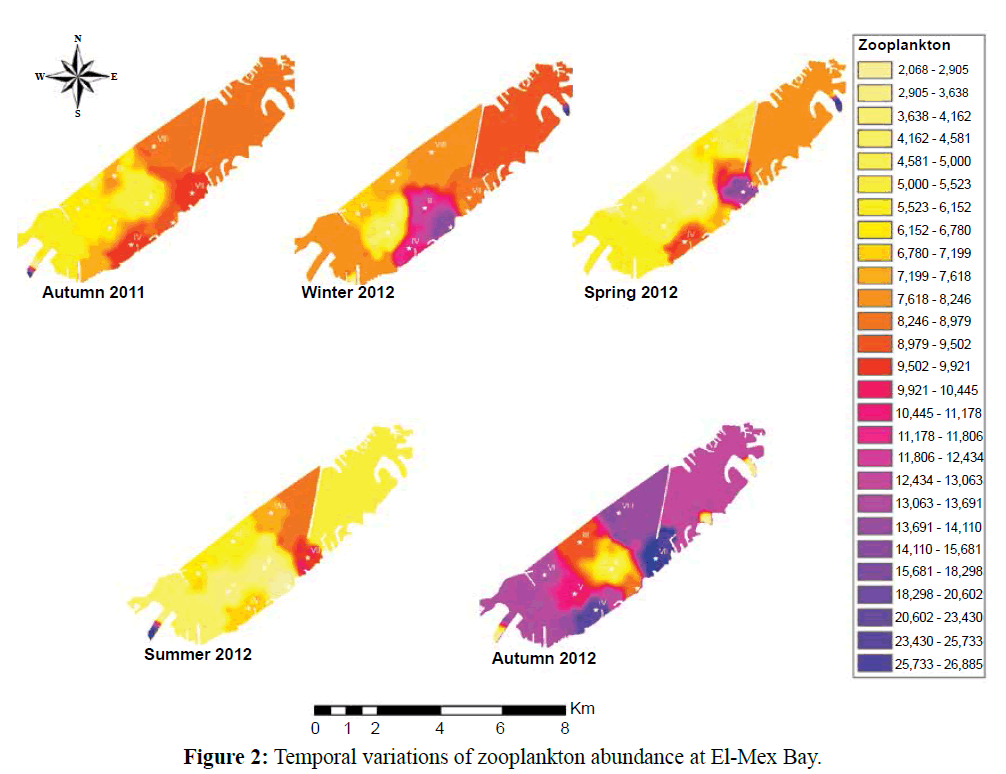
Figure 2: Temporal variations of zooplankton abundance at El-Mex Bay.
The ecological study of rotifer assemblages in different world regions indicated that some rotifers have the ability to exist in polluted waters and are considered as pollution bio-indicators, like Brachionus species and Polyarthra species (Klimowicz, 1961, Aboul Ezz et al.,1996, Abo-Taleb, 2010 and Abdel Aziz, et al., 2011), or serve as indicators of trophic nature of the environment (Arora, 1966). The presence of Brachionus species, Keratella cochlearis and Filinia species in any water body is an indicator of eutrophy (Pejler, 1957) while Filinia longiseta was considered among pollution indicators (El-Bassat, 1995). All the species mentioned above were found in El- Mex Bay during the present study, thus confirming their classification as highly eutrophic and polluted waters.
In this investigation there was a notice that, the presence of eutrophication problem was always synchronistic with the presence of high numbers of the genus Brachionus and at low concentrations of phytoplankton (represented by chlorophyll-a) the average counts of this organism were shrunk as mention in the following Table 1 and Figure 3.
| |
Autumn (2011) |
Winter (2012) |
Spring (2012) |
Summer (2012) |
Autumn (2012) |
| Chlorophyll-a |
7.50 |
9.06 |
8.82 |
34.38 |
29.92 |
| Average Brachionuscounts oganisms/m3 |
128 |
88 |
40 |
132 |
664 |
Table 1: The relation between Chlorophyll-a concentrations and average Brachionus counts.
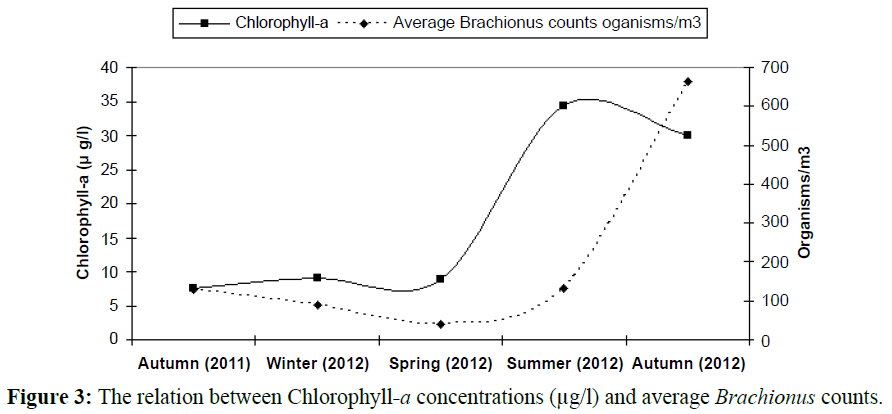
Figure 3: The relation between Chlorophyll-a concentrations (μg/l) and average Brachionus counts.
The genus Keratella cochlearis flourished at station I during autumn 2011 and winter 2012 (93 and 46 organisms/m3), this station receives an enormous amount of agriculture and urban drain from El-Umoum Drain carried with high concentrations of nutrient salts provided suitable conditions that enhanced the growth of phytoplankton biomass and prevailing eutrophic conditions, this confirmed by the high values of chlorophyll-a that recorded at this stations during this two seasons (36.9 and 25.7 μg/l).
Filinia longiseta recorded in the bay at two seasons, the first was the winter at station I in front of El-Umoum Drain, station VII at the gate of Western Harbor with total numbers were 93 and 85 organisms/m3 respectively, these two station showed the minimum salinity values during the whole sites and investigation period (6.2 and 7.8‰) and too dangerous acidic condition prevailing (pH 4.5 and 5.6) while the second season was the spring, this organism was also encountered at stations VII with total counts were 85 organisms/m3 during this season, the pH value at this station was slightly acidic (7.1). This confirms that these organisms can use as indicators of the presence of fresh water source (either sewage drainage or others) in any marine ecosystem.
Water temperature changing problem
The water temperature showed the classical seasonal fluctuations Known to the Egypt’s Mediterranean Coast (15-34ºC). The maximum value was reported in summer 2012 (32°C) and the smallest one in winter 2012 (14.2ºC) represented in Figure 4.
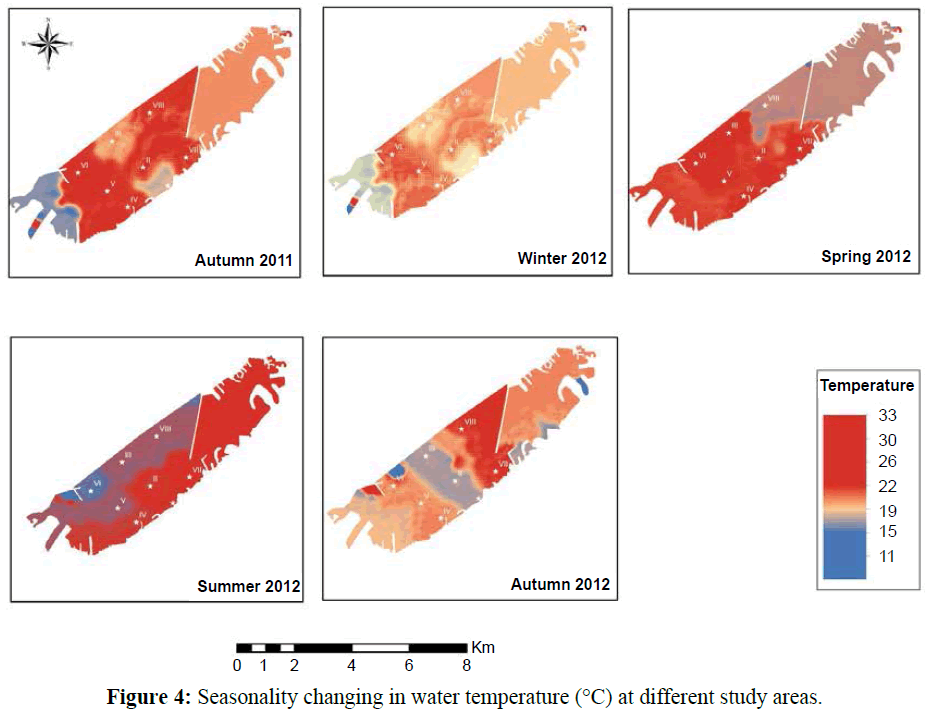
Figure 4: Seasonality changing in water temperature (°C) at different study areas.
In temperate regions generally, the temperature rising causes diversity of organisms to be lesser (Figures 5 and 6), except some groups which correlated directly with temperature increasing, the most common group in this case is rotifers which considered an indicator to pollution of marine environment and enhanced with temperature increasing as illustrated in Table 2 and Figures 7-9). In this study there was an only exception noticed during the winter season because the effect of another variable, salinity, which decreased in this season enhanced the rotifers growth which considered at the almost freshwater organisms, this was combined with the increasing of the drainage from El-Umoum Drain and the fresh water from runoff.
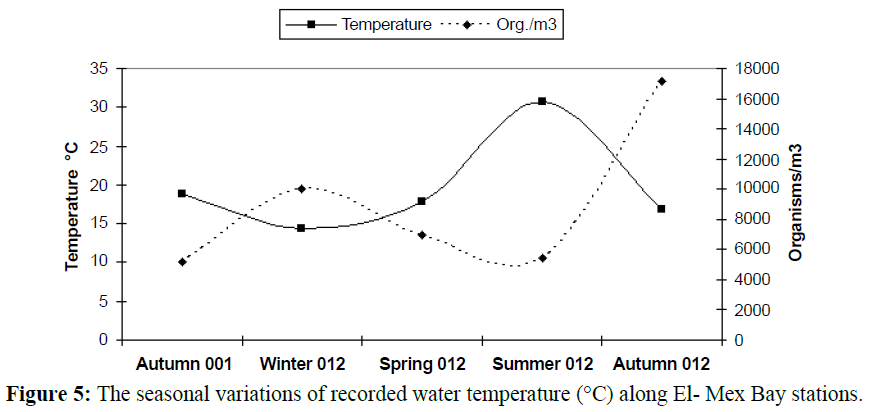
Figure 5: The seasonal variations of recorded water temperature (°C) along El- Mex Bay stations.
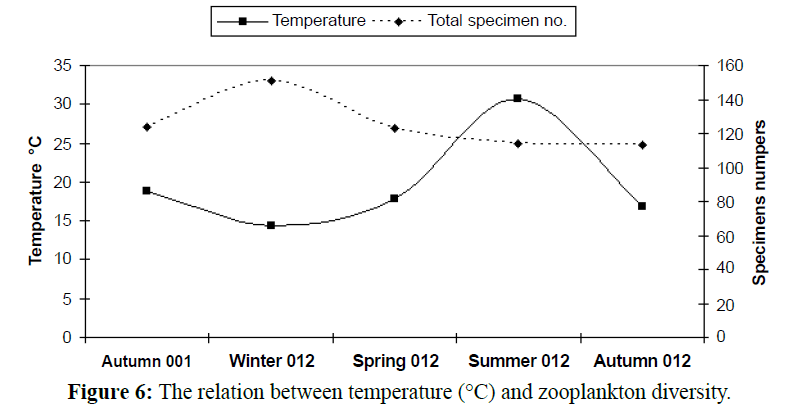
Figure 6: The relation between temperature (°C) and zooplankton diversity.
| Average |
Autumn 2011 |
Winter 2012 |
Spring 2012 |
Summer 2012 |
Autumn 2012 |
| Temperature |
18.75 |
14.39 |
17.89 |
30.68 |
16.88 |
| Salinity |
22.1 |
10.8 |
25.3 |
25.2 |
28.5 |
| Total Org./m3 |
5180 |
10011 |
6971 |
5401 |
17111 |
| Total specimen no. |
124 |
151 |
123 |
114 |
113 |
| RotiferaOrg./m3 |
434 |
1421 |
734 |
1445 |
1353 |
| Rotifer species No. |
19 |
34 |
17 |
21 |
13 |
Table 2: The seasonal variations of temperature (°C), salinity, zooplankton density, zooplankton diversity and roifer.
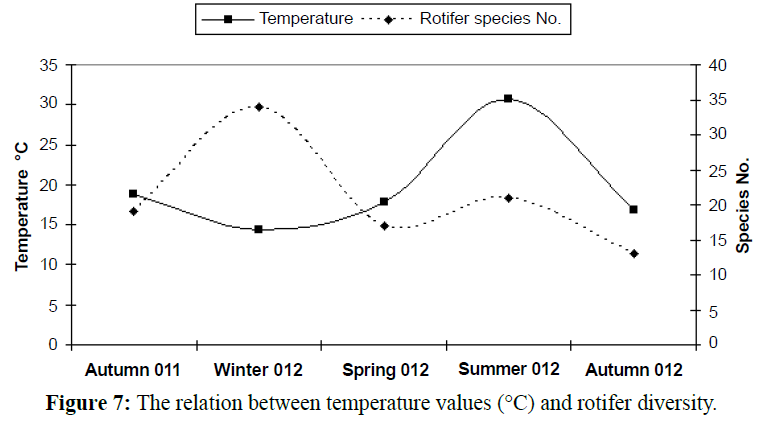
Figure 7: The relation between temperature values (°C) and rotifer diversity.
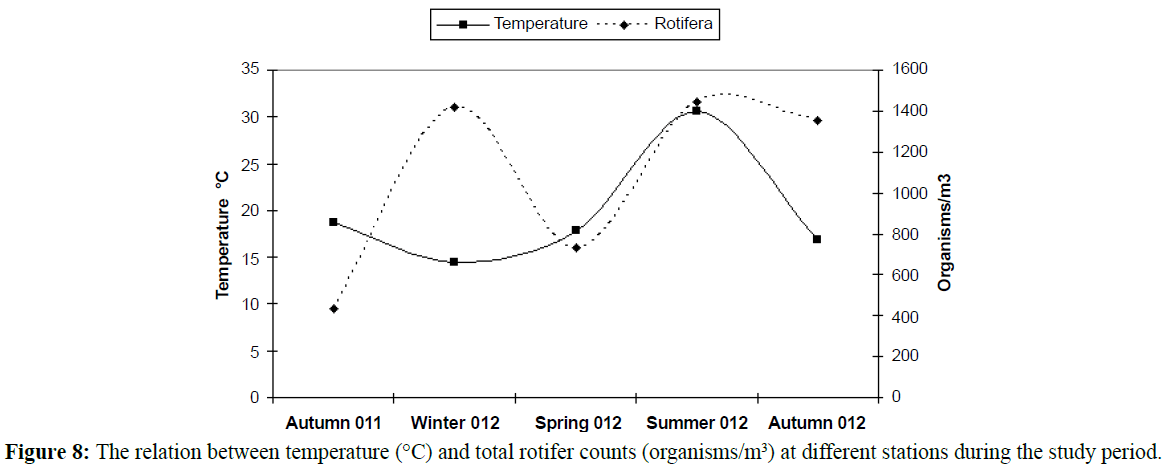
Figure 8: The relation between temperature (°C) and total rotifer counts (organisms/m3) at different stations during the study period.
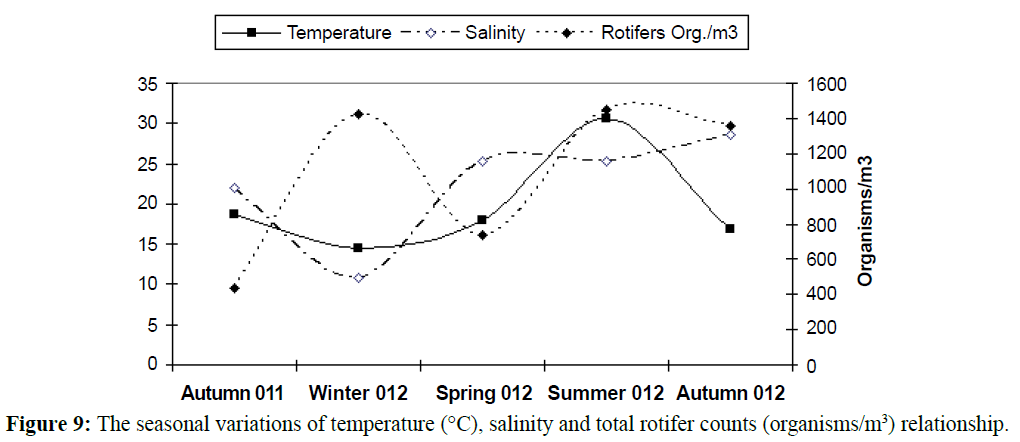
Figure 9: The seasonal variations of temperature (°C), salinity and total rotifer counts (organisms/m3) relationship.
Bio-indicators of water quality
Protozoa occupied the 2nd order of abundance among zooplankton groups in El-Mex Bay contribution 15.6% of the total zooplankton counts (averaged 1440 organisms/m3), predominated by ciliates. Protozoa are characterized by many specific structural and functional features, present an important ecological assemblage in aquatic ecosystem and play a crucial role in the function of microbial food webs in addition to their role as indicators of water quality (Xuet et al., 2008).
Ciliated Protozoa are considered as bio-indicators. The absence of these organisms indicates the presence of toxic substances, such as phenols, cyanides, and heavy metals. The presence of these organisms indicates oxygen deficiency, system overload, and putrefaction. An increased number of several different bacteria, the presence of Cyanophyta, Zooflagellate, and Ciliata, is an indication of water overloaded with organic matter, i.e. an indication of polysaprobic processes and oxygen deficiency (Németh-Katona, 2008). Some Protozoan species are considered as indicator of the pollution with sewage pathogens such as the genera Euplotes, Centropyxis and Difflugia.
Salinity changes bio-indicators
In the present study the maximum chlorophyll- a concentrations was recorded at station (I) 52.65 μg/l. The high concentration of Chl-a content recorded in the water is coincided with low salinity, high temperature and high values of nutrient salts, which reflects such eutrophication condition caused by drainage effluents (Figure 10).
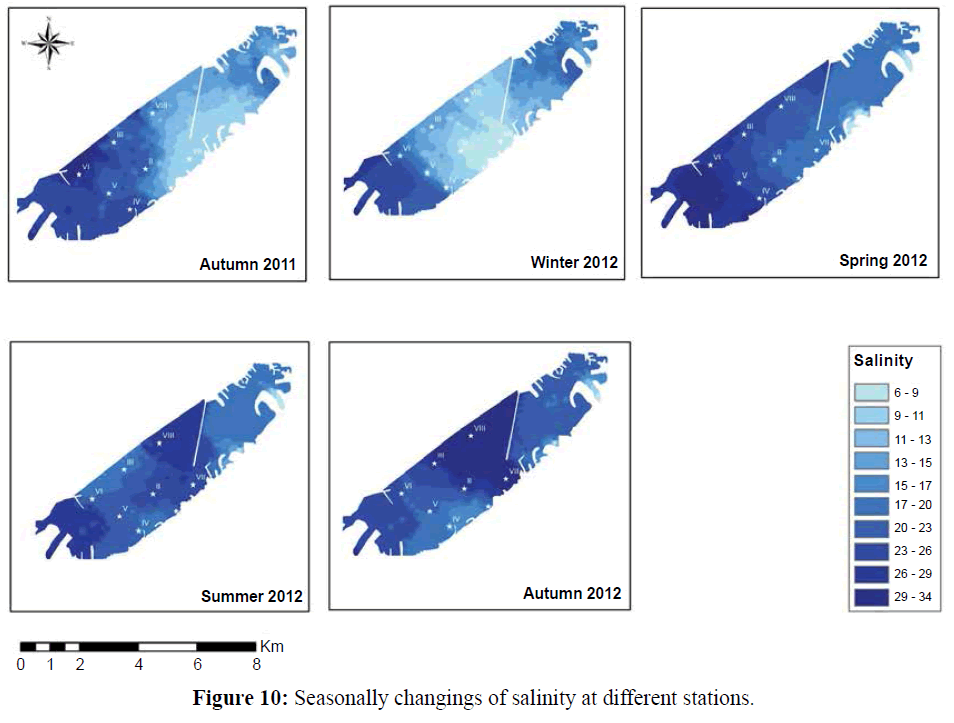
Figure 10: Seasonally changings of salinity at different stations.
Protozoa community in El-Mex Bay is pronouncedly affected by the dispersion pattern of discharged waters. The water masses in the bay showed different communities, relative to the salinity differences. Higher values were particularly observed during winter 2012 (2272 organisms/m3) while autumn 2011 displayed lower densities (519 organisms/m3). Protozoa reached the maximum density at station VII during spring 2012 (5860 organisms/ m3) due to the predominance of Centropyxis aculeate, Difflugia oblonga, Favella azorica, Tintinnopsis beroidea, T. campanula, T. cylindrical, and T. lobiancoi were important contributors to the tintinnids population at most stations in different seasons.
Station VII located in front of the Western Harbor gate at the bay side, the domination of protozoa at this location reflect the effect of the western current direction inside the bay which moving the water from Al-Umoum Drain passing by station I and right direction into station VII, this was coincident with the well-known fact that, Western Harbor receive the drainage from two sources (Al-Mahmodeia and El-Nobareia canals) including industrial, domestic and agriculture wastes with high amounts of nutrient salts which enhanced the flourishing of protozoa and other pathogens this water passed directly from the western harbor into the open Mediterranean water through El-Mex Bay, the first affected site is VII that located at the connection between the harbor gate and the bay.
All copepod organisms observed in El-Mex waters are eurythermic and euryhaline forms living under a range of water temperature between 14.39-30.68ºC and water salinity between 10.82-28.53%.
Water acidification problem and Pteropods as bio-indicators
The absence of pteropod organisms from any marine water system considered a strong signal on water acidification. The results indicated that pteropods organisms correlated positively with pH values recorded their highest counts (Average 44 organisms/m3) at the highest measured pH at the investigation period (7.76) (Figures 11, 12 and Table 3), the prevailing acidic conditions in the bay stand as a barrier to abundance, diversity and dispersal of this organisms which recorded in lower densities and diversity (two species only, Creseis aciculate and Limacina inflate) coincident with lower values of water pH were with decreasing in pteropods numbers this was a result of the fact that, Pteropods are likely to be the plankton organism highly sensitive to environmental condition change in pH (Russell, 1935), because the composition of their shells which mainly of aragonite, will be subject to the increased dissolution under more acidic conditions.
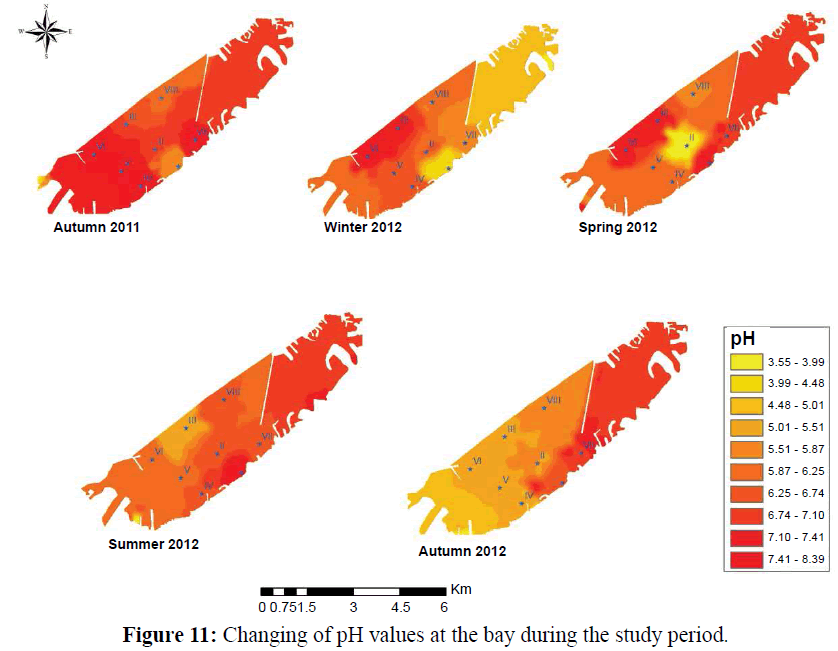
Figure 11: Changing of pH values at the bay during the study period.
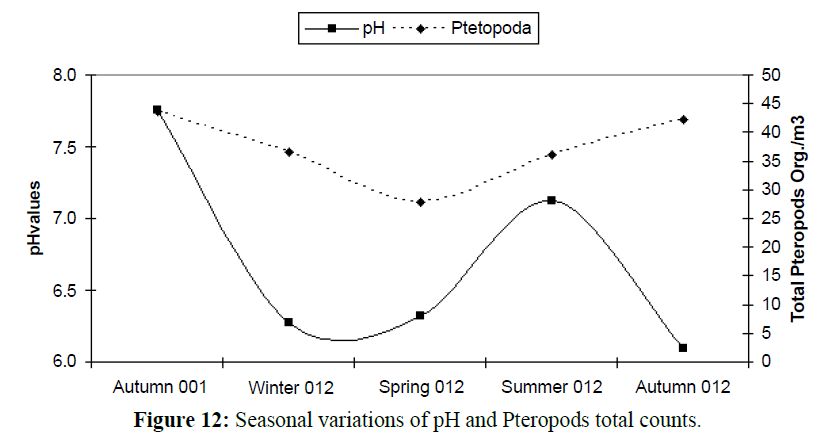
Figure 12: Seasonal variations of pH and Pteropods total counts.
| Pteropoda species Total counts |
Autumn 2011 |
Winter 2012 |
Spring 2012 |
Summer 2012 |
Autumn 2012 |
| Creseis acicula |
44 |
9 |
12 |
18 |
41 |
| Limacinainflata |
0 |
28 |
16 |
18 |
1 |
| Sum. |
44 |
37 |
28 |
36 |
42 |
| pH |
7.76 |
6.28 |
6.32 |
7.12 |
6.09 |
Table 3: The seasonal variations of pH and Pteropoda species.
Pteropods would not be able to adapt quickly enough to live in under wet conditions. Pteropods, with their aragonite shells, are highly vulnerable, while coccolithophorids, foraminifera and some crustaceans, with their calcite shells and lithe, are less vulnerable. Pteropods are likely to decline and may eventually disappear in response to ocean acidification (Orr et al., 2005). The direct effect of ocean acidification on calcifying zooplankton will be to partially dissolve their shells, increasing shell maintenance costs and reducing growth. Foraminifera contribute a significant proportion of the sediments are highly affected Hallegraeff, (1984). pH decreasing in the bay was a consequence of growing heavy industries such as chemicals, textile, tanneries, industrial dyes, ink, petroleum re?ning, metal processing industries (Aboul Ezz et al., 2014 and Hendy et al., 2015).
Declining pH may also alter the growth rates of photosynthetic organisms in the bays and harbors the Mediterranean Sea. In particular, changes in pH will affect nutrient uptake kinetics, altering rates of growth and photosynthesis. Changes may also occur in phytoplankton cell composition (Table 4 and Figure 13), which could affect their nutritional value for higher trophic levels (McKinnon et al., 2007).
| |
Autumn 2011 |
Winter 2012 |
Spring 2012 |
Summer 2012 |
Autumn 2012 |
| Chlorophyll-a (µg/l) |
7.50 |
9.06 |
8.82 |
34.38 |
29.92 |
| pH |
7.76 |
6.28 |
6.32 |
7.12 |
6.09 |
Table 4: The relation between seasonal variations of pH and Chlorophyll-a (μg/l).
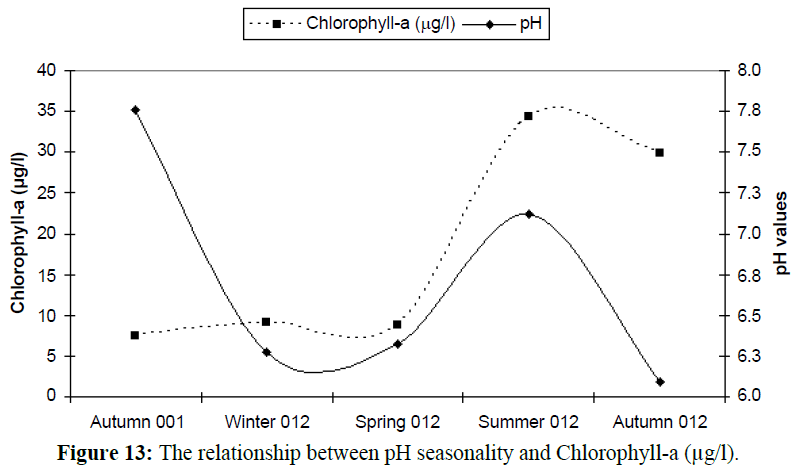
Figure 13: The relationship between pH seasonality and Chlorophyll-a (μg/l).
Eutrophication problem and its bio-indicators
The zooplankton abundance is primarily controlled by fluctuations in the physical environment and nutrient concentrations, which cause high seasonality among samples. Due to pollution and eutrophication, many species were favored while rare species became extinct. It is clear that for a better understanding of the ecosystem of El-Mex Bay, long-term monitoring data on the relevant physico-chemical and biological components and on the quality and quantity of zooplankton is essential.
The sensitivity of rotifer and other zooplankton species to some physical and chemical conditions allow them as bioindicators of aquatic ecosystem. Being rather tolerant to different environmental conditions, many rotifer species are good indicators of water quality and can be used for the ecological monitoring of water bodies.
With increasing phytoplankton biomass, the abundance of phytoplankton cause herbivorous zooplankton species to increase (Shiganova et al., 1998). Due to pollution and eutrophication the copepod Acartia clausi was favored, while rare species became extinct (Isinibilir et al., 2008). Zhenbin et al., 2008 reported that zooplankton community structure changed from eutrophicindicator genera (Brachionus, Polyarthra and Keratella) (Figure 14) to genera more characteristic of oligotrophic conditions (Tintinnopsis and Acanthocyclops). The results indicated this idea as shown in the following (Figures 15, 16 and Table 4), rotifer species flourishing in eutrophic conditions with high chlorophyll values; on the other hand Tintinnopsis species (Tables 5, 6 and Figure 14) flourishing at low concentrations of primary productivity and oligotrophic conditions, this appeared in the reverse correlation between Tintinnopsis counts and chlorophyll-a concentrations.
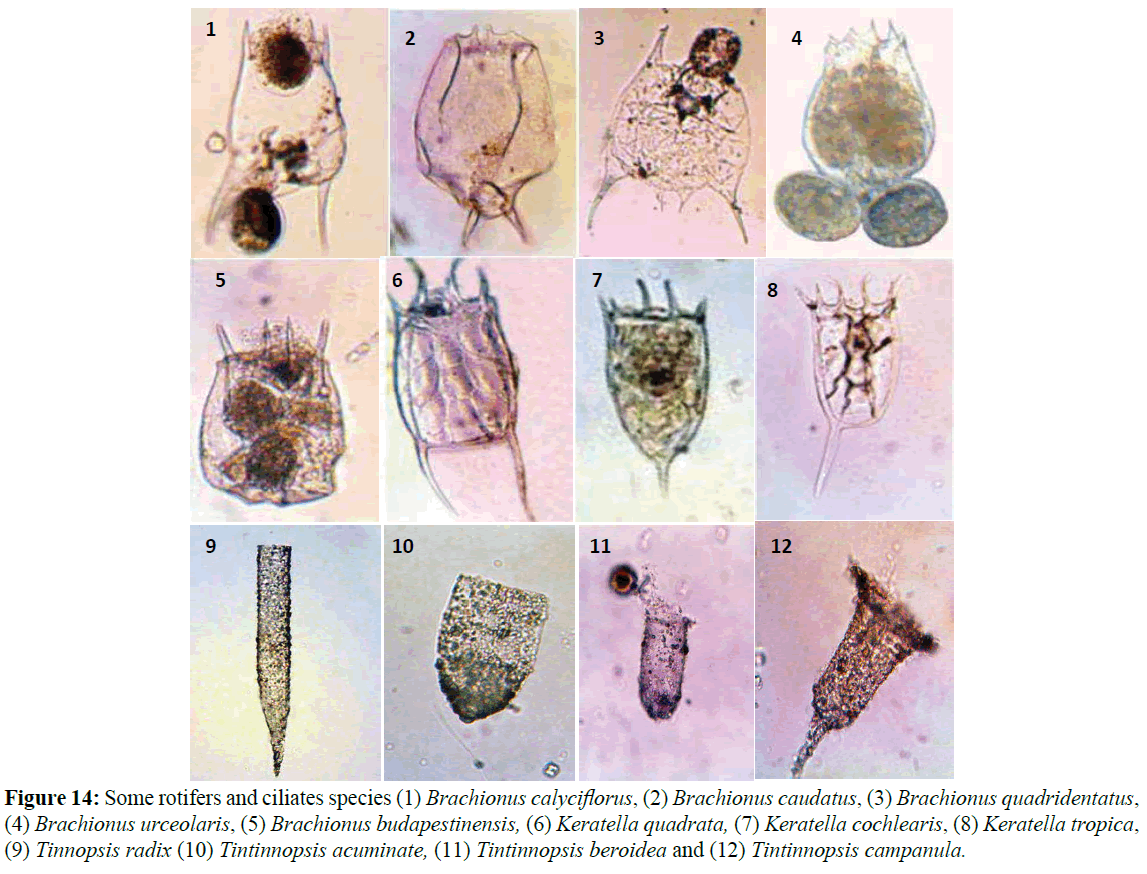
Figure 14: Some rotifers and ciliates species (1) Brachionus calyciflorus, (2) Brachionus caudatus, (3) Brachionus quadridentatus, (4) Brachionus urceolaris, (5) Brachionus budapestinensis, (6) Keratella quadrata, (7) Keratella cochlearis, (8) Keratella tropica, (9) Tinnopsis radix (10) Tintinnopsis acuminate, (11) Tintinnopsis beroidea and (12) Tintinnopsis campanula.
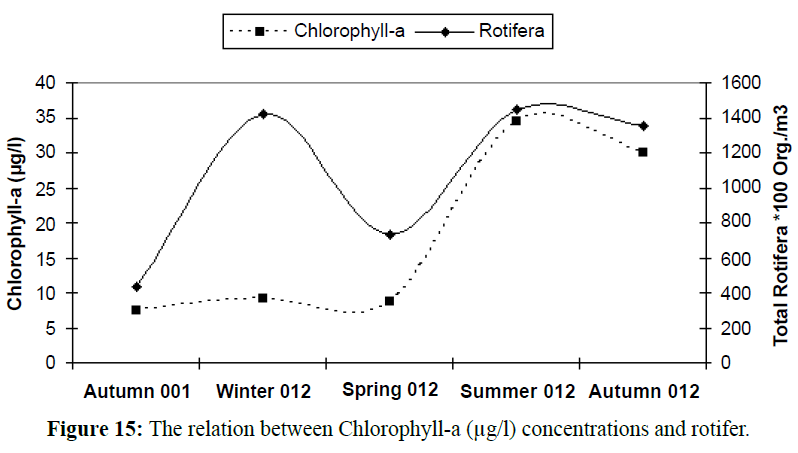
Figure 15: The relation between Chlorophyll-a (μg/l) concentrations and rotifer.
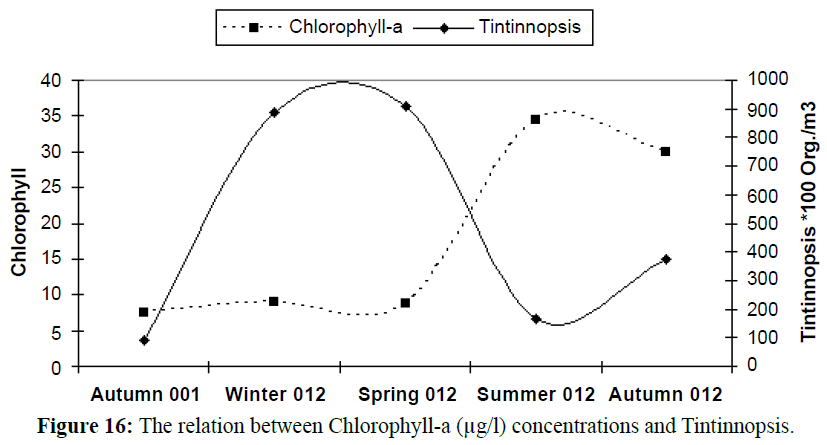
Figure 16: The relation between Chlorophyll-a (μg/l) concentrations and Tintinnopsis.
| |
Autumn 2011 |
Winter 2012 |
Spring 2012 |
Summer 2012 |
Autumn 2012 |
| Chlorophyll-a (µg/l) |
7.50 |
9.06 |
8.82 |
34.38 |
29.92 |
| Rotifera organisms/m3 |
434 |
1421 |
734 |
1445 |
1353 |
| Tintinnopsisorganisms/m3 |
91 |
887 |
911 |
166 |
377 |
Table 5: The relation between seasonal variations of Chlorophyll-a (μg/l), rotifer and Tintinnopsis.
Phylum: Amoebozoa
- Centropyxis aculeate (Ehrenberg, 1832) Stein, 1859
- DifflugiaoblongaEhrenberg, 1832
- Phylum: Arthropoda
- Acartia (Acartiura) clause Giesbrecht, 1889
- AcanthocyclopsKiefer, 1927
- Phylum: Ciliophora
- Euplotes O.F. Müller, 1786
- Favellaazorica(Cleve, 1900) Jörgensen, 1924
- Tintinnopsis acuminateDaday, 1887
- TintinnopsisberoideaStein, 1867
- Tintinnopsis campanula Ehrenberg, 1840
- Tintinnopsis cylindricalDaday, 1887
- Tintinnopsislobiancoi Daday, 1887
- Tinnopsis radixImhof, 1886
- Phylum: Mollusca
- Creseis aciculate (Rang, 1828)
- Limacina inflate d'Orbigny, 1834
|
Phylum: Nematoda
- Free living nematodes
- Phylum: Rotifera
- BrachionusbudapestinensisDaday, 1885
- BrachionuscalyciflorusPallas, 1766
- BrachionuscaudatusBarrois and Daday, 1894
- Brachionusquadridentatus Hermann, 1783
- BrachionusurceolarisMüller, 1773
- Filinia longiseta Ehrenberg, 1834
- KeratellacochlearisGosse, 1851
- KeratellaquadrataMüller, 1786
- KeratellatropicaApstein, 1907
- PolyarthraEhrenberg, 1834
- Phylum: Sarcomastigophora
- Archiriscushertwigi Haeckel 1887
- Myxosphaeracoerulea Schneider, 1858
|
Table 6: List of bio-indicator zooplankton species.
Nematodes represented by 0.7% of the total zooplankton with an average of 65 organisms/m3. Németh-Katona (2008) considered that the presence of nematodes is an indication of the final stage of contamination with sewage, the absolute putrefaction of water: hydrogen sulfide indicator.
Ciliated Protozoa are considered as bio-indicators. The absence of these organisms indicates the presence of toxic substances, such as phenols, cyanids, and heavy metals. The presence of these organisms indicates oxygen deficiency, system overload, and putrefaction. An increased number of several different bacteria, the presence of Cyanophyta, Zooflagellata, and Ciliata, is an indication of water overloaded with organic matter, i.e. an indication of polysaprobic processes and oxygen deficiency (Németh-Katona, 2008). Some Protozoan species (Figure 17) are considered as an indicator of the pollution with sewage pathogens such as the genera Euplotes, Centropyxis and Difflugia. These freshwater protozoan species that encountered in this study confirmed the contamination of the by sewage, this agree with (Froneman, 2004) who mentioned that The presence of protozoan freshwater species in marine coastal areas are considered a biomarkers on the presence of freshwater discharge into these areas, and according to types of this species can determine the source of water discharged neither rivers, lakes, drainage or sewage.

Figure 17: (1 and 2) Euplotes sp. (3) Centropyxis aculeate (4) C. ecornis (5) Difflogia urceolata.
Role of ballast water in species transmission
Some species known to be characterize the clear open deep water like Archiriscus hertwigi and Myxosphaera coerulea, (Figure 18) these two species were encountered at the bay during this study and didn't record before from the shallow water of Egyptian Mediterranean Coast. After investigations, there is only one reason supposed to discuss this phenomenon, it is the mechanical transmission through the ballast water. It is well known fact that, El-Mex Bay lied between two of the biggest harbors at the Egyptian coasts, many ships transport some heavy industrials like metals includes irons products and others, these vessels discharge the ballast water directly into the bay before there entrance to the harbors including many invading organisms from different regions and origins. Ballast water is considered one of the primary transport vectors for the transfer in order to the introduction of non-indigenous zooplankton (DiBacco et al., 2012). It may also be a result of the prevailing northeastern current at the Egyptian Mediterranean Coast that can bring the open water organisms into the shallow areas.
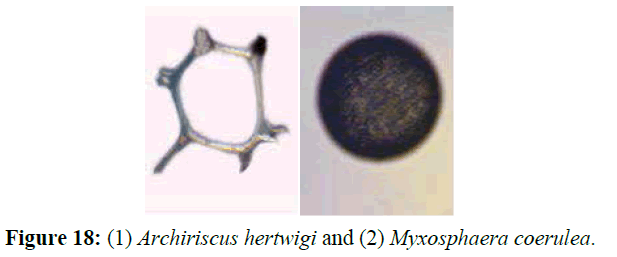
Figure 18: (1) Archiriscus hertwigi and (2) Myxosphaera coerulea.
Environmental management
• It is necessery to enhance the using of bio-indication concept for monitoring the water characteristics and quality in different aquatic habitats due to their consequences on the other organisms of different food webs that will have impacts on the fisheries.
• Prevent the drainage of the acidic water that have bad effects on the coastal zones like; corrosin, erosion of the coast and also the destoration of the aquatic resources including molluscan shells that interact with acids.
• Improvement of the physical and chemical properties of the water that drained into the coastal areas and ports from different land based sources including factories cooling water, urban and agriclutural drainage.
• Construction of periodic database contiuning checklist of fauna found in ports and bays to follow the invasive species that transformed by the ballast water and their effects on theie interaction with the natives and their effects on the local environment.
Conclusion and Recommendations
El-Mex Bay is located under stress condition due to the discharge of untreated domestic, industrial and agricultural effluents, beside the effect of ships movements from and to the harbors. Therefore, the condition at this bay is eutrophic and completely different from the open sea water. These are expected to continue and added to climatic influence of increasing temperature and rising sea level in the future.
Rotifer and other zooplankton species sensitivity to some physical and chemical conditions allow using them as bioindicators of aquatic ecosystem saprobility. Being rather tolerant to different environmental conditions, many rotifer and ciliate species are good indicators of water quality and can be used for the ecological monitoring of water bodies.
If we found indications on the presence of any water problems that mentioned, we can gain a prediction on the consequences risks that will happen to the aquatic environment and the natural resources, so we must give a recommendation to the policy makers to prevent such risks. Author think this is one of the main objects of this manuscript.
It is recommended that the integrated coastal zone management approach (ICZM) is a necessary tool for long-term sustainable development of the coastal area in Egypt. The severe land-use interference and the large population involved and conflicting requirements for development make it necessary to use decisionsupport systems based on GIS for future development and planning of these areas.
Short-term adaptation measures are also necessary for the frame of the no regrets policy. These involve beach nourishment, upgrading awareness and building institutional capability in ICZM.
16503
References
- Abdel-Aziz, N.E., AboulEzz, S.M., AbouZaid, M.M., Abo-Taleb, H.A. (2011) Temporal and spatial dynamics of rotifers in the Rosetta Estuary, Egypt. Egypt J Aqua Res 37, 59-70
- nAbo-Taleb, H.A. (2010) Dynamics of zooplankton community in the connection between the Mediterranean Sea and the River Nile at Rosetta Branch. M.Sc. Thesis, Al-Azhar University, Egypt p: 183
- nAbo-Taleb, H.A., El Raey, M., AbouZaid, M.M., AboulEzz, S.M., Abdel-Aziz, N.E. (2015) Study of the physico-chemical conditions and evaluation of the changes in eutrophication-related problems in El- Mex Bay. African J of EnvSci and Technol4, 354-364
- nAboulEzz, S.M., Salem, S.A., Samaan, A.A., Latif, A.F.A. andSoliman, A.M., (1996).Distribution of rotifers in the Rosetta Nile Branch (Egypt). J. Egypt GerSocZool 20, Invertebrate ZoolParasitolpp: 85-123
- nAboulEzz, S.M., Abdel Aziz, N.E., AbouZaid, M.M., El Raey, M., Abo-Taleb, H.A. (2014) Environmental assessment of El-Mex Bay, Southeastern Mediterranean by using Rotifera as a plankton bio-indicator. Egyptian J of Aqua Res 40, 43-57
- nAbouZaid, M.M., El Raey, M., AboulEzz, S.M., Abdel-Aziz, N.E., Abo-Taleb, H.A. (2014) Diversity of Copepoda in a Stressed Eutrophic Bay (El-Mex Bay), Alexandria, Egypt. Egyptian J of Aqua Res 2, 143-162
- nAlheit, J., Bakun, A. (2010) Population synchronies within and between ocean basins: Apparent teleconnections and implications as to physical-biological linkage mechanisms. J of Marine Sys 79, 267-285
- nAntoine, D., Morel, A., Andre, J. (1995) Algal pigment distribution and primary production in the eastern Mediterranean as derived from Coastal Zone Color Scanner observations, J Geophys Res 100, 16193-16209
- nArora, H.C. (1966) Rotifera as indicators of trophic nature of environments.Hydrobiologia27, 146-159
- nBarale, V., Jaquet, J.M., Ndiaye, M. (2008) Algal blooming patterns and anomalies in the Mediterranean Sea as derived from the SeaWiFS data set (1998-2003), Remote SensEnv112, 3300-3313
- nBerland, B.R., Bonin, D.J., Maestrini, S.Y. (1980) Azote ouphosphoreConsiderations on the "paradox nutrionnel" Sea Me EditerraneanOceanolActa3, 135-142
- nBerzins, B. (1960) "Rotatoria" I- VI J.The International Council for Exploration of the Sea.Zooplankton sheets pp: 84-89
- nBerzins, B. and Pejler, B., (1989). Rotifer occurrence in relation to temperature. Hydrobiologia 175, 223- 231
- nBianchi, C.N. and Morri, C. (2000) Marine biodiversity of the Mediterranean Sea: situation, problems and prospects for future research, MarPollut Bull40, 367-376
- nBianchi, C.N. (2007) Biodiversity issues for the forthcoming tropical Mediterranean Sea, Hydrobiologia580, 7-21
- nBick, H. (1972) Ciliated Protozoa. World Health Organization, Genova p: 198
- nChristaki, U., Giannakourou, A., Van Wambeke, F., Gregor?, G. (2001)Nanoflagellate predation on auto- and heterotrophic picoplankton in the oligotrophic Mediterranean Sea, J Plankton Res23, 1297-1310
- nD’Ortenzio, F., Ribera d’Alcala, M. (2009) On the trophic regimes of the Mediterranean Sea: a sate llite analysis, Biogeosciences6, 139-148
- nDiBacco, C., Humphrey, D.B., Nasmith, L.E., Levings, C.D. (2012) Ballast water transport of non-indigenous zooplankton to Canadian ports. ICES. J of Marine Sci69, 483-491
- nEdmondson, W.T. (1959) Freshwater biology 2nd Edition, John Wiley and sons, inc., New York, London, Sydney p: 1248
- nEl-Bassat, R.A. (1995) Ecological studies on zooplankton in the River Nile. M. Sc. Thesis, Fac. Sci. Suez Canal Univ p: 199
- nFroneman, P.W. (2004)Zooplankton community structure and biomass in a southern African temporarily open/closed estuary.Estuarine Coast and Shelf Sci60,125-132
- nGuerguess, S. K. (1979)Ecological study of zooplankton and distribution of macrofauna in Lake Manzalah. Ph. D. ThesisFacof Sci Alex Univ Egyptp:316
- nGurney, R. (1927) VIII Report on the crustacean Copepoda and Cladocera of the plankton. Cambridge Expedition to the Suez Canal (1924). Trans Zool Soc London 22, 139-172
- nGurney, R. (1931) The Biritish freshwater Copepoda. Ray Soc. London1, 330
- nGurney, R. (1932) The British freshwater copepoda (Harpacticoida). Ray Soc., London2, 336
- nGurney, R. (1933) The British Freshwater copepods (Cyclopoida). Ray Society London3,484
- nHallegraeff, G.M. (1984) Coccolithophorids (calcareous nanoplankton) from Australian waters.Botanica Marina 27, 229-247
- nHardig, J.P., Smith, W.A. (1960) A key to the British freshwater Cyclopoid and Calanoid Copepods. Scientific publication 18,p:53
- nHays G.C., Richardson A.J., Robinson C. (2005) Climate change and plankton. Trends in Ecol and Evol20, 337-344
- nEl Raey M., Nasr S., Hendy D.A. (2015) Integrating Knowledge to Assess Coastal Vulnerability to Sea-Level Rise in El-Mex Bay, Egypt: The Application of the Diva tool. International J of Marine Sci5, 1-7
- nHutchinson, G.E. (1967) A Treatise on limnology. John Wiley Edit., New York 11, 1115
- nIsinibilir, M., Kideys, A.E., Tarkan, A.N., Yilmaz, N.I. (2008) Annual cycle of zooplankton abundance and species composition in Izmit Bay (the northeastern Marmara Sea). Estuarine Coast and Shelf Sci78, 739-747
- nJörgensen, E. (1924) Mediterranean Tintinnidae. Report on the Danish oceanographical expeditions to the Mediterranean and adjacent Seas. Biology2,53
- nKlimowicz, H. (1961) Rotifers of the Nile canals in the Cairo environment. Polsk Arch Hydrobiol9, 203-221
- nKrom, M.D., Kress, N., Brenner, S., Gordon, L. (1991)Phosphorous limitation of primary productivity in the Eastern Mediterranean Sea, Limnol.Oceanogr36, 424-432
- nLonghurst, A.R. (2006)Ecological Geography of the Sea, 2nd edn., Elsevier Science Publishers, New York
- nMackas, D.L.,Beaugrand, G. (2010) Comparisons of zooplankton time series. J of Marine Sys 79, 286-304
- nMahmoud, T.H., Masoud, M.S., Shaltout, N.A., Hussein, N.R. (2009)The biological pump of carbon dioxide in El- Mex Bay, Alexandria, Egypt. Egyptian Journal of Aquatic Research36, 11-20
- nMarshall, S.M. (1969) "Protozoa In: Fichesd' identification du zooplankton", Eds. J. H. Fraser dela Mer, Charlottenlund, Slot-Denmark
- nMcKinnon, A.D., Richardson, A.J., Burford, M.A., Furnas, M.J. (2007) Vulnerability of Great Barrier Reef plankton to climate change Part II: Species and species groups 6, 122- 152
- nMeybeck, M., Lestel, L., Bonte, P., Moilleron, R., Colin, J.L. et al. (1950-2005) Historical perspective of heavy metals (Cd, Cr, Cu, Hg, Pb, Zn) in the Seine river basin (France) following a DPSIR approach, Sci. Total Environ375
- nNémeth-Katona J. (2008)The environmental significance of bioindicators in sewage treatment.ActaPolytechnicaHungarica5, 117- 124
- nOrr, J.C., Fabry, V.J., Aumont, O., Bopp, L., Doney, S.C., et al. (2005) Anthropogenic ocean acidification over the twenty-first century and its impact on calcifying organisms. Nature437, 681- 686
- nPaulmier, G. (1997) Tinninids (Ciliphora, Oligotrichida, Tintinnina) De L'Atlantique Boreal, De L'Ocean Indien et de quelques mers adjacentes: Mediterranean, Mer caraibe, Mer Rouge. Inventaireet Distribution. Observations basees sur les loricas, France
- nPejler, B. (1957) Taxonomical and Ecological Studies on Planktonic Rotifer from Central Sweden Kungel.H and I FjardeSerien, Bd, SevenskaVententsKapaSakad7
- nPerry R.I., Batchelder H.P., Mackas D.L., Chiba S., Durbin E. (2004) Identifying global synchronies in marine zooplankton populations: issues and opportunities. ICES J of Marine Sci61,445-456
- nPontin, R. M. (1978) Freshwater planktonic and semi-planktonic rotifer of the British Isles, 65e38. Rose, M. (1933) Copepods Pelagigues. Fauna de France Lachevalier, Paris26, 1-374
- nRussell, F.S. (1935)The zooplankton: IV. The occurrence and seasonal distribution of the Tunicata, Mollusca and Coelenterata (Siphonophora). Great Barrier Reef Expedition (1928-29). Scientific Reports 2, 203-276
- nSaid, M.A., El-Deek, M.S., Mahmoud, Th.H., Shridah, M.M.A., (1991) Physico-Chemical Characteristics of Different Water Types of El-Mex Bay, Alexandria, Egypt, Bulletin of National Institute of Ocean and Fisheries, A.R.E. 71, 103-116
- nSanthanam, R., Srinivasan, A. (1994) A Manual of marine zooplankton.Oxford and IBH publishing co. pvt. Ltd., PatparGanj, Delhi
- nSars, G.O. (1911) An account of Crustacea of Norway, Copepoda, Harpacticoida Bergens. Museum, Skrifter 5, 1-449
- nSars, G.O., (1918) An account of Crustacea of Norway, Copepoda, Cyclopoida Bergens. Museum, Skrifter6, 1-225
- nSars, G.O. (1926) Freshwater Ostracoda from Canada and Alaska. Rept. Cau., Arcetic exped7, 1-22
- nSars, G.O. (1927) The freshwater Entomostraca of the capeprovince (union of south Africa). Copepoda. Ann. S. Afr. Mus 25, 85-149
- nShiganova, T.A., Kideys, A.E., Gucu, A.C., Niermann, U., Khoroshilov, V.S. (1998) Changes in species diversity and abundance of the main components of the Black Sea pelagic community during the last decades. In: Ivanov, L.I., Oguz, T. (Eds.), Ecosystem Modeling as a Management Tool for the Black Sea. Kluwer, Academic Publishers, Netherlands pp: 171-188
- nSoliman, A. M. (1983) Quantitative and qualitative studies of the plankton of Lake Edku in relation to the local environmental conditions and fish food. Alexandria
- nTaylor A.H., Allen J.I., Clark P.A. (2002) Extraction of a weak climatic signal by an ecosystem. Nature 416, 629-632
- nThingstad, F.T.,Rassoulzadegan, F. (1999) Conceptual models for the biogeochemical role of the photic zone microbial food web, with particular reference to the Mediterranean Sea, Prog. Oceanogr 44, 271-286
- nThingstad, F.T.,Rassoulzadegan, F. (1995) Nutrient limitations, microbial food webs, and “biological C-pumps”: Suggested interactions in a P-limited Mediterranean, MarEcolProgSer117, 299-306
- nThingstad, F.T., Krom, M.D., Mantoura, R.F.C., Flaten, G., Groom, S. (2005) Nature of phosphorus limitation in the ultraoligotrophic Eastern Mediterranean, Science 309, 1068-1071
- nTregouboff, G., Rose, M. (1957) Mannual de planktologie Mediterranean C.N.R.S., Paris p: 208
- nTurley, C., Bianchi, M., Christaki, U., Conan, P., Harris, J.R.W. et al.(2000).Relationship between primary producers and bacteria in an oligotrophic sea-the Mediterranean and biogeochemical implications, Mar Ecol Prog Ser193, 11-18
- nWilson, M.S., Yeatman, H. C. (1959) Free-Living Copepoda, Freshwater Biology
- nXue C, et al. (2008) Magnificent seven: roles of G protein-coupled receptors in extracellular sensing in fungi. FEMS Microbiol Rev 32,1010-1032
- nZhenbin, W.U., Aifen, L., Shiyang, Z., Shuiping, C.,Xiaohui, W.U. (2008) Short-term effects of drawing water for connectivity of rivers and lakes on zooplankton community structure. J. Environ. Sci20, 419-423.
