Introduction
Fish provide the main source of animal protein to about one billion people globally (Williams, 1996). Fisheries are an important part of food security by supplying 25% of the total animal protein, particularly for many poor people in developing countries (ICLARM, 1992). Access to fish varies regionally; where fish is available it contributes significantly to a healthy diet and eating habits have been shifting in favor of fish in areas and communities where there is regular and sufficient supply. In those communities, annual fish consumption can exceed 10 kg/person (FAO, 1996).
Small-scale fisheries account for more than half of total fish production in the world. The sector is a major source of food fish, income and employment to many millions of people, especially in developing countries. Despite their importance in terms of poverty alleviation and food security, small-scale fisheries are facing a host of challenges, including: overfishing, illegal unreported and unregulated fishing, conflicts with industrial fisheries, and high levels of post-harvest fisheries losses (FAO, 2011), while Ethiopian fishery is left under small scale type. Small scale fisheries contribute to food security in a variety of ways (Borgstrom G., 1962). For example- Subsistence and local consumption; fisheries provide a direct supply of fish, either for consumption by fishers and their families, or through their sale at local markets, Income; 38 million people worldwide are employed in fisheries, 95% of whom are in developing countries. The income from employment, and the financial revenues from the sale of fish, provides cash which can then be used for the purchase of other foodstuffs, Accessible protein for the poor; fish are often one of the cheapest protein sources available in developing countries. Small fish are especially important for poor consumers, as they can be purchased in small quantities at low cost. The same consumers often can’t afford to buy other protein sources which have to be bought in much larger quantities, such as chicken etc.
Besides its contribution to national economy, livelihoods and employment, the small scale fisheries provides one of the best food that are rich in omega-3 fatty acid, which is important for reducing blood cholesterol and also enriching brain of developing fetus, if consumed by expectant mothers. Ethiopia remains one of the least fish producing and consuming country in the world. The per-capita fish production in the country is below 248g. The percapita fish consumption may be even lower as some fish products could be exported and the imported ones are beyond the reach of many Ethiopians. Therefore, resorting to different solutions like aquaculture and reduction in fish post-harvest loss has no option in this country. Actual loss reduction efforts must begin with political commitment to carry through the actions required. Given the complex coordination to effect loss reduction, each regions requires a regional postharvest policy body with a full-time professionals stuff to assess and monitor overall losses, identify acute loss priorities and carry out research. Generally speaking, fish post-harvest loss refers to fish that is either discarded or sold at a relatively low price because of quality deterioration or owing to market dynamics. This means that fish operators (fishers, processors, traders, and other stakeholders involved in ancillary operations) lose potential income. It also means that less fish is available to consumers, or that consumers are supplied with low-quality fish and fish products. There are also important negative implications for food security. Post-harvest fish losses are often caused by biochemical and microbiological spoilage changes that occur in fish after death. A live fish has natural defense mechanisms that help to prevent spoilage. However, once a fish dies, its defense mechanisms stop and enzymatic, oxidative and microbiological spoilage begins to cause quality deterioration (FAO, 2011).
Post-harvest fisheries losses are of great concern because they equate to a loss of valuable animal protein for consumers and lost income for fishers, processors and traders. FAO estimates for fisheries in some countries including Ethiopia place fish losses among the highest for all commodities” where Ethiopia losses one third of the annual production (10,000 tons). In addition to money being wasted, discarded fish has a negative impact on our environment as it contributes to global warming. This is because the bulk of wasted fish ends up in landfills, and rotting fish in landfills produces methane gas - one of the greenhouse gases that contribute to global warming. Reducing losses is therefore an important development goal in the fisheries sector (FAO, 2011). Very little is known about fish losses in Finchawa and Amerti reservoirs fishery/distribution chain by Policy-makers, Fishers, Traders and vending community. Before any intervention measure taken to reduce the fish postharvest losses the actual and more figure(data) should be collected to estimate the probable costs, organizations and personnel needs. Therefore, this research activity was initiated with the objective to develop a general understanding of losses and identify those which are significant and the need of interventions to reduce the losses.
Materials and Methods
Study Area
The study was carried out in Oromia Region Horo Guduru zone, at Abay Chomen Woreda in the town of Finchawa, which is located at approximately 288 km North West of Addis Ababa at an altitude between 2000-2250m above sea level. Finchawa Reservior(09o 33’.782’’ N, 037o 21’.298’’E) constructed in the course of chomen swamp in 1973’s which has usable raw water storage capacity of approximately 650 million cubic meters and a maximum and mean depth of 25 m and 5m, respectively, and catchment area of 1,318 km2 (Buzayhu and Graaff, 2006). Finchawa reservoir has an area of 350 Km2(Daba T. 2006). The area is characterized by dry weather November through March. The average annual rainfall is 1709.2mm. Amerti reservoir (9°.63’ N, 37°.23’ E) is located at an altitude of 2243 m above sea level. The reservoir was built to supply water to the adjacent Finchawa reservoir through a tunnel for hydroelectric power generation (OADB, 1996). The water temperature of the reservoir ranges between 18.9 and 23.1°C. The area has annual rainfall of 1823 mm with long rains occurring from May to August and the short rains from November to February.
Data Collection and Analysis
The data was collected monthly for twelve months between August 2011 and July 2012. The study was carried out by adopting three methods named Informal Fish Loss Assessment Method (IFLAM), Load Tracking (LT) and the Questionnaire Loss Assessment Method (QLAM). On the first step Informal Fish Loss Assessment Method (IFLAM) which was an informal method based on participatory rural appraisal
(PRA) principles was used to generate qualitative and indicative quantitative post-harvest fish losses data. Then after the Load Tracking (LT) was used to quantify losses at stages along the distribution chain or losses related to specific activities such as fishing, transport, processing and marketing. Finally, the Questionnaire Loss Assessment Method (QLAM) was adopting by interviewing a population sample in a community (geographical area) using a questionnaire to validate data generated by the Informal Fish Loss Assessment Method and Load Tracking.
Review of secondary data such as existing socioeconomic and production information and Initial contacts with a community through key individuals, such as local fishery officials and fishers was done before conducting fieldwork in order to have a thorough back ground knowledge of key issues.
The data collection includes four fishing cooperatives named Gudetu Tika, Abdi Boru, Amerti and Refu Wal Tane and six landing sites.
The total fish catch and losses at the landing sites were determined by using the following calculations:-
The total monthly fish catch=Sum of sampling day catch X Monthly fishing days/No. of sampling days
The total monthly fish loss=Sum of sampling day loss X Monthly fishing days/No. of sampling days
Result
Based on the Informal Fish Loss Assessment Method (IFLAM) the factors which contribute to post-harvest fish losses appraised were spoilage, size discrimination, species preferences, operational losses, less market access and others. Then the procedure of Load Tracking (LT) and Questionnaire Loss Assessment Method (QLAM) were followed. Accordingly, the result indicates that from the total annual 98, 784 kg tilapia(Oreochromis niloticus and zilli) catch within twelve months, the total post-harvest fish loss constitutes 6,816 kg (6.9 %) figure. 1 of which 2,076 kg of tilapia due to size discrimination, 1,323 kg due to operational loss, 648 kg due to less market access and 2,497 kg due to spoilage were discarded figure. 2. The total carp species catch were 31,317 kg. Among the total carp species catch, the post-harvest fish loss constitutes 3,539 kg (11.3%) figure. 1, of which 560 kg of carp species due to size discrimination, 2,143 kg due to species preference and 447 kg due to spoilage were discarded figure. 2.
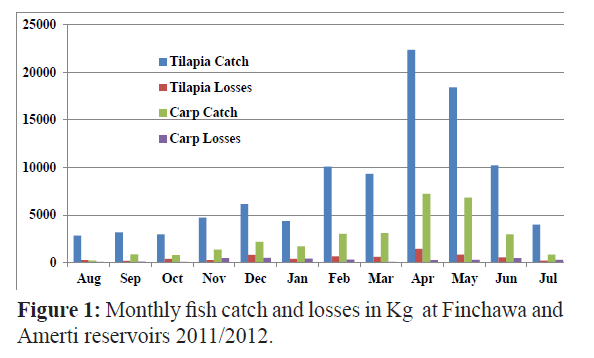
Figure 1: Monthly fish catch and losses in Kg at Finchawa and Amerti reservoirs 2011/2012.
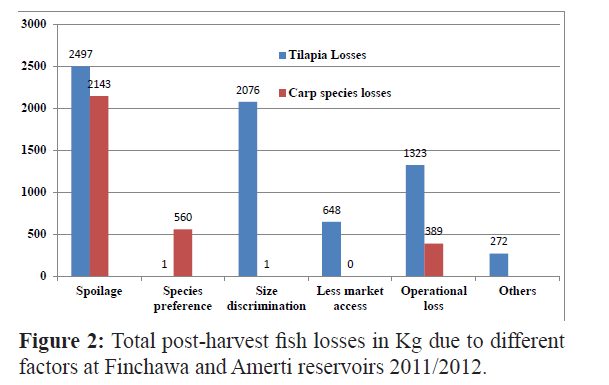
Figure 2: Total post-harvest fish losses in Kg due to different factors at Finchawa and Amerti reservoirs 2011/2012.
From the total 6,816 kg tilapia post-harvest fish losses, spoilage constitutes 36.6%, size discrimination constitutes 30.5%, operational loss constitutes 19.4%, less market access constitutes 9.5% and others constitutes 4% while from the total 3,539 kg carp species catch post-harvest fish losses, species preference constitutes 60.6%, size discrimination constitutes 15.8%, spoilage constitute 12.6% and others constitutes 10% figure. 2
Discussion
In a recent study conducted 2004 and 2005 on post-harvest fish losses assessment at lake Zeway, the total tilapia losses constitutes 15.17% of which 71.2% discarded due to size preference and 28.8% discarded due to spoilage and from the total carp species post-harvest fish losses constitutes 4.4% of which 22.7% discarded due to size preference and 77.3% discarded due to spoilage (Yared T. et al.,2007) while the present study show 36.6% was discarded due to spoilage and 30.5% was discarded due to size discrimination for tilapia and 15.8% was discarded for size preference and 12.6% was discarded due to spoilage for carp species. The difference in result may be due to the differences in methodologies used and of as the recent study on lake Zeway include only two analysis on loss factors (Size and Spoilage) while this research includes more than five analysis on loss factors (Size, Species, Spoilage, Market and Operational loss).
Yared Tigabu reported that 11.19% tilapia post-harvest fish losses among the total catch and 5% carp species post-harvest fish losses among the total catch at Koka reservoir 2007/2008. This is may be due to the presence of different species preference among the society as carp species is preferred by the society around Koka reservoir and discriminated by the society around Finchawa and Amerti reservoirs and the central market. It may also due to the differences between the fishing material as beach seines used at Koka reservoir regularly while very little number of beach seines are engaged at Finchawa and Amerti reservoirs.
The present study more or less agrees with the finding from lake Hashengie as of the total tilapia catch in 2009/2010 8.34% was the post-harvest fish losses of which 19% was discriminated due to size preferences and 81% was discarded due to spoilage while from the total carp species catch the post-harvest losses constitutes 15.4% of which 39% was discarded due to size discrimination and 61% was discriminated for spoilage (Yared Tigabu, 2014).
The highest post-harvest fish losses due to spoilage that was observed from this study could be attributed to long period of time(more than 15 hr) on gill net(Yared Tigabu, 2009).
Conclusion
The determinant factor for post-harvest fish losses at Finchawa and Amerti reservoirs include less market access, size and species preference, inadequate infrastructure for fish handling, processing, storage and transportation and distance from the central market. Fish will become unfit for human consumption within twelve hr of capture unless it is subjected to some forms of cold preservation or further processing. But cold preservation through refrigeration and freezing is not applicable as it is very expensive and difficult to get access of electric power around the production (fishing) area, thus, from this paper it is possible to conclude that fish post-harvest technology such as, fish drying, fish retaining cage, fish smoking, fish meal and fertilizer, fish processing table, solar ice making are very important in reducing mass and nutrient loss which plays a great role in securing food and nutrition. Therefore, it is very important to further adopt, verify, popularize and disseminate these technologies for end users to secure food and nutrition.
Recommendation
Well directed, trained and organized extension services will clearly be absolutely essential to reduce post-harvest fish losses at Finchawa and Amerti reservoirs. Capacity building through different trainings on fish processing, handling and distribution should be emphasized by different stakeholders. Maintaining fish as cold as possible using different technologies like using ice made by solar ice making where electric power is not accessible is recommended to minimize post-harvest fish losses caused by spoilage. Training for fishers and vending community by stakeholders on fish dish preparation specially on carp species is recommended to minimize fish losses due species preference. Recommended fishing net for the reservoirs should be applied for fishing in order to reduce post-harvest fish losses resulted from size discriminations.
Acknowledgement
The author is grateful for Oromia agricultural research institute for funding the research and providing the logistics. He also wants to thank all the staff members of Zeway fishery resources research center specially the technical assistants and field assistants.
8185
References
- Borgstrom G., (1962). Fish in world nutrition .In: Fish as food. Edited by G. Borgstrom. New York.Academic press, 2: pp.267-360
- nBezuayehu T., De Graaff J., (2006). Social and economic impacts of ahydropowerreservoiron upland farming in Fincha watershed, Western, Ethiopia.International journal of Agricultural Sustainability
- nDaba T., (2006) Challenges and Opportunities of Fishery Resource Development of man-made water bodies in Oromia regional state, Ethiopia. In: proceeding of the 14thnational conferences of the Ethiopian Society ofAnimal Production(ESAP). Part II: Technical Papers. Pg 71-82, Addis Abeba/Ethiopia
- nFAO/UNDP(1966) Report to the government of Malawi on fish handling, preservation anddistribution. Based on the work of Y.C. Gilberg.FAO/TA fish processing technologist.Rep.FAO/UNDP (TA).(2224): p.52
- nFAO (2011) Post-harvest fish loss assessment in small-scale fisheries.FAO FISHERIES AND AQUACUL TURETECHNICAL PAPER, 559.ISSN 2070-7010.Rome. Italy
- nGeoftrey R., (1990).The kind and levels of post harvest losses in African inland fisheries. In: proceeding of the symposium on post-harvest fish technology. CIFA Technical paper No 19. Rome, FAO. 1992(1992)
- nICLARM(1992). ICLARM’s Strategy for International Research in Living Aquatic Resource Management ICLARM, Philippines.79p.and Apendex 30p
- nOADB (Oromia Agriculture Development Bureau) (1996). Land resource and socioeconomic survey report of common watershed. OADB, Addis Ababa, Ethiopia
- nWilliams M., (1996).The transition in the contribution of living aquaticresources to food security. Food, agricultural and the environment discussion paper 13.IFPRI, Washington D.C
- nYared T., Abera D., Ahmed.,(2007). Kinds and levels ofpost-harvest losses and the possible ways to reduce the losses in Lake Ziway. In: proceeding of the 15thnational conferences of the Ethiopian Society ofAnimal Production(ESAP). P 141-146, Addis Abeba/Ethiopia
- nYared T., (2010) Fish post-harvest losses and intervention measures to reduce the losses inKoka reservoir. In: proceeding of the second national conferences of the Ethiopian Fisheries and Aquatic Sciences Association(EFASA). P 69-73. Bahir Dar/Ethiopia
- nYared T., (2014) Kinds and levels ofpost-harvest losses and the possible ways to reduce the losses in Lake Hashengie. In: proceeding of the sixth national conferences of the Ethiopian Fisheries and Aquatic Sciences Association(EFASA), In press. Mekelle/Ethiopia
- nU.S. National Academy of Sciences (1978).Postharvest food losses in developing countries.Washington D.C.,National Academy of Sciences.
