Keywords
Eurasian perch, Lysine requirement, Essential amino acids, Growth, body composition, Ideal protein
Introduction
Eurasian perch (Perca fluviatalis) has been identified as a potential species for fish culture (Kestemont and Dabrowski, 1996). There is a high market demand for perch in Europe and the catch of wild perch is not sufficient to meet this demand. One of the identified bottlenecks to a profitable culture of perch is the lack of information about its nutrient requirements. Few nutritional studies have been conducted with Eurasian perch this far, and diets are not standardised. Fiogbe et al. (1996) studied the effects of crude protein (CP) level in juvenile Eurasian perch, and concluded that 370-440 g CP kg-1 diet results in the most effective nutrient utilisation. Previous studies have examined the optimal dietary protein to energy ratio in yellow perch (P. flavescens) (Ramseyer and Garling, 1998) and the protein requirement is reported to be below 300 g CP kg-1 diet (Brown et al., 1996; Ramseyer and Garling, 1998; Schaeffer et al., 2011). This is markedly lower than the requirement reported for Eurasian perch.
Several studies have investigated the dietary amino acid (AA) requirements of yellow perch with regard to the AA composition of the ovaries, muscle and whole body (Ramseyer and Garling, 1994), dietary arginine and sulphur AA requirements (Twibell and Brown, 1997; 2000), optimal dietary AA profile (Hart et al., 2010) and the effect of a lysine-supplemented diet (Kwasek et al., 2012). However, to our knowledge there are no published data on the AA requirements of Eurasian perch.
Lysine is the AA found in highest concentrations in the carcass of several fish species (Wilson and Cowey, 1985; NRC, 2011) and it is the first-limiting indispensable AA (IAA) in most protein sources used for commercial feed production (Hauler and Carter, 2001). When combined with the ideal protein concept, the lysine requirement can be used to predict the requirements of other IAA in an animal species. The ideal protein concept has been applied for estimation of the AA requirements of fish, based on the wholebody tissue of a given fish species (Green and Hardy, 2002; Rollin et al., 2003; Furuya et al., 2004). The ideal protein concept proposes that the optimum dietary IAA requirements be considered as proportions relative to total IAA, usually expressed as per cent of lysine.
The objectives of this study were to assess the dietary lysine requirement of juvenile Eurasian perch fed a semi-purified diet using growth performance, somatic indices and blood haematocrit value as response parameters; and to estimate the requirement for the other IAA (except tryptophan) using the ideal protein concept. The working hypothesis was that the dietary AA requirements of Eurasian perch are different from those of yellow perch.
Materials and Methods
Fish and facilities
The first generation offspring of Eurasian perch collected as eggs in the wild were obtained from a commercial fish hatchery (Östgös AB, Söderköping, Sweden) and brought to the Swe-dish University of Agricultural Sciences, Uppsa-la, Sweden. The fish were stored in a 1000-L flow-through tank and fed a commercial diet (nu-trient composition, g kg-1 DM: crude protein: 410-450; crude lipid: 130-170; ash: 60) to appar-ent satiation twice daily. The health status of the fish was checked by the National Veterinary In-stitute, and no anatomical, pathological or histo-logical anomalies were found. One week prior to experimental start 240 fish (41.7 ± 8.1 g; mean ± SD) were randomly placed in groups of 10 in 24 experimental units (consisting of 200-L glass aquariums divided in two by a sponge filter) or-ganised into three floors. Fish within each floor were randomly assigned to one of eight treat-ments (L1-L8). The experimental aquariums were connected to an indoor recirculating system with mechanical and biological filtration, and UV treatment. Water replacement rate in the system was about 20% h-1. Each aquarium was supplied with two water inlets, recirculating water and freshwater (water flow 5.0 L min-1 and 1.0 L min-1 respectively; 22-23 °C), water outlets at bottom and top and continuous aeration. Feed waste and faeces were removed every second day from the tanks, which were totally cleaned once a week manually with a vacuum cleaner. During the ex-periment water conditions were monitored week-ly. Dissolved oxygen concentration ranged from 7.4 to 8.5 mg L-1 (HQ 40d, Hach Lange GmbH, Berlin, Germany), pH from 7.5 to 8.0, ammoni-um-nitrogen (N) from 0.0 to 0.5 mg L-1 and ni-trate-N from 25.0 to 50.0 mg L-1 (below the de-tection limit for nitrate-N) (Sera aqua-test box, Heinsberg, Germany). The diurnal light: dark cy-cle was 12:12 h. The experiment was performed in compliance with laws and regulations on pro-cedures and experiments in live animals in Swe-den, which are overseen by the Swedish Board of Agriculture.
Diets and feeding
Prior to the experiment the amino acid profile of the whole body, excluding viscera, of 48 farmed Eurasian perch fed a commercial diet (Table 1) was analysed. Fish were classified into three groups according to body weight: small (mean 7.6 g, n=40), medium (69.8 g, n=4) and large (420.2 g, n=4). Based on these findings, eight semi-purified, iso-nitrogenous and iso-energetic experimental diets containing graded levels of lysine (diet code L1-L8) were produced. Fish meal, casein and gelatine were used as pro-tein sources, and were supplemented with mix-tures of dispensable amino acids (DAA) and in-dispensable amino acids (IAA), excluding lysine (Table 2). Approximately 40% of the total N con-tent in the diets was in the form of protein-bound amino acids. To maintain iso-nitrogenous diets, L-glutamic acid was used to balance diets L1-L7 on a molal (mol kg-1) basis. Minerals and vita-mins were added to the diets in accordance with earlier studies on feeding semi-purified diets to yellow perch (Twibell and Brown, 1997). The diets were produced by cold-pelleting in a meat grinder (MR9-TC22, Nima maskinteknik AB, Örebro, Sweden) (3.5 mm die) and the strains formed were dried (forced air oven; 50 °C, 24 h), chopped and screened (2.5 mm) to obtain an ap-propriate size of pellets. The pellets were stored at -25 °C until feeding.
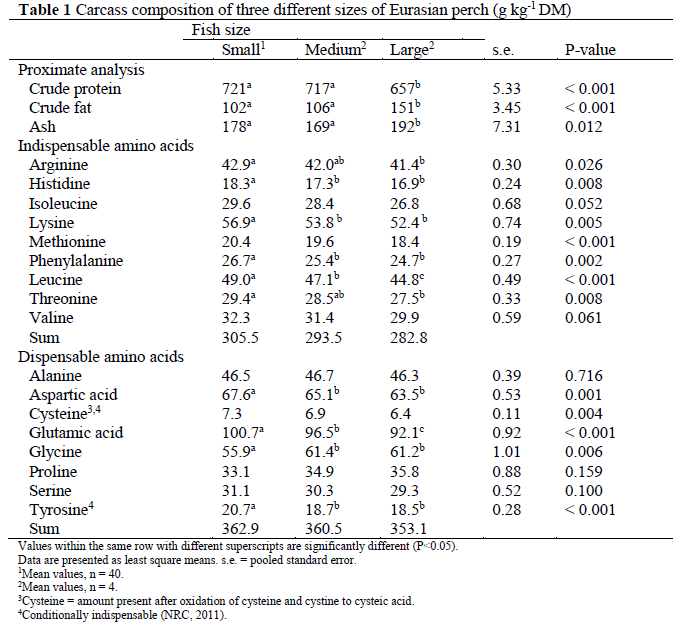
Values within the same row with different superscripts are significantly different (P<0.05) Data are presented as least square means. s.e. = pooled standard error 1Mean values, n = 40 2Mean values, n = 4 3Cysteine = amount present after oxidation of cysteine and cystine to cysteic acid 4Conditionally indispensable (NRC, 2011) Table 1: Carcass composition of three different sizes of Eurasian perch (g kg-1 DM)
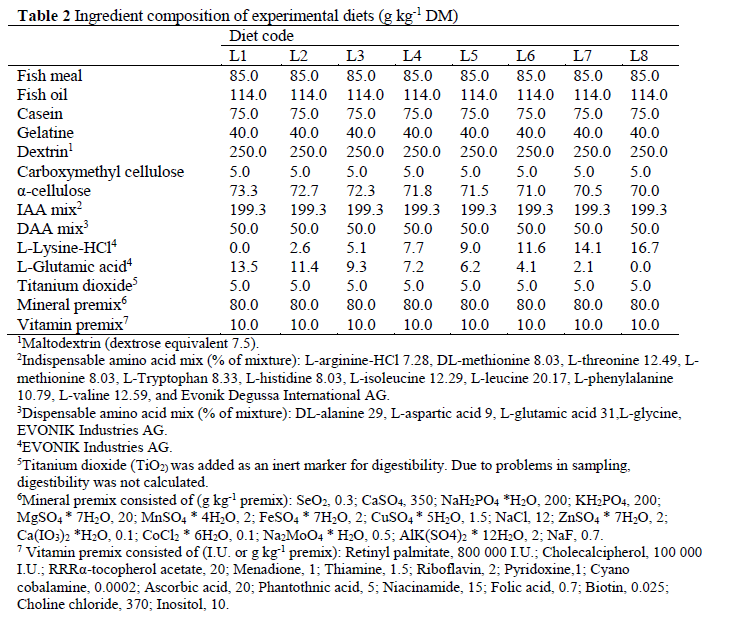
1Maltodextrin (dextrose equivalent 7.5) 2Indispensable amino acid mix (% of mixture): L-arginine-HCl 7.28, DL-methionine 8.03, L-threonine 12.49, L-methionine 8.03, L-Tryptophan 8.33, L-histidine 8.03, L-isoleucine 12.29, L-leucine 20.17, L-phenylalanine 10.79, L-valine 12.59, and Evonik Degussa International AG 3Dispensable amino acid mix (% of mixture): DL-alanine 29, L-aspartic acid 9, L-glutamic acid 31,L-glycine, EVONIK Industries AG 4EVONIK Industries AG 5Titanium dioxide (TiO2) was added as an inert marker for digestibility. Due to problems in sampling, digestibility was not calculated 6Mineral premix consisted of (g kg-1 premix): SeO2, 0.3; CaSO4, 350; NaH2PO4 *H2O, 200; KH2PO4, 200; MgSO4 * 7H2O, 20; MnSO4 * 4H2O, 2; FeSO4 * 7H2O, 2; CuSO4 * 5H2O, 1.5; NaCl, 12; ZnSO4 * 7H2O, 2; Ca(IO3)2 *H2O, 0.1; CoCl2 * 6H2O, 0.1; Na2MoO4 * H2O, 0.5; AlK(SO4)2 * 12H2O, 2; NaF, 0.7 7Vitamin premix consisted of (I.U. or g kg-1 premix): Retinyl palmitate, 800 000 I.U.; Cholecalcipherol, 100 000 I.U.; RRRα-tocopherol acetate, 20; Menadione, 1; Thiamine, 1.5; Riboflavin, 2; Pyridoxine,1; Cyano cobalamine, 0.0002; Ascorbic acid, 20; Phantothnic acid, 5; Niacinamide, 15; Folic acid, 0.7; Biotin, 0.025; Choline chloride, 370; Inositol, 10 Table 2: Ingredient composition of experimental diets (g kg-1 DM)
During the adaption period, the fish were fed a commercial diet by hand to apparent satiation twice daily. During the first week of the experi-mental period, fish were fed the experimental di-ets by hand to apparent visual satiation, to allow them to adapt to the diets and to estimate the ap-parent visual satiation. Excess rations (100% of satiation=full ration) of each diet were constantly fed for 11 hours a day, 6 days a week, with auto-matic feeders. The feed allowance of each tank was adjusted every third week.
Due to a high stress response in the fish at cleaning, we were unable to collect feed wastes to a satisfactory level. Consequently, feed intake had to be excluded from our data, which made it impossible to calculate the actual quantities of protein and lysine ingested.
Sampling
Before the start of the experiment with graded levels of lysine, fish fed the commercial diet and classified into three groups according to body weight were sacrificed and stored at -25 °C for later analysis of initial whole body (except vis-cera) (Table 1). Prior to the feeding of the exper-imental diets, all fish were mildly anaesthetised (tricaine methanesulfonate, MS222; Western Chemical Inc., Ferdale, WA, USA) and individu-ally weighed. At the end of the experiment, all fish were anaesthetised (MS222), individually weighed, a blood sample was collected from the caudal vein by cutting off the caudal fin and the fish were finally killed by cutting the brachial arches. Blood was collected in Na-heparinized micro haematocrit tubes and centrifuged at 14 000×g for 2 minutes for determination of haematocrit value (Hct). The fish were then dis-sected and liver, intraperitoneal fat and final parts of viscera removed and weighed for calculation of the hepatosomatic index, viscerosomatic index and intraperitoneal fat ratio. For whole body composition analysis, three fish from each tank were randomly selected.
Chemical analysis
Feeds and fresh carcasses were homogenised (B-400, Büchi Labortechnik AG, Flawil, Switzer-land), freeze-dried and ground through a 1-mm screen (Tecator Cyclotec 1093, Höganäs, Swe-den) and then stored at -25 °C. Feeds and car-casses were analysed for dry matter (DM) (103 °C for 16 h in a well-ventilated oven, cooling in desiccator before weighing) and ash (550 °C for at least 3 h and until the ash had a white colour, cooling in desiccator before weighing), and total nitrogen (N) was determined by the Kjeldahl method using a 2020 digestor and a 2400 Kjeltec Analyser unit (FOSS Analytical A/S, Hilleröd, Denmark). The crude protein content was calcu-lated as N×6.25 (Nordic Committee on Feed Analysis, 1976). Amino acid content of feeds and fish was analysed by high-performance liquid chromatography at a certified laboratory (Eu-rofins Food & Agro Testing Sweden AB, Linkö-ping, Sweden), as described by Llames and Fontaine (1994). Briefly, samples were oxidised with performic acid for 16 h prior to hydrolysis for 23 h with 6N HCl. Individual amino acids were separated on an ion-exchange chromato-graph (Biochrom 30 amino acid analyser, Bio-chrom Ltd., Cambridge, England) and the peaks were identified, integrated and quantified with EZChrom Elite (Biochrom Ltd., Cambridge, England). Crude lipid was determined according to the Official Journal of the European Commu-nities (1984), using a 1047 Hydrolysing Unit and a Soxtec System HT 1043 Extraction Unit (FOSS Analytical A/S, Hilleröd, Denmark). Gross ener-gy was determined with an isoperobol bomb cal-orimeter (Parr 6300, Parr Instrument Company, Moline, IL, USA; Table 3).
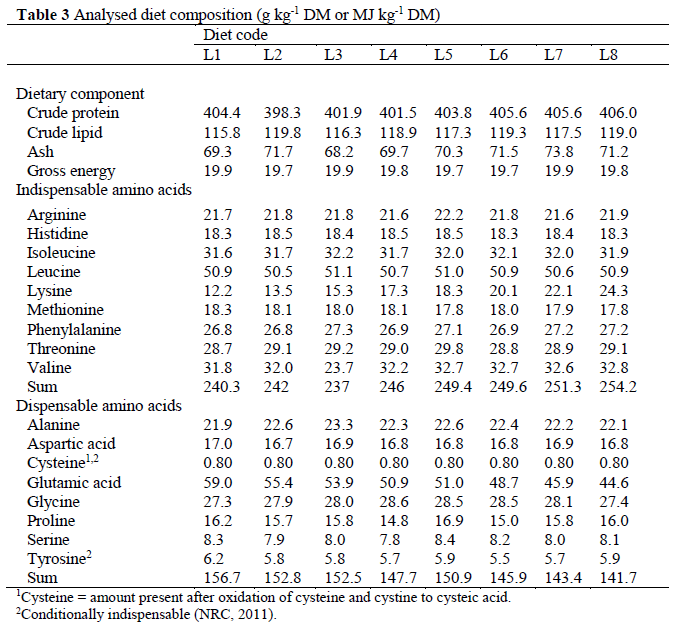
1Cysteine = amount present after oxidation of cysteine and cystine to cysteic acid 2Conditionally indispensable (NRC, 2011) Table 3: Analysed diet composition (g kg-1 DM or MJ kg-1 DM)
Calculations
Weight gain (WG) and specific growth rate (SGR) were used as indicators for growth and protein gain (PG) was used as an indicator for protein utilisation. WG, SGR and PG were calcu-lated according to the following equations:
WG (%)=(FW–IW)×100/IW SGR (% day-1)=(logFW–logIW)×100/day PG (%)=(FW×CPF/100–IW×CPI/100)×100/(IW× CPI/100)
where FW is the final body weight (g), IW is the initial weight (g), CPF is the final crude protein content in the body (%) and CPI is the initial crude protein content in the body (%). The rela-tive weights of liver, intraperitoneal fat and vis-cera were expressed as hepatosomatic index (HSI), viscerosomatic index (VSI) and intraperi-toneal fat (IPF), and were calculated according to the following equations:
HSI (%) = (WLiv/LW)×100 VSI (%) = (WVis/LW)×100 IPF (%) = (WIntrF/LW)×100
where LW is the live weight of the fish (g), WLiv is the weight of the liver (g), WVis is the weight of the viscera (g) and WIntrF is the weight of the in-traperitoneal fat (g).
Statistical analysis
The statistical analysis was conducted using the SAS programme version 9.3 (SAS Institute, Inc, Cary, NC, USA). The effect of fish size on carcass composition of perch fed a commercial diet was evaluated with Proc GLM, with fish size (small, medium and large) as fixed factors. The effect of experimental diet on growth, survival, carcass composition, body indices and haemato-crit value was evaluated with Proc Mixed, fol-lowed by the Tukey’s Multiple Comparison test. The model included the fixed factor of treatment (lysine level) and the random factor of aquarium. The effect of floor was also tested as a fixed fac-tor, but no significant effect was found and it was therefore excluded from the model. When treat-ments L1-L4 were compared with treatments L5-L8 the model included the fixed factor of group. Aquarium was used as the experimental unit for growth performance, body composition and sur-vival, whereas fish was used as the experimental unit for HSI, VSI, IPF and Hct. The level of sig-nificance was set at P<0.05 and a tendency at P<0.10.
Results and Discussion
Whole body analyses of the perch fed the commercial diet showed that large perch had a lower protein content in their body than small and medium-sized perch (P<0.001) (Table 1). The fat and ash content was also lower in large perch than in small and medium-sized perch (P<0.001 and P=0.012, respectively). The lysine content was highest in small fish (P=0.005), as was the content of histidine, leucine and phenyl-alanine.
The fish ate well during the whole experi-ment. A total of 25 fish died (10.4%), but there was no relationship between dietary treatment and mortality. Growth performance, somatic in-dices, survival rate and haematocrit change of ju-venile perch fed the experimental diets are sum-marised in Table 4. The mean final weight was 64.6±16.0 g, with minimum and maximum weights of 35.9 and 114.6 g, respectively. Fish fed diets L6 and L8 had a higher FW (P<0.001) than fish fed diets L1, L2, L3 and L4. There was a tendency for fish fed diet L4 to have a lower FW than fish fed diet L5 (P=0.069). Fish fed the highest inclusion level of lysine had higher WG (P=0.049; Table 4) than fish fed the lowest inclu-sion level. The WG of fish in treatment L4 was unexpected low. The PG was poorer in fish fed diets L1-L4 than in those fed diet L8 (P=0.002; Table 4). SGR did not differ between treatments with the exception of fish fed diets L3 and L8 (P=0.005). However, there was a tendency for fish fed diet L8 to have a higher SGR than fish fed diets L1 and L4 (P=0.057 and P=0.067, re-spectively), and for fish fed diet L3 to have a lower SGR than those fed diets L5 and L6 (P=0.075 and P=0.085, respectively).

Values within the same row having different superscripts are significantly different (P < 0.05) Data are presented as least square means. s.e. = pooled standard error Abbreviations: WG, weight gain; PG, protein gain; SGR, specific growth rate; HSI, hepatosomatic index; VSI viscerosomatic index; IPF, intraperitoneal fat and Hct, haema-tocrit value Table 4: Growth, survival, somatic indices and haematocrit value of Eurasian perch fed diets containing graded levels of lysine
Comparison between treatments L1-L4 and treatments L5-L8 resulted in significant differ-ences in FW (51.6 vs. 69.7 g), WG (44.9 vs. 65.4%), PG (27.5 vs. 47.9%) and SGR (0.44 vs. 0.60% day-1) (P<0.001 for all).
Fish fed diets L5, L6 and L8 had a lower HSI than fish fed diets L1 and L4 (P=0.001). Fish fed diets L5-L8 had a lower VSI than fish fed diet L1 (P=0.043). There was no effect of dietary treat-ment on IPF and Hct. When treatments L1-L4 were compared with treatments L5-L8 significant differences in HSI (2.8 vs. 2.3) and VSI (11.1 vs. 10.4%) (P<0.001 and P=0.004 respectively) were observed.
Feeding juvenile perch the experimental diets did not affect (P>0.05) the whole body composi-tion. Across treatments, the body composition was: DM (g kg-1) 282.2±19.8 (P=0.622, s.e.=1.21); crude protein (g kg-1 DM): 675.5±12.0 (P=0.683, s.e.=0.79); crude lipid (g kg-1 DM): 125.7±7.8 (P=0.836, s.e.=0.46) and ash (g kg-1 DM): 216.4±8.0 (P=0.255, s.e.=0.52).
The average IAA composition in the whole body of fish from all groups fed the commercial diets were calculated and are presented together with published values for yellow perch, rainbow trout (Oncorhynchur mykiss) and Arctic charr (Alpinus salvelinus). Based on the values from the present study, the IAA requirements of Eura-sian perch were estimated using the ideal protein concept (Table 5).

1Data from present study 2Data from Ramseyer and Garling (1994) 3Data from Arai (1981) 4Data from Gurure et al. (2007) 5Conditionally indispensable (NRC, 2011) Table 5: Indispensable amino acid content (g kg-1 DM) in whole body of Eurasian perch, yellow perch, rainbow trout and Arctic charr, and estimated IAA requirements of Eurasian perch using the ideal protein concept
In our study fish fed 18.3 g lysine kg-1 DM or more had a higher weight gain (WG) and protein gain (PG) than fish fed diets containing less ly-sine. The response in WG and PG to increasing lysine content in the diet was not proportional at the lowest levels of inclusion. In addition, there were large variations in growth response between replicates which may be related to poor feed in-take in individual fish within replicates. Undo-mesticated perch is sensitive towards stress, which may reduce growth due to the increased energy consumption and a lower feed intake (Jentoft et al., 2005; Strand et al., 2007). Thus, due to large variation between replicates and few replicates we were unable to get an acceptable fit of our data to the broken line model or the satura-tion kinetic model for WG and PG as a function of lysine level. However, the lowest lysine level (18.3 g kg-1 DM) resulting in improved protein gain in our study was slightly lower compared with values reported for other species; 20.0 and 22.0 g kg-1 DM in Atlantic salmon (Salmo salar, Anderson et al., 1993; Espe et al., 2007); 21.0 g kg-1 DM in Asian sea bass (Lates calcarifer, Murillo-Gurrea et al., 2001); 20.0 g kg-1 DM in milkfish (Chanos chanos, Borlongan and Benitez, 1990) and 23.2 g kg-1 DM in silver perch (Bidyanus bidyanus, Yang et al., 2011). Howev-er, the value found in the present study is higher than the dietary lysine requirement reported for hybrid striped bass (Morone chrysops X M. sax-atilis); 14.0 g kg-1 DM (Griffin et al., 1992) and Nile tilapia (Oreochromis niloticus); 14.3 g kg-1 diet (Santiago and Lovell, 1988). It is possible that our estimate of the dietary lysine require-ments could be slightly overestimated as the uti-lization of crystalline amino acids can be lower than the utilization of protein-bound amino acids. However, on the contrary, if the fish did not reach their maximum growth capacity, the ob-tained requirement might be slightly underesti-mated. Therefore, the result from this study needs to be verified under practical conditions.
Several authors have reported that protein uti-lisation is a more sensitive parameter of dietary lysine deficiency than weight gain (Gahl et al., 1991; Rodehutscord et al., 1997; Encarnacao et al., 2004; Grisdale-Helland et al., 2011). In addi-tion to protein, body weight gain includes lipids, ash and water, which will affect the precision of the estimates if the retention of these compounds differs between treatments. Gahl et al. (1995) demonstrated that for pigs, the responses in pro-tein and lysine gain approached a plateau at a considerably higher level (120 or 145% of the es-timate lysine requirement) than the response in weight gain, which was observed at approximate-ly 100% of estimated lysine requirement. A high-er response in protein and lysine gain compared with weight gain has also been reported in Atlan-tic salmon (Grisdale-Helland et al., 2011), but not in rainbow trout (Kim et al., 1992b), black sea bream (Sparus macrocephalus; Zhou et al., 2010) or grass carp (Ctenopharyngodon idella; Wang et al., 2005). However, in the present study, the correlation between dietary lysine con-tent and protein gain (r = 0.50) was similar to that of weight gain (r = 0.48).
The SGR in the present study varied between 0.41 and 0.63% day-1, which is an acceptable growth rate. Few studies have been published re-garding SGR of Eurasian perch of the same size as used here (mean initial weight = 41.7 g). A SGR of 0.5% day-1 for 15.8-22.7 g perch housed under similar conditions as in the present study was reported by Melard et al. (1996); Kestemont et al. (2001) and Fiogbe and Kestemont (2003). Furthermore, Cho et al. (1992) and Kim et al. (1992a; b) obtained acceptable growth with diets containing high levels of crystalline amino acids. However, Peres and Oliva-Teles (2005) showed that if high levels of dietary protein (more than 19%) were replaced with crystalline amino acids in juvenile turbot (Scophthalmus maximus) diets the growth performance was depressed. It has been shown in several fish species that crystalline amino acids are more rapidly absorbed, and/or absorbed earlier in the alimentary canal than pro-tein-bound amino acids (Yamada et al., 1981b; Kaushik and Dabrowski, 1983; Cowey and Walton, 1988; Zarate and Lovell, 1997; Zarate et al., 1999). This might lead to a slight metabolic dyssynchrony with amino acids derived from protein digestion and a greater proportion of the crystalline amino acids being catabolised, proba-bly resulting in a temporarily higher concentra-tion of amino acids in tissues or plasma (Cowey and Walton, 1988; Zarate et al., 1999). To avoid this metabolic dyssynchrony in our study, the feed was provided at very short time intervals. Yamada et al. (1981a) showed that more frequent feeding intervals increase weight gain and meta-bolic utilisation of crystalline amino acids in common carp (Cyrpinus carpio). In contrast, Zarate et al. (1999) did not notice any interac-tions between protein-bound lysine and crystal-line lysine fed at different feeding frequencies to channel catfish (Ictalarus punctatus).
The experimental diets in the present study were formulated according to diets previously used to yellow perch by Twibell and Brown (1997), in which casein and gelatine were used as sources of intact protein. The diets were formu-lated to give a high feed intake and a good growth rate, and to contain the maximum level of fish meal to maximise palatability without ex-ceeding the lowest target level of the total lysine content in the experimental diets. Brown et al. (1993; 1996) reported low feed intake for puri-fied diets containing no or low levels of fish meal and fish oil in experiments with hybrid striped bass and yellow perch, respectively. In addition, Peres and Oliva-Teles (2005) reported that the voluntary feed intake was lower for juvenile tur-bot fed diets with high level of crystalline amino acids. However, the feed in the present study was not rejected by the fish, but the feed intake was lower than in earlier experiments with Eurasian perch fed commercial or fish meal-based diets (Langeland, unpublished data). This lower intake was probably due to some unpalatable feed in-gredients. Eurasian perch seems to be sensitive to the palatability of the feed and therefore this should be taken into consideration when formu-lating semi-purified diets for perch. However, Twibell and Brown (1997) stated that a purified diet remains an appropriate choice for determin-ing nutritional requirements.
The body composition of perch fed the exper-imental diets did not differ between groups. This is in line with results from studies in other fish species fed graded levels of lysine (Borlongan and Benitez, 1990; Peres and Oliva-Teles, 2008), indicating that dietary lysine does not affect body composition. However, Kim et al. (1992b), Encarnacao et al. (2004) and Marcouli et al. (2006) found a positive correlation between ly-sine intake and body protein content in fish fed lysine-deficient diets. The ideal amino acid pro-file of Eurasian perch was compared with that of yellow perch and with the mean value for 10 tel-eost fish species (Figure 1). The IAA profile of Eurasian perch is very similar to that of yellow perch, but differs from that of rainbow trout and Arctic charr. However, in the present study the viscera was excluded from the whole body analy-sis, whereas in the reported studies the viscera was included. Thus, this may affect the compari-son with other species.
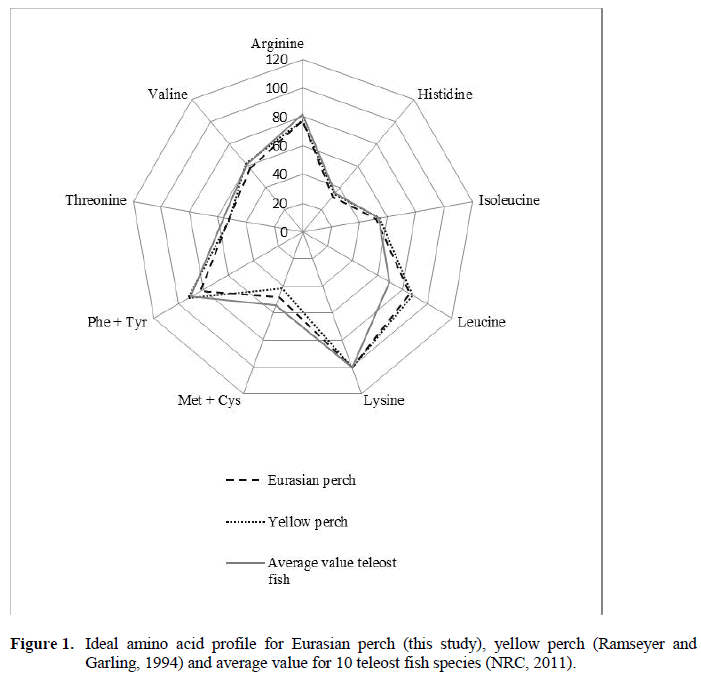
Figure 1: Ideal amino acid profile for Eurasian perch (this study), yellow perch (Ramseyer and Garling, 1994) and average value for 10 teleost fish species (NRC, 2011).
A lower HSI in fish fed diets with high levels of lysine compared to fish fed lysine-deficient diets has been reported by several authors for dif-ferent fish species; European sea bass (Dicentrarchus labrax, Tibaldi et al., 1994), gilt-head sea bream (Sparus aurata, Marcouli et al., 2006), turbot (Peres and Oliva-Teles, 2008) and silver perch (Yang et al., 2011). In the present study HSI was lower in fish fed the highest level of lysine than in fish fed the lowest level of ly-sine. Between the other treatments no clear pat-tern could be observed. The higher levels of HSI found in the fish fed low lysine level diets might be due to lysine limitation in protein synthesis. The AA which are not used to deposit protein are deaminated and metabolised to lipids or glycogen and stored in the liver. In this experiment the Hct value was unaffected by different levels of lysine. In contrast, Yang et al. (2011) showed that the Hct value in silver perch was lower in fish fed lysine-deficient diets.
Conclusions
The estimated minimum dietary lysine re-quirement for optimal weight gain and protein gain of juvenile Eurasian perch appears reasona-ble compared with other published data on Atlan-tic salmon, Asian sea bass, milkfish and silver perch. However, before the predicted dietary IAA requirements of Eurasian perch presented in this paper could be used as a general recommendation for feed formulation the result should be verified in further studies.
Acknowledgement
This research was supported by the Faculty of Veterinary Medicine and Animal Science at the Swedish University of Agricultural Sciences and by Formas (Swedish Research Council for Envi-ronment, Agricultural Sciences and Spatial Plan-ning). Special thanks to Jens-Erik Zerrahn at Evonik Degussa International AG for supplying the crystalline amino acids and for a fruitful dis-cussion about this work. Thanks also to Aleksan-dar Vidakovic for assistance with maintenance of the experiment.
268
References
- Anderson, J.S., Lall, S.P., Anderson, D.M., Mcniven, M.A., (1993). Quantitative Dietary Lysine Requirement of Atlantic Salmon (Salmosalar) Fingerlings, CanadianJournal of Fisheries and Aquatic Sciences, 50: 316-322. doi: 10.1139/f93-037
- nArai, S., (1981). A Purified Test Diet for Coho Salmon, Oncorhynchuskisutch, Fry, Bulletin of the Japanese Society of Scientific Fisheries, 47: 547-550.doi: 10.2331/suisan.47.547
- nBorlongan, I.G., Benitez, L.V., (1990). Quantitative Lysine Requirement of Milkfish (Chanos chanos) Juveniles, Aquaculture, 87: 341-347.doi: 10.1016/0044-8486(90)90071-T
- nBrown, P.B., Griffin, M.E., White, M.R., (1993). Experimental and Practical Diet Evaluations with Juvenile Hybrid Striped Bass, Journal of the World Aquaculture Society, 24: 80-89.doi: 10.1111/j.1749-7345.1993.tb00153.x
- nBrown, P.B., Dabrowski, K., Garling, D.L., (1996). Nutrition and feeding of yellow perch (Percaflavescens), Journal of Applied Ichthyology, 12: 171-174.doi: 10.1111/j.1439-0426.1996.tb00084.x
- nCho, C.Y., Kaushik, S., Woodward, B., (1992). Dietary Arginine Requirement of Young Rainbow-Trout (Oncorhynchusmykiss), Comparative Biochemistry and Physiology a-Physiology, 102: 211-216
- nCowey, C.B., Walton, M.J., (1988). Studies on the Uptake of (C-14) Amino-Acids Derived from Both Dietary (C-14) Protein and Dietary (C-14) Amino-Acids by Rainbow-Trout, Salmo-gairdneri Richardson, Journal of Fish Biology, 33: 293-305.doi: 10.1111/j.1095-8649.1988.tb05472.x
- nEncarnacao, P., de Lange, C., Rodehutscord, M., Hoehler, D., Bureau, W., Bureau, D.P., (2004). Diet digestible energy content affects lysine utilization, but not dietary lysine requirements of rainbow trout (Oncorhynchusmykiss) for maximum growth, Aquaculture, 235: 569-586.doi: 10.1016/j.aquaculture.2004.01.001
- nEspe, M., Lemme, A., Petri, A., El-Mowafi, A., (2007). Assessment of lysine requirement for maximal protein accretion in Atlanticsalmon using plant protein diets, Aquaculture, 263: 168-178.doi: 10.1016/j.aquaculture.2006.10.018
- nFiogbe, E.D., Kestemont, P., (2003). Optimum daily ration for Eurasian perch Percafluviatilis L. reared at its optimum growing temperature, Aquaculture, 216: 243-252. Pii S0044-8486(02)00409-X
- nFiogbe, E.D., Kestemont, P., Melard, C., Micha, J.C., (1996). The effects of dietary crude protein on growth of the Eurasian perch Percafluviatilis, Aquaculture, 144: 239-249.doi: 10.1016/S0044-8486(96)01293-8
- nFuruya, W.M., Pezzato, L.E., Barros, M.M., Pezzato, A.C., Furuya, V.R.B., Miranda, E.C., (2004). Use of ideal protein concept for precision formulation of amino acid levels in fish-meal-free diets for juvenile Nile tilapia (Oreochromis niloticus L.), Aquaculture Research. 35, 1110-1116.doi: 10.1111/j.1365-2109.2004.01133.x
- nGahl, M.J., Crenshaw, T.D., Benevenga, N.J., (1995). Diminishing Returns in Weight, Nitrogen, and Lysine Gain of Pigs Fed 6 Levels of Lysine from 3 Supplemental Sources, Journal of Animal Science, 72: 3177-3187
- nGahl, M.J., Finke, M.D., Crenshaw, T.D., Benevenga, N.J., (1991). Use of a four-parameter logistic equation to evaluate the response of growing rats to ten levels of each indispensable amino acid, Journal of Nutrition, 121: 1720-1729
- nGreen, J.A., Hardy, R.W., (2002). The optimum dietary essential amino acid pattern for rainbow trout (Oncorhynchusmykiss), to maximize nitrogen retention and minimize nitrogen excretion, Fish Physiology and Biochemistry, 27: 97-108.doi: 10.1023/B:FISH.0000021878.81647.6e
- nGriffin, M.E., Brown, P.B., Grant, A.L., (1992). The Dietary Lysine Requirement of Juvenile Hybrid Striped Bass, Journal of Nutrition, 122: 1332-1337
- nGrisdale-Helland, B., Gatlin, D.M., Corrent, E., Helland, S.J., (2011). The minimum dietary lysine requirement, maintenance requirement and efficiency of lysine utilization for growth of Atlantic salmonsmolts, Aquaculture Research, 42: 1509-1529.doi: 10.1111/j.1365-2109.2010.02743.x
- nGurure, R., Atkinson, J., Moccia, R.D., (2007). Amino acid composition of Arctic charr, Salvelinusalpinus (L.) and the prediction of dietary requirements for essential amino acids, Aquaculture Nutrition, 13: 266-272.doi: 10.1111/j.1365-2095.2007.00473.x
- nHart, S.D., Brown, B.J., Gould, N.L., Robar, M.L., Witt, E.M., Brown, P.B., (2010). Predicting the optimal dietary essential amino acid profile for growth of juvenile yellow perch with whole body amino acid concentrations, Aquaculture Nutrition, 16: 248-253 doi: 10.1111/j.1365-2095.2009.00659.x
- nHauler, R.C., Carter, C.G., (2001). Lysine deposition responds linearly to marginal lysine intake in Atlantic salmon (Salmosalar L.) parr, Aquaculture Research, 32: 147-156 doi: 10.1046/j.1355-557x.2001.00012.x
- nJentoft, S., Aastveit, A.H., Torjesen, P.A., Andersen, Ø., (2005). Effects of stress on growth, cortisol and glucose levels in non-domesticated Eurasian perch (Percafluviatilis) and domesticated rainbow trout (Oncorhynchusmykiss), Comparative Biochemistry and Physiology - Part A: Molecular & Integrative Physiology, 141: 353-358.doi: 10.1016/j.cbpb.2005.06.006
- nKaushik, S.J., Dabrowski, K., (1983). Nitrogen and Energy-Utilization in Juvenile Carp (Cyprinuscarpio) Fed Casein, Amino-Acids or a Protein-Free Diet, Reproduction Nutrition Development, 23: 741-754 doi: 10.1051/rnd:19830507
- nKestemont, P., Dabrowski, K., (1996). Recent Advances in the Aquaculture of Percid Fish, Journal of Applied Ichthyology, 12: 137-200.doi: 10.1111/j.1439-0426.1996.tb00078.x
- nKestemont, P., Vandeloise, E., Mélard, C., Fontaine, P., Brown, P.B., (2001). Growth and nutritional status of Eurasian perch Percafluviatilis fed graded levels of dietary lipids with or without added ethoxyquin, Aquaculture, 203: 85-99.doi: 10.1016/s0044-8486(01)00615-9
- nKim, K., Kayes, T.B., Amundson, C.H., (1992a). Requirements for sulfur amino acids and utilization of D-methionine by rainbow trout (Onchorhunchusmykiss), Aquaculture, 101: 95-103.doi: 10.1016/0044-8486(92)90235-D
- nKim, K.I., Kayes, T.B., Amundson, C.H., (1992b). Requirements for Lysine and Arginine by Rainbow Trout (OncorhynchusMykiss), Aquaculture, 106: 333-344.doi: 10.1016/0044-8486(92)90265-M
- nKwasek, K., Dabrowski, K., Ware, K., Reddish, J.M., Wick, M., (2012). The effect of lysine-supplemented wheat gluten-based diet on yellow perch Percaflavescens (Mitchill) performance, Aquaculture Research, 43: 1384-1391.doi: 10.1111/j.1365-2109.2011.02941.x
- nLlames, C.R., Fontaine, J., (1994). Determination of Amino-Acids in Feeds - Collaborative Study, Journal of Aoac International, 77: 1362-1402
- nMarcouli, P.A., Alexis, M.N., Andriopoulou, A., Iliopoulou-Georgudaki, J., (2006). Dietary lysine requirement of juvenile gilthead seabreamSparusaurata L., Aquaculture Nutrition, 12: 25-33. Doi: 10.1111/j.1365-2095.2006.00378.x
- nMelard, C., Kestemont, P., Grignard, J.C., (1996). Intensive culture of juvenile and adult Eurasian perch (P fluviatilis): Effect of major biotic and abiotic factors on growth, Journal of Applied Ichthyology-Zeitschrift Fur AngewandteIchthyologie, 12: 175-180.doi: 10.1111/j.1439-0426.1996.tb00085.x
- nMurillo-Gurrea, D.P., Coloso, R.M., Borlongan, I.G., Serrano, A.E., (2001). Lysine and arginine requirements of juvenile Asian sea bass (Latescalcarifer), Journal of Applied Ichthyology, 17: 49-53.doi: 10.1046/j.1439-0426.2001.00242.x
- nNordic Committee on Feed Analysis, (1976). Determination in feeds and faeces accordingto Kjeldahl, No 6, 3 ed. NMKL, Oslo, Norway
- nNRC, (2011). Nutrient Requirements of Fish and Shrimp. The National Academies Press, Washington DC, USA
- nPeres, H., Oliva-Teles, A., (2005). The effect of dietary protein replacement by crystalline amino acid on growth and nitrogen utilization of turbot Scophthalmusmaximus juveniles, Aquaculture, 250: 755-764.doi: 10.1016/j.aquaculture.2005.04.046
- nPeres, H., Oliva-Teles, A., (2008). Lysine requirement and efficiency of lysine utilization in turbot (Scophthalmusmaximus) juveniles, Aquaculture, 275: 283-290. doi: 10.1016/j.aquaculture.2007.12.015
- nRamseyer, Garling, (1998). Effects of dietary protein to metabolizable energy ratios and total protein concentrations on the performance of yellow perch Percaflavescens, Aquaculture Nutrition, 4: 217-223.doi: 10.1046/j.1365-2095.1998.00061.x
- nRamseyer, L.J., Garling, D.L., (1994). Amino-Acid-Composition of the Ovaries, Muscle, and Whole-Body of Yellow Perch, Progressive Fish-Culturist, 56: 175-179.doi: 10.1577/1548-8640(1994)056<0175:AACOTO>2.3.CO;2
- nRodehutscord, M., Becker, A., Pack, M., Pfeffer, E., (1997). Response of rainbow trout (Oncorhynchusmykiss) to supplements of individual essential amino acids in a semipurified diet, including an estimate of the maintenance requirement for essential amino acids, Journal of Nutrition, 127: 1166-1175
- nRollin, X., Mambrini, M., Abboudi, T., Larondelle, Y., Kaushik, S.J., (2003). The optimum dietary indispensable amino acid pattern for growing Atlantic salmon (Salmosalar L.) fry, British Journal of Nutrition, 90: 865-876.doi: 10.1079/BJN2003973
- nSantiago, C.B., Lovell, R.T., (1988). Amino-Acid Requirements for Growth of Nile Tilapia, Journal of Nutrition, 118: 1540-1546
- nSchaeffer, T.W., Brown, M.L., Rosentrater, K.A., (2011). Effects of Dietary Distillers Dried Grains with Solubles and Soybean Meal on Extruded Pellet Characteristics and Growth Responses of Juvenile Yellow Perch, North American Journal of Aquaculture, 73: 270-278.doi: 10.1080/15222055.2011.593461
- nStrand, Å.,Magnhagen, C., Alanärä, A., (2007). Effects of repeated disturbances on feed intake, growth rates and energy expenditures of juvenile perch, Percafluviatilis, Aquaculture, 265: 163-168. 10.1016/j.aquaculture.2007.01.030
- nTibaldi, E., Tulli, F., Lanari, D., (1994). Arginine Requirement and Effect of Different Dietary Arginine and Lysine Levels for Fingerling Sea Bass (Dicentrarchuslabrax), Aquaculture, 127: 207-218.doi: 10.1016/0044-8486(94)90427-8
- nTwibell, R.G., Brown, P.B., (1997). Dietary arginine requirement of juvenile yellow perch, Journal of Nutrition, 127: 1838-1841
- nTwibell, R.G., Wilson, K.A., Brown, P.B., (2000). Dietary sulfur amino acid requirement of juvenile yellow perch fed the maximum cystine replacement value for methionine, Journal of Nutrition, 130: 612-616
- nWang, S., Liu, Y.H., Tian, L.X., Xie, M.Q., Yang, H.J., Wang, Y., Liang, G.Y., (2005). Quantitative dietary lysine requirement of juvenile grass carp Ctenopharyngodon idella, Aquaculture, 249: 419-429.doi: 10.1016/j.aquaculture.2005.04.005
- nWilson, R.P., Cowey, C.B., (1985). Amino-Acid Composition of Whole-Body Tissue of Rainbow-Trout and Atlantic Salmon, Aquaculture, 48: 373-376. doi: 10.1016/0044-8486(85)90140-1
- nYamada, S., Tanaka, Y., Katayama, T., (1981a). Feeding Experiments with Carp Fry Fed an Amino-Acid Diet by Increasing the Number of Feedings Per Day, Bulletin of the Japanese Society of Scientific Fisheries, 47: 1247-1247.doi: 10.2331/suisan.47.631
- nYamada, S., Simpson, K.L., Tanaka, Y., Katayama, T., (1981b). Plasma Amino-Acid Changes in Rainbow-Trout Salmogairdneri Force-Fed Casein and a Corresponding Amino-Acid Mixture, Bulletin of the Japanese Society of Scientific Fisheries, 47: 1035-1040.doi: 10.2331/suisan.47.1035
- nYang, S.-D., Liu, F.-G., Liou, C.-H., (2011). Assessment of dietary lysine requirement for silver perch (Bidyanusbidyanus) juveniles, Aquaculture, 312: 102-108.doi: 10.1016/j.aquaculture.2010.12.011
- nZarate, D.D., Lovell, R.T., (1997). Free lysine (L-lysine center dot HCl) is utilized for growth less efficiently than protein-bound lysine (soybean meal) in practical diets by young channel catfish (Ictaluruspunctatus), Aquaculture, 159: 87-100.doi: 10.1016/S0044-8486(97)00184-1
- nZarate, D.D., Lovell, R.T., Payne, M., (1999). Effects of feeding frequency and rate of stomach evacuation on utilization of dietary free and protein-bound lysine for growth by channel catfish Ictaluruspunctatus, Aquaculture Nutrition, 5: 17-22.doi: 10.1046/j.1365-2095.1999.00083.x
- nZhou, F., Shao, J., Xu, R., Ma, J., Xu, Z., (2010). Quantitative l-lysine requirement of juvenile black sea bream (Sparusmacrocephalus), Aquaculture Nutrition, 16: 194-204.doi: 10.1111/j.1365-2095.2009.00651.x
