Keywords
Reservoir; Fisheries
Introduction
Historically, the Black Hills of South Dakota supported no trout of the family Salmonidae (Cordes, 2007). Stocking of various salmonids began in the late 1800’s to provide recreational fisheries. While not native to the Black Hills of South Dakota, introduced rainbow trout Oncorhynchus mykiss have demonstrated the ability to become naturalized in the aquatic systems of the region (James, 2011; Davis et al., 2013a; Kientz, 2016).
Rainbow trout exhibit a variety of life history strategies, including anadromous (steelhead), fluvial, and resident forms (Behnke, 1992; Meka et al., 2003). Additionally, adfluvial movements (movement from lakes into tributaries) by rainbow trout populations have been observed (Van Velson, 1974; Downs, 2000). Spawning within tributaries has been well documented for nonanadromous salmonids (Thurow and King, 1994; Schmeterling, 2000). Rainbow trout successfully move and spawn in tributaries of the Kootenai River, Idaho from Kootenay Lake (Downs, 2000). (Van Velson, 1974) observed movement by resident rainbow trout from Lake McConaughy, Nebraska into the tributary system above.
Environmental cues often play a large role in determining movement patterns. Spawning movements by rainbow trout to coincide with spring discharge has been observed in tributaries (Holecek and Walters, 2007). Seasonal changes in day length (photoperiod) also may synchronize spawning runs by rainbow trout during similar temporal timeframes (Bromage et al., 1984). Western trout species such as rainbow and cutthroat trout Oncorhynchus clarkii evolved to spawn during spring in response to increases in water temperature (Behnke, 1992).
Davis et al., (2013a) documented the adfluvial movements of three strains of hatchery reared and resident rainbow trout in the Deerfield Reservoir system. Deerfield Reservoir is managed as a put-and-take rainbow trout fishery. Annually, Deerfield is stocked with 12,000 rainbow trout of three unique strains; Shasta, McConaughy, and Erwin. While adfluvial movements were observed, the drivers of these movements remain poorly understood. Thus, the objective of this study was to examine the influence of environmental variables on the timing of movement by rainbow trout in the Deerfield Reservoir system.
Materials and Methods
This study was conducted in Deerfield Reservoir, South Dakota and within the upstream Castle Creek tributary system. Passive integrated transponder (PIT) tag technology was used to assess adfluvial movements made by hatcheryreared and resident rainbow trout between Deerfield Reservoir and Castle Creek.
Deerfield Reservoir was stocked with 2,000 Rainbow Trout monthly from May to October. Each strain was stocked for two consecutive months at a rate of 2,000 fish/ month; resulting in a total of 4,000 rainbow trout of each strain stocked into the reservoir. Three hundred rainbow trout in each stocking were implanted with PIT tags, totaling 600 tagged fish for each strain (Table 1). Implantation of PIT tags into hatchery-reared rainbow trout occurred at McNenny State Fish Hatchery (13 km west of Spearfish, South Dakota) from April to July 2010. Resident rainbow trout from Deerfield Reservoir were captured (n=250) using modified fyke nets (1.3x1.5-m frame, 19.1-mm bar mesh) and a 1.2x23 m lead, in spring of 2010. These resident rainbow trout were of unknown natal origin (i.e., hatcheryreared or naturally reproduced). All fish were greater than 100 mm total length (TL) and tagged with half-duplex tags (23.1-mm long, 3.9-mm diameter, weighing 0.6 g in air and manufactured by Texas Instruments, Inc.). Rainbow trout tagged in the hatchery were individually anesthetized with either MS-222, Benzoac, or Aqui-SE in conjunction with another study (Davis et al., 2013b). Rainbow trout captured in Deerfield Reservoir were anesthetized with carbon dioxide. Fish were individually anesthetized, a 0.5-cm incision was made on the ventral surface near the pelvic fin, a PIT tag was inserted into the body cavity, and the incision was closed with a dissolvable surgical suture. Triadine was used to sterilize tags, sutures, and all surgical instruments. The PIT tagging and surgical technique followed the procedures outlined by (Roussel et al., 2000).
Table 1: 2010 monthly stocking schedule for Deerfield Reservoir and number of fish implanted with passive integrated transponder (PIT) tags for each stocking.
| Month |
Strain |
# Stocked |
# PIT Tagged |
| May |
Shasta |
2,000 |
300 |
| June |
Shasta |
2,000 |
300 |
| July |
McConaughy |
2,000 |
300 |
| August |
McConaughy |
2,000 |
295 |
| September |
Erwin |
2,000 |
300 |
| October |
Erwin |
2,000 |
301 |
A passive monitoring station was installed in Castle Creek above Deerfield Reservoir during August of 2010 and operated through August 2011. The station was constructed approximately 100 m upstream from the Castle Creek inlet to detect initial adfluvial movements by tagged fish (Figure 1). Two additional stations were deployed to observe continued upstream movement in conjunction with another study. Antennae were constructed as open-coil inductor loops with 8-gauge multistrand wire. To encircle the stream, wire passed through 2.5 cm-diameter PVC pipe secured to the streambed by multiple cinderblocks and suspended over the water with the support of aircraft cable stretched across the stream channel. Each antenna was connected to a radio frequency identification (RFID) half-duplex single antenna reader powered by two sealed 12 V, deep-cycle marine batteries (100 amp-h battery) connected in parallel. A palmtop computer was used to download output data from the readers and display individual tag identification, date, and time of detections. In addition, the frequency of scans made by the reader and minimum voltage required for operation could be adjusted by the computer to accommodate for variable environmental conditions affecting battery life (i.e., temperature). Weather-proof reader boxes and batteries were placed in vertical culverts located outside of the immediate flood zone and locked to prevent tampering. Once data were collected, they were converted to Microsoft Excel files and exported to a database for analysis.
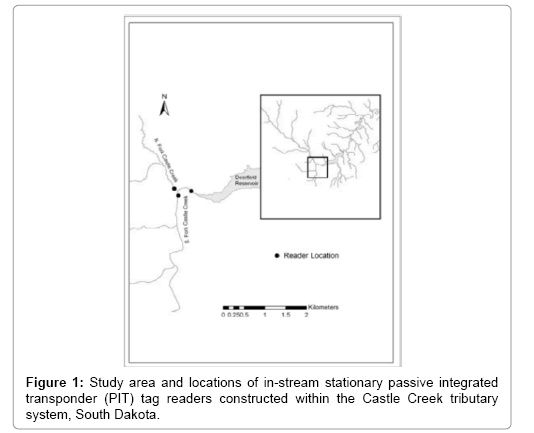
Figure 1: Study area and locations of in-stream stationary passive integrated transponder (PIT) tag readers constructed within the Castle Creek tributary system, South Dakota.
Tag detection by the reader was tested after initial installation and at intervals throughout the monitoring. Immediately following installation, a PIT tag attached parallel to a wooden rod was passed through the antenna at multiple, evenly-spaced distances perpendicular to the stream bank. A speaker was attached to the reader box and an audible chirp was emitted when the tag was detected by the antenna. The tag was also manually submerged and passed through the antenna approximately 10 cm from the bottom of the stream bed at evenly-spaced distances. Following data collection the process described above was applied to ensure accurate tag detection on a bimonthly basis.
Once the station was installed, tagged fish were detected as they passed through the antenna loop. When possible, data were retrieved and batteries were changed biweekly. During the study period we also collected data on water temperature, photoperiod, and discharge in Castle Creek. Discharge data were obtained from the United States Geological Survey (USGS) gauging station 06409000 in Castle Creek above Deerfield Reservoir. Temperature data were collected using a HOBO water temperature pro v2 data logger (Onset Computer, Bourne, Massachusetts). Photoperiod data were collected via internet. Weekly number of fish detected by the reader between March 25 and July 23, 2001 was used for analysis in addition to mean weekly water temperature, photoperiod, and discharge.
Analysis of covariance (ANCOVA) was used to determine if separate analyses were necessary for the individual strains and resident fish. Correlation analysis was conducted to examine the relationship between water temperature, photoperiod, and discharge. To examine variables explaining the variance in movement of Rainbow Trout, 7 models were created using water temperature, photoperiod, discharge, and any combination of the three variables. Akaike’s information criterion (AIC; Burnham and Anderson, 2002) was used to compare models. The most parsimonious model was determined based on the lowest AICc score, while models with Δi values <2 were also supported (Burnham and Anderson, 2002). Statistical analysis (α=0.05) was conducted using SAS 9.3 (SAS Institute Inc., Cary, NC, USA).
Results
Out of 2,046 tagged rainbow trout, a total of 159 (7.8%) were detected by the passive reader moving into the Castle Creek tributary system. Peak movement by all three strains and resident rainbow trout was observed during the week of May 29, 2011- June 4, 2011 (Figure 2). The greatest numbers of fish detected, by strain, were McConaughy (N=103), followed by Erwin (N=33), Shasta (N=15) and Deerfield residents (N=8).
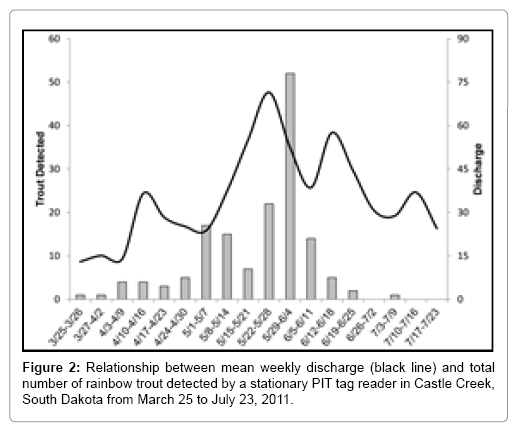
Figure 2: Relationship between mean weekly discharge (black line) and total number of rainbow trout detected by a stationary PIT tag reader in Castle Creek, South Dakota from March 25 to July 23, 2011.
Using ANCOVA no significant differences were found in the slopes of time or strain (p=1.00) indicating that all tagged rainbow trout strains and resident rainbow trout moved in a similar temporal pattern, while additional analysis indicated that the different strains and resident trout moved in different quantities over time (p<0.05). The focus of this study was to evaluate how rainbow trout respond to environmental factors rather than the quantity of fish moving. Since all strains moved in a similar temporal pattern, all hatchery-reared and resident rainbow trout were pooled for the correlation and regression analyses.
Movement of rainbow trout was more highly correlated to changes in discharge (r=0.47, p<0.05) than photoperiod (r=0.25) or water temperature (r=-0.02). The three independent variables had varying degrees of correlation with each other, where photoperiod was positively correlated with temperature (r=0.86, p<0.001) and discharge (r=0.66, p=0.003).
Discharge was the top supported model for explaining the variation in rainbow trout movement (Table 2). The temperature and photoperiod models were also supported based on Δi values less than 2. Discharge and photoperiod explained 22% and 6% of the variation in rainbow trout movement, respectively. While temperature was a supported model, it explained very little variation in rainbow trout movement (<1%). Models including any combination of variables were not supported.
Table 2: Models explaining variation in rainbow trout movement. Variables considered in the models were discharge, photoperiod (photo), and water temperature (temp). Model fit was assessed using the Akaike information criterion (AIC), and Δi is the difference between the AICc of the candidate model and the model with the lowest AICc. The best fit model had the lowest AICc value and models with Δi values < 2 were considered supported.
| Model |
AICc |
Δi |
R2 |
| Discharge |
45.03 |
0.0000 |
0.2234 |
| Photo |
46.49 |
1.4526 |
0.0649 |
| Temp |
47.01 |
1.9735 |
0.0004 |
| Temp + Photo |
47.76 |
2.7276 |
0.2840 |
| Temp + Discharge |
47.96 |
2.9279 |
0.2655 |
| Photo + Discharge |
48.34 |
3.3065 |
0.2290 |
| Temp + Photo + Discharge |
51.30 |
6.2675 |
0.3183 |
Discussion and Conclusion
This study demonstrates the complex nature of fish behavior and the way fish respond to their environment. With the inclusion of supported models, a large portion of variability in rainbow trout movement in the Deerfield Reservoir system remains unexplained. While discharge may be useful in predicting the movement of rainbow trout, further research is necessary to more accurately predict these movements.
Annually, three strains of rainbow trout are stocked into Deerfield Reservoir; Shasta in May and June, McConaughy in July and August, and Erwin in September and October. This stocking regime results in the Shasta and McConaughy strains being subject to longer periods of harvest prior to the following spring when compared to the Erwin strain. Due to these differences, variation in the number of fish per strain detected by the PIT tag reader was expected. For this reason, the decision to pool hatchery-reared and resident rainbow trout for analysis was based on ANCOVA results showing a similar temporal pattern of movement among all tagged trout.
It was hypothesized that movement of rainbow trout during this study would be significantly related to discharge as water flow has shown to be an important factor in initiating movement of various fishes (Jonsson, 1991; Jonsson et al., 1990) found that the number of ascending adult Atlantic salmon Salmo salar increased with increasing discharge. Similarly, increased stream levels in Deer Creek Junior, Washington resulted in increased ascensions of female coho salmon Oncorhynchus kisutch (van den Berghe and Gross, 1989). More specifically, (Mellina et al., 2005) found that long-range movement of rainbow trout in North-Central British Columbia was most closely linked with discharge patterns. Within the Black Hills region, (James, 2011) found that spawning related movements of rainbow trout between Spearfish Creek and Cleopatra Creek were highly correlated to increases in discharge. While other models showed support, discharge was our highest ranking model.
The relationship between movement and photoperiod revealed redundancy due to significant positive correlations among photoperiod, water temperature, and discharge. This redundancy could be a factor in the performance of models containing photoperiod. However, migratory behavior has been shown to be affected by photoperiod (Zaug and Wagner, 1973). Interestingly, (Bromage et al., 1984) found that spawning times of broodstock rainbow trout could be manipulated by altering photoperiod during controlled experiments. Furthermore, (Behnke, 1979) states that due to hatchery selection, hatchery rainbow trout can spawn in any month of the year depending on the strain.
Many salmonid species have evolved with the water temperatures that they historically used for spawning (Spence et al., 1996). For example, timing of spawning is dependent on water temperature for fluvial westslope cutthroat trout (Liknes and Graham, 1988) and centers around water temperatures near 10ºC (Scott and Crossman, 1973). Similarly, (Ovidio et al., 1998) found that brown trout movement was initiated at a thermal range of 10- 12ºC. Furthermore, changes in water temperature can be an important factor in trout movement (Whelan et al., 1988; Jonsson, 1991; Meyers et al., 1992). (Bjornn and Reiser, 1991) found that trout and salmon migrate upstream in response to water temperatures. While in this study, the model including water temperature was supported using AIC, it had little value for explaining variation in rainbow trout movement.
Fish behavior and movements can be difficult to understand and are influenced by both biotic and abiotic factors. The scope of this study was limited to examining a few abiotic factors which have been previously reported to influence movements of salmonid species.
(Peterson, 1972) found that increasing fish movement was associated with decreases in barometric pressure. However, (Dedual and Jowett, 1999) found that changes in barometric pressure and river flow had little effect on the upstream migration of rainbow trout and suggested that fish may be responding to other biotic factors such as preferences for spawning habitat and state of maturity, or the presence of other fish rather than environmental variables. The results of this study illustrate the need for further research on the factors affecting the movement patterns of unique rainbow trout populations. Future research should focus on addressing both biotic and abiotic factors which could influence these movements.
Acknowledgment
We thank the late Dr. Dave Willis for his assistance and guidance throughout the course of this study. Additionally, we thank Jerry Wilhite, Mike Barnes, Eric Krebs, Patrick Nero, Keith Wintersteen, Michelle Bucholz, Dylan Jones, and Luke Schultz for their assistance during our study. Parts of this study were conducted under INAD numbers 11-740 and 11-741. Any views expressed in this article do not necessarily represent the views of the U.S. Government.
26132
References
- Behnke, R.J. (1992) Native trout of western North America. American Fisheries Society Monograph 6, Bethesda, Maryland, USA.
- Behnke, R.J. (1979) Monograph of the native trouts of the genus Salmo of western North America. U.S. Fish and Widlife Service, Region 6, Denver, CO. pp: 215.
- Bjornn, T.C., Reiser, D.W. (1991) Habitat requirements of salmonids in streams. Pages 83-138 in W.R. Meehan, editor. Influences of forest and rangeland management on salmonid fishes and their habitat. Special Publication 19. American Fisheries Society, Bethesda, MD.
- Bromage, N.R., Elliott, J.A.K., Springate, J.R.C., Whitehead, C. (1984) The effects of constant photoperiods on the timing of spawning in the rainbow trout. Aquaculture 43, 213-223.
- Burnham, K.P., Anderson, D.R. (2002) Model selection and multimodal inference: a practical information-theoretic approach, 2nd edition. Springer, New York.
- Cordes, R. (2007) Cold-water fish species. C.R. Berry, Jr., K.F. Higgins, D.W.Willis, and S.R.Chipps, editors. History of fisheries and fishing in South Dakota. South Dakota Game, Fish and Parks, Pierre, 201-211.
- Davis, J.L., Wilhite, J.W., Simpson, G., Barnes, M.E., Bertrand, K.N. et al., (2013) Contributions of Stocked and Naturally Reproduced Rainbow Trout in the Deerfield Reservoir System. The Prairie Naturalist 45, 46-56.
- Davis, J.L., Barnes, M.E., Wilhite, J.W. (2013) Effectiveness of Three Compounds to Anesthetize Rainbow Trout during PIT Tag Implantation Surgery. North American Journal of Fisheries Management 33, 482-487.
- Dedual M., Jowett, I.G. (1999) Movement of rainbow trout (Oncorhynchus mykiss) during the spawning migration in the Tongariro River, New Zealand. New Zealand Journal of Marine and Freshwater Research 33, 107-117.
- Downs, C.C. (2000) Kootenai River fisheries investigations: Rainbow trout recruitment. 1998 Annual report to Bonneville Power Administration, Project 88-65. Idaho Department of Fish and Game, Boise, Idaho.
- Holecek, D.E., Walters, J.P. (2007) Spawning characteristics of adfluvial rainbow trout in a North Idaho stream: Implications for error in redd counts. North American Journal of Fisheries Management 27, 1010-1017.
- James, D.A. (2011) Spawning-related movement patterns of a unique rainbow trout (Oncorhynchus mykiss) population in a South Dakota headwater stream. Journal of Freshwater Ecology 26, 43-50.
- Jonsson, N., Jonsson, B., Hansen, L.P. (1990) Partial segregation in the timing of migration of Atlantic salmon of different ages. Animal Behavior. 40, 313-321.
- Jonsson, N. (1991) Influence of water flow, water temperature and light on fish migration in rivers. Nordic Journal of Freshwater Resources 66, 20-35.
- Liknes, G. A., Graham, P.J. (1988) Westslope cutthroat trout in Montana: life history, status, and management. Pages 53–60 in R. E. Gresswell, editor. Status and management of interior stocks of cutthroat trout. American Fisheries Society, Symposium 4, Bethesda, Maryland.
- Meka, J. M., Knudsen, E.E., Douglas, D.C., Benter, R.B. (2003) Variable migratory patterns of different adult rainbow trout life history types in a southwest Alaska watershed. Transactions of the American Fisheries Society 132, 717-732.
- Mellina, E., Hinch, S.G., MacKenzie, K.D. (2005) Seasonal movement patterns of stream-dwelling rainbow trout in north-central British Columbia, Canada. Transactions of the American Fisheries Society 134, 1021-1037.
- Meyers, L.S., Thuemler, T.F., Kornely, G.W. (1992) Seasonal movements of brown trout in Northeast Wisconsin. North American Journal of Fisheries Management 12, 433-441.
- Peterson, D. A. (1972) Barometric pressure and its effect on spawning activities of rainbow trout. Progressive fish-culturist 34, 110-112.
- Roussel, J.M., Haro, A., Cunjak, R.A. (2000) Field test of a new method for tracking small fishes in shallow rivers using passive integrated transponder (PIT) technology. Canadian Journal of Fisheries and Aquatic Sciences 57, 1326-1329.
- SAS Institute Inc. (2012) SAS for Windows, version 9.3, SAS Institute Inc., Cary, North Carolina.
- Schmetterling, D.A. (2000) Seasonal movements of fluvial westslope cutthroat trout in the Blackfoot River drainage, Montana. North American Journal of Fisheries Management 20, 711-719.
- Scott, W. B., Crossman, E.J. (1973) Freshwater fishes of Canada. Fisheries Research Board of Canada Bulletin 184.
- Spence, B.C., Lomicky,G.M., Hughes, R.M., Novitzki, R.P. (1996) An ecosystem approach to salmonid conservation. TR-4501-96-6057. ManTech Environmental Research Services Corp., Corvallis, OR (Available from the National Marine Fisheries Service, Portland, OR). Pp: 356.
- Thurow, R.T., King, J.G. (1994) Attributes of Yellowstone cutthroat trout redds in a tributary of the Snake River, Idaho. Transactions of the American Fisheries Society 123, 37-50.
- Van den Berghe, E.P., Gross, M.R. (1989) Natural selection resulting from female breeding competition in a Pacific salmon (coho: Oncorhynchus kisutch). Evolution 43, 125-140.
- VanVelson, R.C. (1974) Self-sustaining rainbow trout (Salmo gairneri) population in McConaughy Reservoir, Nebraska. Transactions of the American Fisheries Society 103, 59-64.
- Whelan, G. E., Marod, S., Taylor, W.W. (1988) Fisheries Report, E.L.F. communications system ecological monitoring program. U.S. Navy Electronics Systems Command, Technical Report E06548-8, Washington, D.C.
- Zaugg, W. S., Wagner, H.H. (1973) Gill APTase activity related to parr-smolt transformation in steelhead trout Salmo gairdneri : influence of photoperiod and temperature. Comparative Biochemistry and Physiology 45, 955-965.
