Ann Olincy, MD1,6, Robert House, MD2,6, Bifeng Gao, PhD3, Peter Recksiek, BS4, Tzu Lip Phang, PhD5, Bernadette Sullivan, MLT1, Jeff P. Hollis, BS1, Janet Hopkins, BS4, Ted Shade, BS3, Michael G Edwards, PhD5, Ruby Vianzon, AS4, Cory Griffiths, BS4, John Ceilley, MD2, Roger W. Helfrich, MD2, Jonathan Ritvo, MD2, Erica Weis, MD2, David Weiss, MD2, Judith Gault, PhD1,4*
1Department of Psychiatry, University of Colorado, Anschutz Medical Campus, Aurora, CO, USA
2Behavioral Health, Denver Health Medical Center, Denver, CO, USA
3Cancer Center, University of Colorado, Anschutz Medical Campus, Aurora, CO, USA
4Department of Neurosurgery, University of Colorado, Anschutz Medical Campus, Aurora, CO, USA
5Department of Pulmonary Sciences, University of Colorado, Anschutz Medical Campus, Aurora, CO, USA
6These authors contributed equally to this work
- *Corresponding Author:
- Judith Gault
PhD, Department of Neurosurgery, University of Colorado
Anschutz Medical Campus
Box 8601, 12700 E. 19th Ave., Aurora, CO 80045
USA
Tel.:+1 303 724 4132
Fax:+1 303 724 6012
E-mail: vivek03sharma@rediffmail.com
Introduction
Neuroleptic medication is clearly efficacious in treating schizophrenia, however, 61% of patients with schizophrenia have a relapsing and remitting course [1]. Relapse is a primary contributor to schizophrenia disease burden [2] that results from noncompliance and inadequate dosing. Neuroleptics frequently do not alleviate all psychotic symptoms making identification of an optimal dose by subjective means a challenge and approximately 46% of patients in community mental health services receive suboptimally prescribed neuroleptics [3]. In addition, 27-50% of patients on injectable neuroleptic medication relapse each year into acute psychosis consistent with a need to adjust medications in accordance with a variable disease course [4]. An objective measure of neuroleptic-response is required that would allow identification of the lowest efficacious dose and reduce unsafe side effects associated with high doses of neuroleptic medication [5].
Two of 3 multicenter clinical antipsychotic trials showed that neuroleptics have similar clinical efficacy [6-8] and the therapeutic window is achieved by 50-80% dopamine receptor D2 (DRD2) occupancy [9, 10]. Increased DRD2 mRNA levels in peripheral blood lymphocytes served as a diagnostic biomarker for 13 medication-naïve male and female patients with schizophrenia [11], but not in 30 patients with variable treatment histories [12] suggesting DRD2 receptor levels on lymphocytes may be altered by neuroleptic treatment. This evidence together suggests that some neuroleptic-response biomarkers may be related to the DRD2 pathway. Plasma haloperidol levels are correlated with D2 occupancy in the brain [13] showing the utility of using peripheral blood as a surrogate for relevant neuroleptic effects in the brain.
Identification of a large Scottish family with a balanced translocation breakpoint in the disrupted in schizophrenia 1 (DISC1) gene that cosegregates with all 7 family members with schizophrenia and 10 other members with major depression, is the best genetic evidence that DISC1 is involved in schizophrenia (LOD score 7.1) [14]. When identifying causative genes in Mendelian diseases, the focus is on the identification of mutations that clearly disrupt the gene in more than one family and co-segregate with disease. DISC1 is promising in this regard. There appears to be clinical heterogeneity and reduced clinical penetrance in the two families described with 2 different rare mutations (the second family has a 4 base pair deletion in the coding region of DISC1) [15,16]. Several common single nucleotide polymorphisms (SNPs) in DISC1 [17] and DRD2 [17] have been associated with schizophrenia and they are among the genes most strongly associated with schizophrenia through meta-analysis [18]. Multiple proteins have been identified that interact with DISC1 during neurodevelopment [19-25]. The N terminal region of DISC1 physically interacts with glycogen synthase kinase 3 beta (GSK3β) [24]. GSK3β is also regulated through both the dopamine D2 receptor (DRD2) and serotonin pathway as shown by pharmacological studies and analyses of knockout mice [26]. AKT1 also directly inhibits GSK3β and haplotypes of AKT1 have been associated with both reduced levels of AKT1 protein and with schizophrenia [27]. In addition, neuroleptic treatment was shown to change levels of AKT1 and GSK3β phosphorylation in mouse brain [27] and in vitro [28]. Together this evidence is consistent with the DRD2/DISC1 pathway being involved in schizophrenia and the treatment of schizophrenia.
In the present study, treatment-response biomarkers were sought in PBMCs by identifying transcripts that were similarly up or down regulated by microarray analysis of 6 paired samples collected early and late during treatment of psychosis in a heterogeneous group of patients hospitalized with schizophrenia. Further quantitative analysis was performed on one promising treatment-response biomarker, DISC1, that was selected based on known genetic involvement in schizophrenia [14] and involvement in the dopamine DRD2 pathway [24].
Methods
Participants
Patients experiencing psychosis were enrolled with consent within 3 days of being admitted to the psychiatric ward at Denver Health Medical Center (Colorado Multiple Institutional Review Board protocol #04-0853). Upon collection of paired blood samples, patient’s symptoms were assessed with a BPRS performed by the same interviewer. Therapeutic interventions had been initiated before the time of the 1st blood draw. Electronic records of neuroleptic doses administered up to 24 hrs before each blood draw were employed to calculate the haloperidol equivalents using dose equivalencies determined by Andreasen et al. 2010[29]. Blood samples (30 ml) were collected in ice cold sodium heparin 1 ml tubes BD Vacutainer® (BD, Franklin Lakes, NJ) around 2 pm. Lymphocytes were separated from 16 ml of peripheral blood as directed using UnisepTM (Axis- Shield, Oslo, Norway). RNA was isolated from lymphocytes as directed using TRIZOL® Reagent (Invitrogen, Carlsbad, CA). Diagnoses were made based on a Structured Clinical Interview for Diagnostic Interview for Genetic Studies (DIGS) and review of medical records[30].
Microarray transcript analysis
Six paired RNA samples from patients with schizophrenia showing the most improvement between paired samples were further purified using QIAGEN RNeasy mini kit (Qiagen, Valencia, CA) for gene chip analysis. RNA quality was assessed using the Agilent Bioanalyzer 2100 (Quantum Analytics, Inc. Foster City, CA). RNA (50 ngs) was amplified and labeled as directed by OvationTM System (NuGEN Technologies Inc., San Carlos, CA). The labeled cRNA was hybridized to Human Genome U133 Plus 2.0 Arrays (Affymetrix, Santa Clara, CA). Affymetrix data was normalized with the MAS5 filter. Pair wise comparison analysis was done using Affymetrix GCOS v1.4 data analysis software to identify genes similarly up or down regulated across the 6 paired samples. Paired T-test analysis was performed using Partek Genomic Solutions (Partek, St. Charles, MO) to determine p-values for the differentially expressed genes.
Reverse-transcribed Quantitative PCR (RT-qPCR)
Bioanalyzed RNA of good quality was reverse transcribed in triplicate using 0.29 ugs of RNA per tube in a 20 ul reaction. For each sample one reaction without reverse transcription was performed in a 16.8 ul reaction. RNA incubated at 65°C for 5’, then 4°C. Reverse transcription mix was added and incubated at 25°C for 10’ then at 42°C for 1 hour, then 99°C for 5’. Reaction mix was Superscript™ II (2.5 Units per ul in 1x First-Strand Buffer, 0.01M dithiothreitol (DTT), 8 mM random hexamers (GE Healthcare, Uppsala, Sweden), and 0.5 U/ml placental RNase inhibitor (Roche Applied Science, Indianapolis, IN).
Quantitative PCR was performed using the DISC1 primer set VI (Table 1) designed using PerlPrimer v1.1.14 [31] and normalized with an 18S amplicon primer set VII (Table 1). The DISC1 and 18S amplicons had correlation coeffiecients of 0.979 and 0.985 with PCR efficiencies of 89.5% and 97.6% based on analysis of 5 and 9 point standard curves respectively. The cDNA template (2 ul) was qPCRed with the primers at 140 nM final concentrations in 1X SYBR green I dye and fluorescein mix with Thermo-Start DNA polymerase in a total reaction volume of 27 ul(Thermo Fisher Scientific Inc. Waltham, MA). Both assays were performed on a BioRad iCycler® (BioRad, Hercules, CA) using the following program: 95°C for 15’; (95°C for 15”; 60°C for 1’) for 40 cycles followed by a melt curve. Relative gene expression was determined using both the Livak 2-ΔΔC(t) and Pfaffl methods with iQ5™ version 2.0 (BioRad, Hercules, CA). Significance was tested with a paired T-test. The DISC1-biomarker assay was tested using various control templates including DNA only, DNase treated RNA, poly A isolated RNA, water, RNA without reverse transcriptase. DISC1 isoforms were sought in RNA from PBMCs (Table 1).
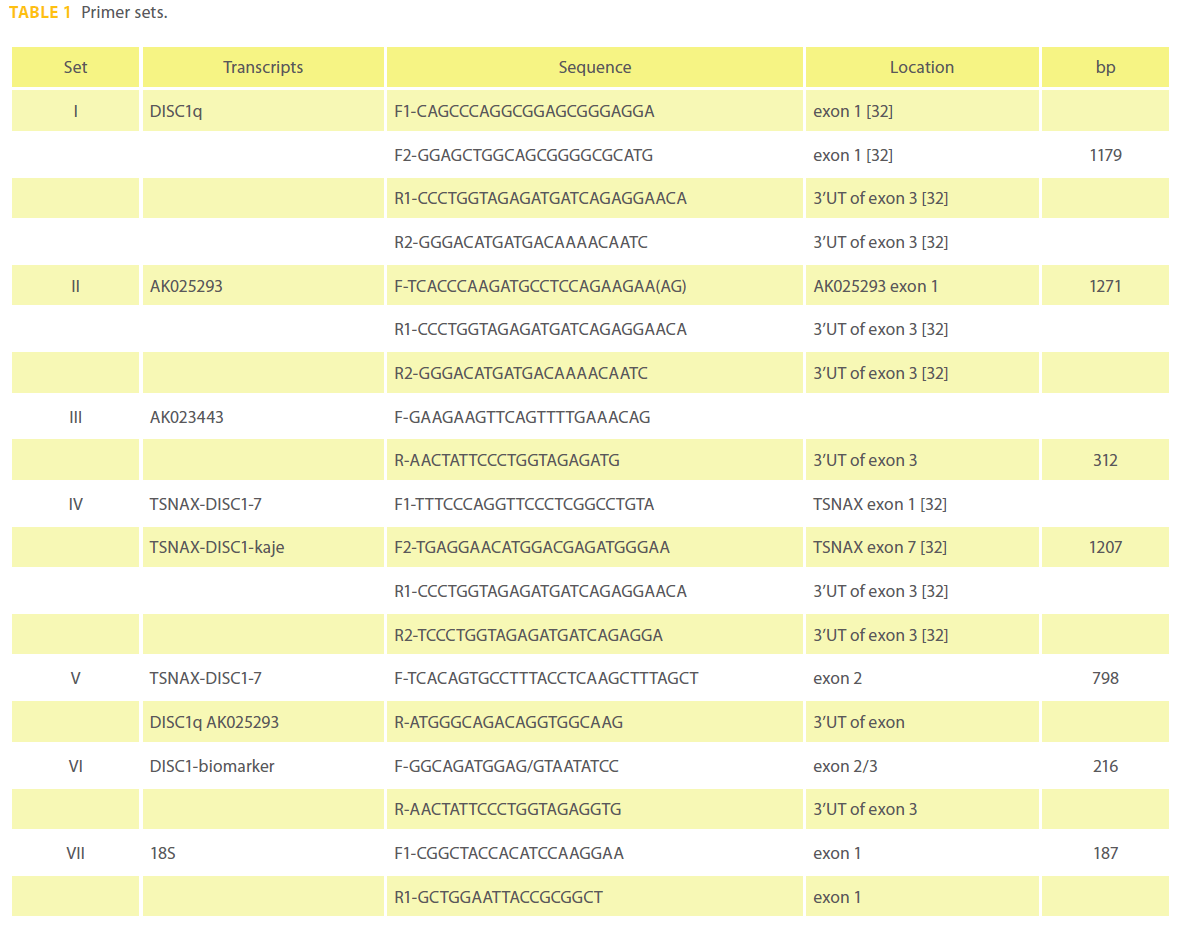
Table 1: Primer sets.
Results
Sample
A total of 16 paired samples were collected from patients. Four paired samples were removed from analysis due to poor quality RNA (2 paired samples), no improvement between paired samples (1 paired sample), a compromised 2nd BPRS interview (1 paired sample). All 12 subjects whose samples were utilized for transcript quantification met DSM IV criteria for schizophrenia. Patient S33 was diagnosed with schizophrenia and bipolar disorder. There was significant improvement in positive symptoms assessed with the BPRS (P = 0.01; Table 2) and improvement in total BPRS scores between samples (P = 0.08). The 12 patients were on average 48 years old and paired samples were collected an average of 5.8 days apart. Patient S31 was the only female. Patient S39 was the only black male all others were Caucasian.Neuroleptics administered within 24 hours before sample collection were at a mean dose of 12.5 haloperidol equivalents [29] and did not significantly change from the 1st to the 2nd sample collection (Table 2). Eight patients were treated for comorbid disease during hospitalization. The patients were not treated for hepatic failure or other illnesses known to interfere with metabolism of neuroleptics.
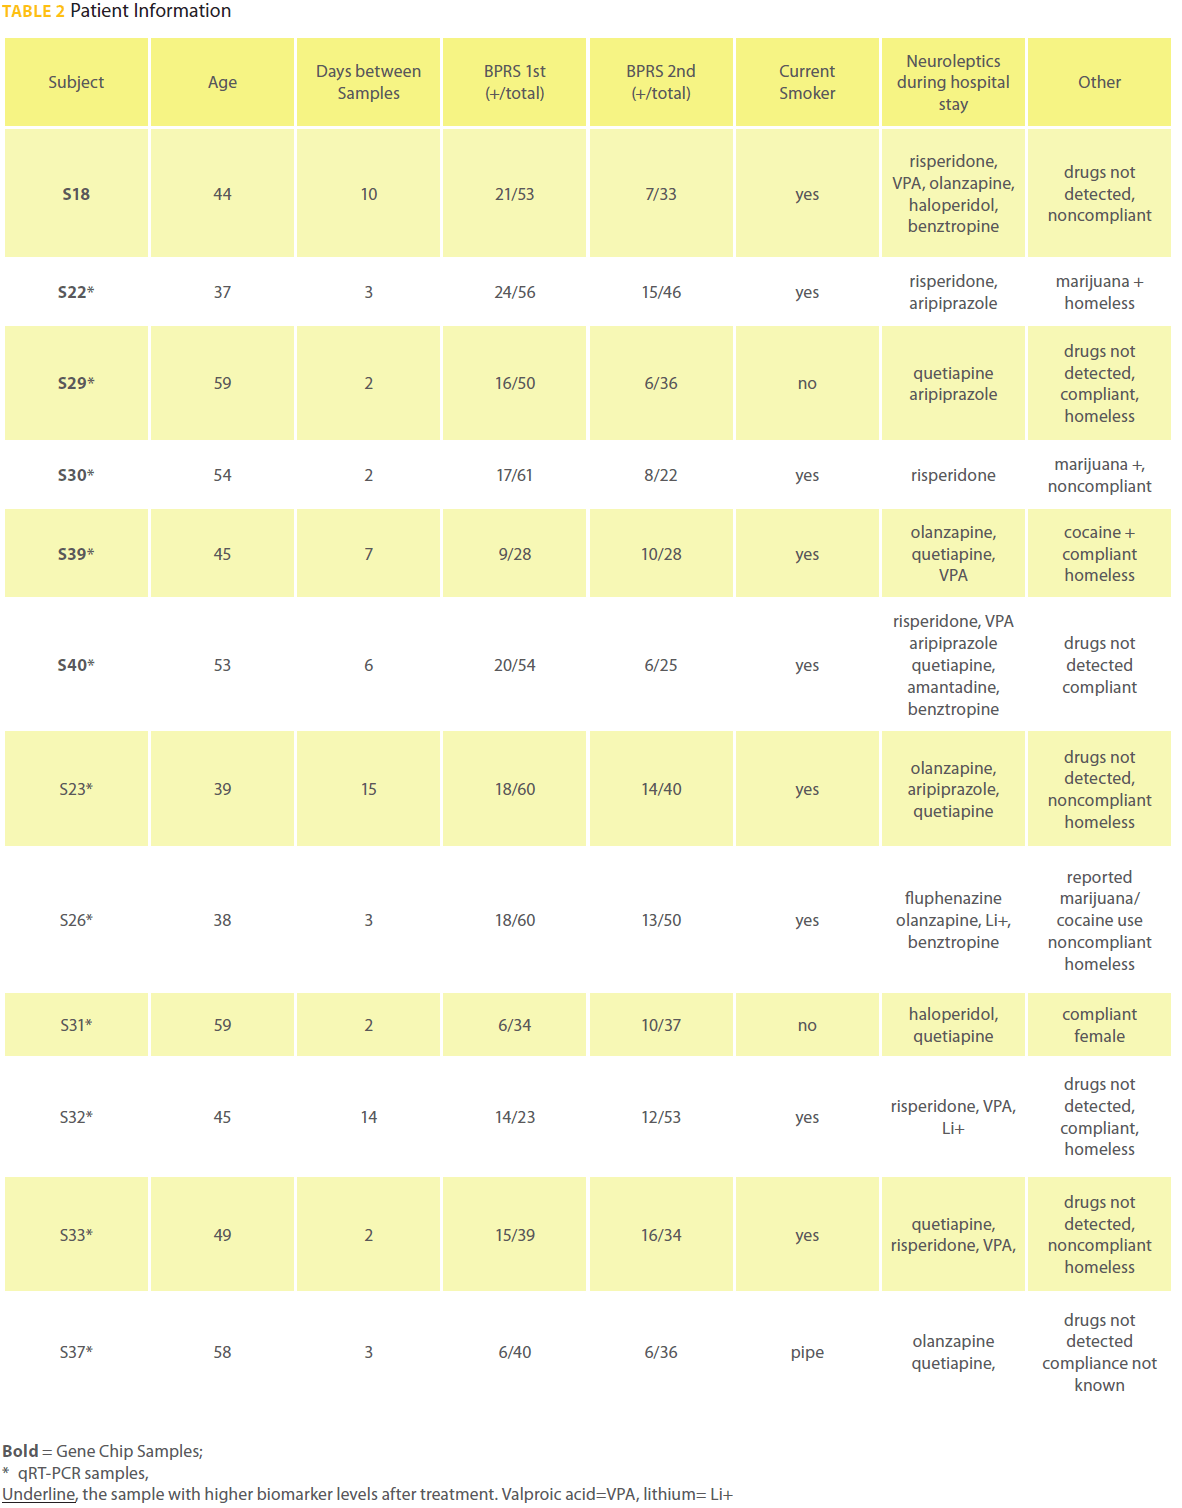
Table 2: Patient Information
Differential gene expression analysis
Six paired samples were used for gene chip analysis and 11 paired samples were used for RT-qPCR analysis (Table 2). Pair wise analysis using Gene Chip Operating Software (GCOS) of lymphocyte RNA from 6 paired samples from male patients with schizophrenia suggested there were 470 genes that were similarly differentially expressed during psychosis in at least 3 out of 6 paired samples (318 increased and 153 decreased). Of the 2 DISC1 probe sets that measured corresponding isoforms found in all 12 samples, one probe set detected significant changes in transcript levels. DISC1 probe set (206090_s_at) measured levels of the L and Lv isoforms, but they were not differentially expressed. DISC1 probe set (207759_s_at) was found up regulated during acute psychosis 1.4 to 1.7 fold in samples S18, S22 and S40 but not significantly changed in samples S30, S39 and S29 on microarray analysis (p = 0.14) (Figure 1a). Probe set 207759_s_at measured 5 known unique cDNA sequences together, the TSNAX-DISC1 variant 7 and 54 (GI:257153373 and 238066764 respectively), DISC1 variant q and isoform 46 (GI:257153300 and 238066748 respectively), AK025293 (GI:10437780), AK023443 (GI:10435379) and a novel TSNAX-DISC1 isoform kaje discovered during this investigation (Figure 2). Together these 5 transcripts were detected at intermediate levels in PBMCs and were found increased during psychosis (decreased by 40% after effective treatment) in 10 of the 11 paired samples (p = 0.037) using RT-qPCR (Figure 1b).
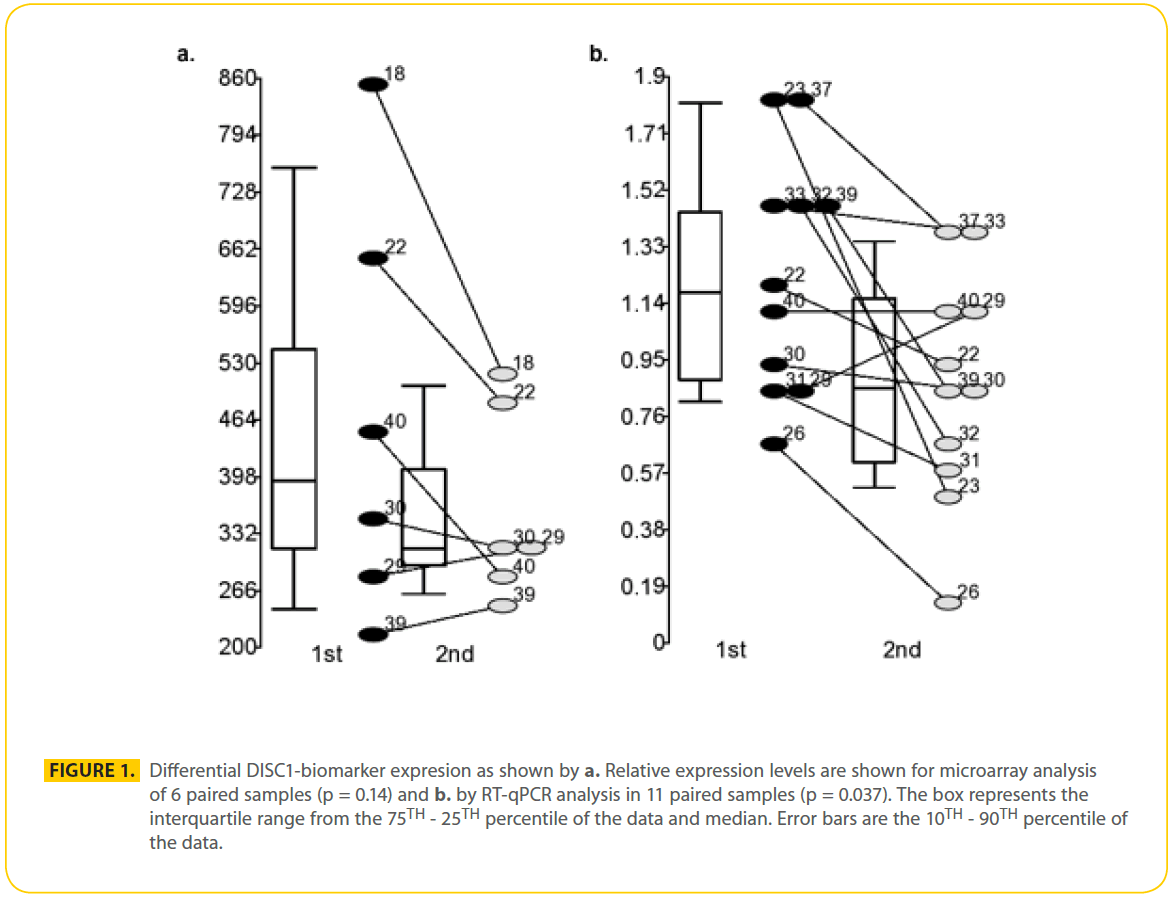
Figure 1: Differential DISC1-biomarker expresion as shown by a. Relative expression levels are shown for microarray analysis of 6 paired samples (p = 0.14) and b. by RT-qPCR analysis in 11 paired samples (p = 0.037). The box represents the interquartile range from the 75TH - 25TH percentile of the data and median. Error bars are the 10TH - 90TH percentile of the data.

Figure 2: Subset of 7 DISC1 transcripts (isoforms). Primer sets I-VI.
Discussion
Paired PBMC samples from patients hospitalized with acute psychosis were analyzed for potential treatment-response biomarkers of psychosis using gene chip analysis and RT-qPCR. Several DISC1 transcripts measured together were the focus of the verification using RT-qPCR because DISC1 is implicated in the genetics of schizophrenia and the DRD2 pathway. We present a novel preliminary finding of decreases in several DISC1 isoforms measured together that is associated with treatment of psychosis during hospitalization.
There are several limitations to this preliminary study. First, the sample size is small and the findings require replication in a larger sample. Control subjects were not included to determine the normal variability of the DISC1-biomarker levels. The patient sample is heterogeneous in regard to street drug use, medication compliance before hospitalization, comorbid disease, age, whether the subjects were homeless and time between samples. While the patients took many different neuroleptics, all the patients were on high doses and their mean haldol-equivalent levels [29] were 12.5 mg/day; haloperidol at 2-5 mg/day corresponds to optimal 60-80% DRD2 occupancy in the brain [33]. In addition to neuroleptics, 6 of the 12 patients in this study were treated with either lithium and/or valproic acid that have been implicated in GSK3β regulation as well [26] and may contribute to changes in DISC1-biomarker levels. A larger change in DISC1 levels was found in the antipsychotic, VPA and lithium group (p = 0.12) when compared to the antipsychotic alone group (p = 0.22). Dividing the group up resulted in a loss of statistical significance due to the small sample size.
The mechanism by which levels of DISC1 in PBMCs was associated with neuroleptic treatment may involve the DRD2/GSK3β pathway (Figure 3). PBMCs may act as a surrogate of the brain through exposure to neuroleptic medications that are antagonists of DRD2 [26,34] leading to inhibition of GSK3β in PBMCs. DISC1 protein has been shown to directly bind GSK3β through the N terminal encoded by exon 2 of the full-length DISC1 protein and inhibit GSK3β’s activity [24] (Figure 3). Three differentially expressed transcripts, measured as part of the DISC1- biomarker assay, have an ORF through exon 2 and if translated may be able to bind and inhibit GSK3β. Total dopamine (DA) levels in the plasma are 7.18 nM (0.1-0.33 nM free DA) after fasting, but increase 2-20 fold with sympathetic nervous system activity (exercise, eating, stress and high blood pressure [35]) and are estimated at 100-250 nM at the dendritic cell-T-cell synapse [36]. The affinity (KD) between DA and DRD2 receptors is 6 nM for D2High affinity and 3600 nM for D2Low affinity [37]. Peripheral dopamine does not cross the blood brain barrier and action at the DRD2 receptor has been implicated in regulating permeability in vascular endothelium, insulin secretion in pancreatic β-cells and blood pressure by modulating sodium balance in the kidneys. Therefore, dopamine levels in blood may be sufficient to stimulate DRD2 receptors on PBMCs if present. Although we (not shown) and others have detected DRD2 transcripts in PBMCs [10-12], detection of PBMC DRD2 protein have been controversial [38-40]. Using flow cytometry, DRD2 receptors were found primarily on B cells (28.3%), NK cells (8.4%) and overall represented less than 5% of PBMCs [41].
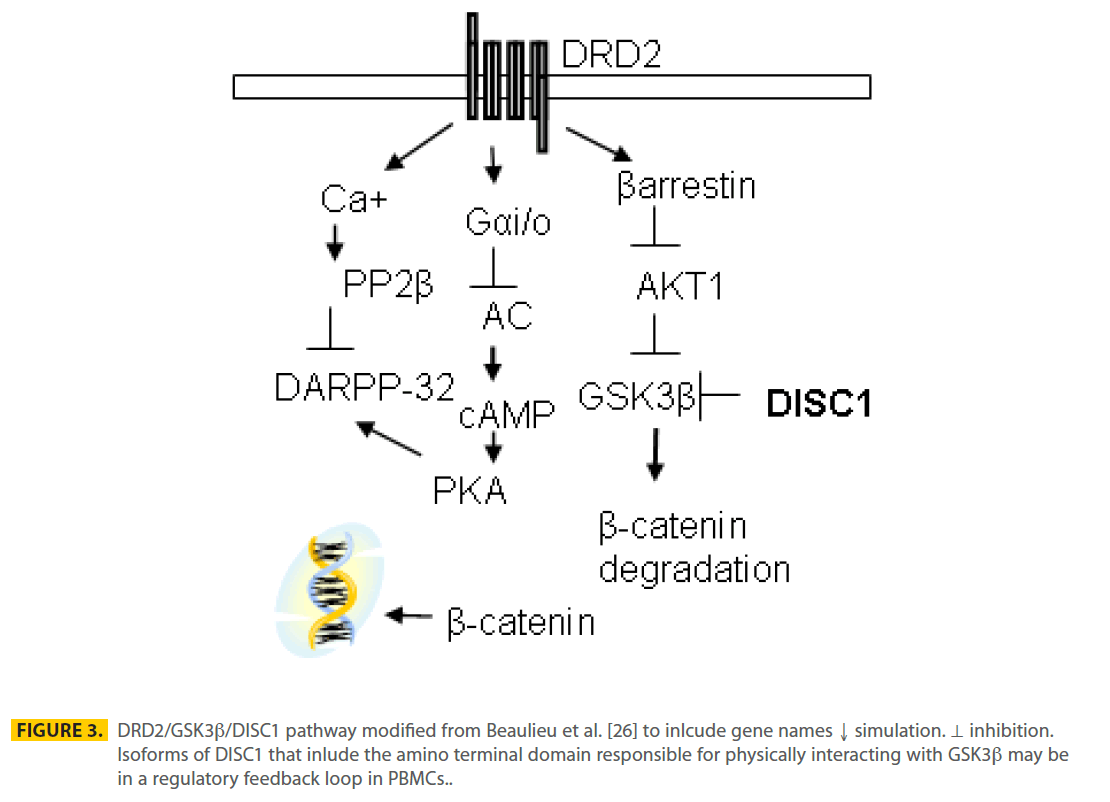
Figure 3: DRD2/GSK3b/DISC1 pathway modified from Beaulieu et al. [26] to inlcude gene names ↓ simulation. ⊥ inhibition. Isoforms of DISC1 that inlude the amino terminal domain responsible for physically interacting with GSK3b may be in a regulatory feedback loop in PBMCs.
In conclusion, changes in transcript levels of DISC1-biomarkers are associated with effective neuroleptic treatment in patients with schizophrenia. Future projects will focus on replicating this finding in a larger patient population including control subjects to estimate the normal variance of DISC1-biomarker levels. Ultimately, the clinical utility of monitoring changes in the DISC1-biomarker to indicate an optimal dose of neuroleptic drug will be determined.
Acknowledgments
We thank the research participants for volunteering for this study. We thank Carla Drebing, Ralph Berger, Curt Freed and Robert Freedman for their technical advice and feedback. This research was supported by a NARSAD Young Investigator Award and the National Institute of Mental Health (1RC1MH088735).
2561
References
- Harrison, G., K. Hopper, T. Craig, E. Laska, C. Siegel, et al., (2001) Recovery from psychotic illness: a 15- and 25-year international follow-up study. Br J Psychiatry. 178: 506-17.
- Weiden, P.J. and M. Olfson, (1995) Cost of relapse in schizophrenia. Schizophr Bull. 21;3: 419-29.
- Meagher, D.a.M., M., (2003) Sub-optimal prescribing in an adult community mental health service: prevalence and determinants. Psychiatr. Bull. 27: 266-270.
- Csernansky, J.G., R. Mahmoud, and R. Brenner, (2002) A comparison of risperidone and haloperidol for the prevention of relapse in patients with schizophrenia. N Engl J Med. 346;1: 16- 22.
- Ray, W.A., C.P. Chung, K.T. Murray, K. Hall, and C.M. Stein, (2009) Atypical antipsychotic drugs and the risk of sudden cardiac death. N Engl J Med. 360;3: 225-35.
- Swartz, M.S., D.O. Perkins, T.S. Stroup, S.M. Davis, G. Capuano, et al., (2007) Effects of antipsychotic medications on psychosocial functioning in patients with chronic schizophrenia: findings from the NIMH CATIE study. Am J Psychiatry. 164;3: 428-36.
- Jones, P.B., T.R. Barnes, L. Davies, G. Dunn, H. Lloyd, et al., (2006) Randomized controlled trial of the effect on Quality of Life of second- vs first-generation antipsychotic drugs in schizophrenia: Cost Utility of the Latest Antipsychotic Drugs in Schizophrenia Study (CUtLASS 1). Arch Gen Psychiatry. 63;10: 1079-87.
- Leucht, S., C. Corves, D. Arbter, R.R. Engel, C. Li, et al., (2009) Second-generation versus first-generation antipsychotic drugs for schizophrenia: a meta-analysis. Lancet. 373;9657: 31-41.
- Farde, L., A.L. Nordstrom, F.A. Wiesel, S. Pauli, C. Halldin, et al., (1992) Positron emission tomographic analysis of central D1 and D2 dopamine receptor occupancy in patients treated with classical neuroleptics and clozapine. Relation to extrapyramidal side effects. Arch Gen Psychiatry. 49;7: 538-44.
- Kapur, S., R. Zipursky, C. Jones, G. Remington, and S. Houle, (2000) Relationship between dopamine D(2) occupancy, clinical response, and side effects: a double-blind PET study of firstepisode schizophrenia. Am J Psychiatry. 157;4: 514-20.
- Zvara, A., G. Szekeres, Z. Janka, J.Z. Kelemen, C. Cimmer, et al., (2005) Over-expression of dopamine D2 receptor and inwardly rectifying potassium channel genes in drug-naive schizophrenic peripheral blood lymphocytes as potential diagnostic markers. Dis Markers. 21;2: 61-9.
- Tsuang, M.T., N. Nossova, T. Yager, M.M. Tsuang, S.C. Guo, et al., (2005) Assessing the validity of blood-based gene expression profiles for the classification of schizophrenia and bipolar disorder: a preliminary report. Am J Med Genet B Neuropsychiatr Genet. 133;1: 1-5.
- Fitzgerald, P.B., S. Kapur, G. Remington, P. Roy, and R.B. Zipursky, (2000) Predicting haloperidol occupancy of central dopamine D2 receptors from plasma levels. Psychopharmacology (Berl). 149;1: 1-5.
- Blackwood, D.H., A. Fordyce, M.T. Walker, D.M. St Clair, D.J. Porteous, et al., (2001) Schizophrenia and affective disorders-- cosegregation with a translocation at chromosome 1q42 that directly disrupts brain-expressed genes: clinical and P300 findings in a family. Am J Hum Genet. 69;2: 428-33.
- Green, E.K., N. Norton, T. Peirce, D. Grozeva, G. Kirov, et al., (2006) Evidence that a DISC1 frame-shift deletion associated with psychosis in a single family may not be a pathogenic mutation. Mol Psychiatry. 11;9: 798-9.
- Sachs, N.A., A. Sawa, S.E. Holmes, C.A. Ross, L.E. DeLisi, et al., (2005) A frameshift mutation in Disrupted in Schizophrenia 1 in an American family with schizophrenia and schizoaffective disorder. Mol Psychiatry. 10;8: 758-64.
- Allen, N.C., S. Bagade, M.B. McQueen, J.P. Ioannidis, F.K. Kavvoura, et al., (2008) Systematic meta-analyses and field synopsis of genetic association studies in schizophrenia: the SzGene database. Nat Genet. 40;7: 827-34.
- Khoury, M.J., L. Bertram, P. Boffetta, A.S. Butterworth, S.J. Chanock, et al., (2009) Genome-wide association studies, field synopses, and the development of the knowledge base on genetic variation and human diseases. Am J Epidemiol. 170;3: 269-79.
- Harrison, P.J. and D.R. Weinberger, (2004) Schizophrenia genes, gene expression, and neuropathology: on the matter of their convergence. Mol Psychiatry.
- Hattori, T., K. Baba, S. Matsuzaki, A. Honda, K. Miyoshi, et al., (2007) A novel DISC1-interacting partner DISC1-Binding Zinc-finger protein: implication in the modulation of DISC1- dependent neurite outgrowth. Mol Psychiatry. 12;4: 398-407.
- Assmann, E.M., M.R. Alborghetti, M.E. Camargo, and J. Kobarg, (2006) FEZ1 dimerization and interaction with transcription regulatory proteins involves its coiled-coil region. J Biol Chem. 281;15: 9869-81.
- Morris, J.A., G. Kandpal, L. Ma, and C.P. Austin, (2003) DISC1 (Disrupted-In-Schizophrenia 1) is a centrosome-associated protein that interacts with MAP1A, MIPT3, ATF4/5 and NUDEL: regulation and loss of interaction with mutation. Hum Mol Genet. 12;13: 1591-608.
- Brandon, N.J., E.J. Handford, I. Schurov, J.C. Rain, M. Pelling, et al., (2004) Disrupted in Schizophrenia 1 and Nudel form a neurodevelopmentally regulated protein complex: implications for schizophrenia and other major neurological disorders. Mol Cell Neurosci. 25;1: 42-55.
- Mao, Y., X. Ge, C.L. Frank, J.M. Madison, A.N. Koehler, et al., (2009) Disrupted in schizophrenia 1 regulates neuronal progenitor proliferation via modulation of GSK3beta/beta-catenin signaling. Cell. 136;6: 1017-31.
- Numata, S., S. Ueno, J. Iga, H. Song, M. Nakataki, et al., (2008) Positive association of the PDE4B (phosphodiesterase 4B) gene with schizophrenia in the Japanese population. J Psychiatr Res. 43;1: 7-12.
- Beaulieu, J.M., R.R. Gainetdinov, and M.G. Caron, (2009) Akt/ GSK3 Signaling in the Action of Psychotropic Drugs. Annu Rev Pharmacol Toxicol. 49: 327-47.
- Emamian, E.S., D. Hall, M.J. Birnbaum, M. Karayiorgou, and J.A. Gogos, (2004) Convergent evidence for impaired AKT1- GSK3beta signaling in schizophrenia. Nat Genet. 36;2: 131-7.
- Kang, U.G., M.S. Seo, M.S. Roh, Y. Kim, S.C. Yoon, et al., (2004) The effects of clozapine on the GSK-3-mediated signaling pathway. FEBS Lett. 560;1-3: 115-9.
- Andreasen, N.C., M. Pressler, P. Nopoulos, D. Miller, and B.C. Ho, (2010) Antipsychotic dose equivalents and dose-years: a standardized method for comparing exposure to different drugs. Biol Psychiatry. 67;3: 255-62.
- First MB, S.R., Gibbon M, Williams JBW, Structured Clinical Interview for DSM-IV Axis I Disorders-Patient Edition (SCID-I/P, Version 2.0, 4/97 revision), ed. B.R. Department. 1997, New York: New York State Psychiatric Institute.
- Marshall, O.J., (2004) PerlPrimer: cross-platform, graphical primer design for standard, bisulphite and real-time PCR. Bioinformatics. 20;15: 2471-2.
- Nakata, K., B.K. Lipska, T.M. Hyde, T. Ye, E.N. Newburn, et al., (2009) DISC1 splice variants are upregulated in schizophrenia and associated with risk polymorphisms. Proc Natl Acad Sci U S A. 106;37: 15873-8.
- Kapur, S., R. Zipursky, P. Roy, C. Jones, G. Remington, et al., (1997) The relationship between D2 receptor occupancy and plasma levels on low dose oral haloperidol: a PET study. Psychopharmacology (Berl). 131;2: 148-52.
- Beaulieu, J.M., T.D. Sotnikova, W.D. Yao, L. Kockeritz, J.R. Woodgett, et al., (2004) Lithium antagonizes dopaminedependent behaviors mediated by an AKT/glycogen synthase kinase 3 signaling cascade. Proc Natl Acad Sci U S A. 101;14: 5099- 104.
- Snider, S.R. and O. Kuchel, (1983) Dopamine: an important neurohormone of the sympathoadrenal system. Significance of increased peripheral dopamine release for the human stress response and hypertension. Endocr Rev. 4;3: 291-309.
- Nakano, K., T. Higashi, R. Takagi, K. Hashimoto, Y. Tanaka, et al., (2009) Dopamine released by dendritic cells polarizes Th2 differentiation. Int Immunol. 21;6: 645-54.
- Seeman, P., (2007) Antiparkinson therapeutic potencies correlate with their affinities at dopamine D2(High) receptors. Synapse. 61;12: 1013-8.
- Kirillova, G.P., R.J. Hrutkay, M.R. Shurin, G.V. Shurin, I.L. Tourkova, et al., (2008) Dopamine receptors in human lymphocytes: radioligand binding and quantitative RT-PCR assays. J Neurosci Methods. 174;2: 272-80.
- Amenta, F., E. Bronzetti, L. Felici, A. Ricci, and S.K. Tayebati, (1999) Dopamine D2-like receptors on human peripheral blood lymphocytes: a radioligand binding assay and immunocytochemical study. J Auton Pharmacol. 19;3: 151-9.
- Vile, J.M. and P.G. Strange, (1996) D2-like dopamine receptors are not detectable on human peripheral blood lymphocytes. Biol Psychiatry. 40;9: 881-5.
- McKenna, F., P.J. McLaughlin, B.J. Lewis, G.C. Sibbring, J.A. Cummerson, et al., (2002) Dopamine receptor expression on human T- and B-lymphocytes, monocytes, neutrophils, eosinophils and NK cells: a flow cytometric study. J Neuroimmunol. 132;1-2: 34-40.
