Keywords
African catfish; Unconventional feedstuff; Growth performance; Proximate composition.
Introduction
Artificial feeding is one of the principal methods of increasing production of fish cultivation. Its importance varies according to the intensity of aquaculture practice. Similarly, the importance of feed in aquaculture can not be over-emphasized. It promotes faster growth, allows higher stocking density, shorter cultivation period among others (Tiamiyu et al., 2007). However, feed account for at least 60% of the total cost of production in fish farming business. The high cost of fish feed is one of the problems hampering aquacultural development in Nigeria (Gabriel et al., 2007). This marginalize or even nullify the profitability of fish farming thereby incapacitating the expansion of farms and lowering yield, thus resulting in the scarcity of the commodity (fish) and eventually high cost of the few available ones to the disadvantage of the populace (Adikwu 1992). Hence, considerable efforts have been channeled to evaluate the suitability of several unconventional feed stuffs in replacing conventional feed ingredients bearing in mind their low cost and ready availability.
Fish nutrition trials in the past with tuber crops and their byproducts have included wild variegated cocoyam (Agbabiaka et al., 2006), cocoyam corm (Omorege et al., 2009, Aderolu and Sogbesan, 2010), Cassava peels (Solomon et al., 1996) etc. However, there is paucity of information on the utilization value of sweet potato peel in the nutrition of African catfish; FAO (1970) had revealed that sweet potato peels contain adequate amount of calories in form of vitamin B and C as well as useful amount of other micronutrients such as Iron. The carbohydrate of sweet potato peels is highly digestible and soluble. It consists predominantly of starch with 4-7% occurring as sugar. However, the amino acid is observed to be short in tryptophan and total sulphur when compared to the amino acid profile of other crops (FAO 1970). It is also moderately high in ascorbic acid, carotene and other vitamins such as thiamine, riboflavin and niacin. Antinutritional factors so far identified includes phytins, oxalates and solamines, however, they can be reduced to the barest minimum in feed by processing (Oyin 2006). This study is therefore designed to evaluate the suitability of sweet potato peels in replacing maize in the diet of African catfish.
Materials and Methods
Diet formulation and preparation
Fish meal, yellow maize, dried sweet potato peels, soybean meal, salt, vitamin and mineral premix were obtained from North bank market Makurdi, Benue State and used to formulate five isonitrogenous, isolipidic and isoenergetic diets containing 35% crude protein as shown in Table 1 using Pearson’s square method. The feedstuffs were processed to improve digestibility and eliminate any anti-nutritional factor that may be present. The sweet potato peels were sundry to eliminate anti-nutritional factor such as tannins phytins and oxalates while the soybeans was toasted to eliminate trypsin. All ingredients were finely ground and sieved before weighing and were mixed uniformly. In the five diets, fish meal, soybean meal, maize meal, vitamin and mineral premix and salt were kept constant for all the diets. While sweet potato peels meal was substituted for yellow maize meal at varying percentages (at 33.35 level of inclusion) and designated as Diet 1 (SPP0%: YMM100%), Diet 2 (SPP25%: YMM75%), Diet 3 (SPP 50%: YMM 50%), Diet 4 (SPP 75%: YMM 25%), and Diet 5 (SPP 100%: YMM 0%). Water was added (20%) to the mixture with continuous stirring until dough was formed. A Pelleting Machine was used to pellet the diets using a 2 mm die after which they were sun dried, packaged, and stored in a cool dry place until the commencement of feeding.
| Ingredients (%) |
Diet 1 |
Diet 2 |
Diet 3 |
Diet 4 |
Diet 5 |
| Fish meal |
35.15 |
35.15 |
35.15 |
35.15 |
35.15 |
| Soyabean meal |
21.50 |
21.50 |
21.50 |
21.50 |
21.50 |
| Yellow maize meal |
33.35 |
25.01 |
16.68 |
8.34 |
0.00 |
| SPP Meal |
0.00 |
8.34 |
16.68 |
25.01 |
33.35 |
| Salt |
5.00 |
5.00 |
5.00 |
5.00 |
5.00 |
| Vitamin/mineral premix |
5.00 |
5.00 |
5.00 |
5.00 |
5.00 |
| Total |
100 |
100 |
100 |
100 |
100 |
Table 1: Formulation of the Experimental Diets.
Experimental Set up
The study was conducted at the University of Agriculture Makurdi Fisheries Research farm, Benue state, Nigeria. Two hundred and fifty (250) Fingerlings of Clarias gariepinus were purchased from the research farm and acclimatized in plastic bowls for two weeks before the start of the experiment. 15 fish were weighed and stocked randomly in duplicate hapas of 1 m3 (i.e., 1 m × 1 m × 1 m) partially submerged in 48 m3 earthen pond. Water quality were monitored during the study using thermometer, pH meter and multiparameter water checker and parameters were observed to be within the recommended range (dissolved Oxygen-7.5-11.5 mg/l; pH 7.1-8.5; water temperature 25-30ºC) for the culture of tropical fishes (Boyd 1981). Fish were hand-fed twice a day (08:00 am, and 6:00 pm) at a rate of 5% of their body weight daily. Feeding rates were adjusted weekly for 8 weeks based on the weight gain of each group of fish per week. The Feed Ingredients, diets formulated as well as initial and final carcass of Clarias gariepinus fingerlings fed the experimental diets were analyzed for proximate composition using standard methods stated by AOAC (1990).
Performance in growth and feed utilization were determined as shown below
Weight gain calculated as;
(Final weight - initial weight)
Growth rate was determined by calculating according to the method described by Brown (1957)

Specific growth rate (SGR) was calculated according to Brown (1957):

Feed conversion ratio (FCR) was measured according to (Halver 1972):

Feed conversion efficiency was measured according to method described by (Halver 1972):


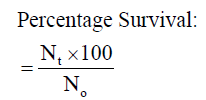
Where Nt and N0 are the number of fish at the end of the experiment and the initial number of fish stocked at the start of the experiment respectively.
Each experimental diet was fed to two groups of fish in a completely randomized design. Statistical analyses in the present study included descriptive statistics as well as analysis of variance (ANOVA P<0.05) using a computer software GENSTAT Discovery edition 3 from Lawes Agricultural Trust Rothamsted.
Results
The proximate composition of sweet potato peel meal used for this study was found to be composed of 8.91% moisture, 5.64% crude protein, 4.71% ether extract, 3.56% crude fibre, 6.02% ash and 71.16% NFE (Table 2). The moisture content of the formulated diet as shown in Table 2 varies from 5.51 ± 0.01% to 6.81 ± 0.00%, Diet 4 had the highest value while Diet 1 had the lowest. Similarly, crude protein content varied from 39.02 ± 0.02% to 39.74 ± 0.01% however Diet 3 had the highest value while Diet 1 recorded the lowest value. Ether extract also varies from 4.38 ± 0.01% to 5.69 ± 0.09% with Diet 3 recording the The proximate composition of sweet potato peel meal used for this study was found to be composed of 8.91% moisture, 5.64% crude protein, 4.71% ether extract, 3.56% crude fibre, 6.02% ash and 71.16% NFE (Table 2). The moisture content of the formulated diet as shown in Table 2 varies from 5.51 ± 0.01% to 6.81 ± 0.00%, Diet 4 had the highest value while Diet 1 had the lowest. Similarly, crude protein content varied from 39.02 ± 0.02% to 39.74 ± 0.01% however Diet 3 had the highest value while Diet 1 recorded the lowest value. Ether extract also varies from 4.38 ± 0.01% to 5.69 ± 0.09% with Diet 3 recording the highest value while the lowest value was recorded in Diet 1. Crude fibre varies from 10.88 ± 0.00% to 11.62 ± 0.03%, Diet 5 had the highest value. Furthermore, ash varies from 17.52 ± 0.00% to 17.95 ± 0.52% with Diet 1 recording the highest values while Diet 4 recorded the lowest values.
| Parameters (%) |
SPP |
Diet 1 |
Diet 2 |
Diet 3 |
Diet 4 |
Diet 3 |
P-value |
| Moisture |
8.91±0.2 |
5.51±0.01b |
6.47±0.02a |
6.74±0.01a |
6.81±0.00a |
6.19±0.01a |
0.01 |
| crude protein |
5.91±0.1 |
39.02±0.02a |
39.37±0.01a |
39.74±0.01a |
39.51±0.01a |
39.89±0.01a |
0.11 |
| Crude fat |
4.71±0.1 |
4.38±0.01b |
5.03±0.02a |
5.69±0.09a |
5.45±0.01a |
5.59±0.00a |
0.01 |
| Crude fibre |
3.56±0.2 |
11.15±0.01b |
10.88±0.00b |
11.16±0.02b |
11.47±0.02a |
11.62±0.03a |
0.01 |
| Ash |
6.02±0.01 |
17.95±0.52a |
17.55±0.01a |
17.75±0.11a |
17.52±0.00a |
17.82±0.02a |
0.12 |
| NFE |
71.16±0.1 |
22.03±0.52a |
20.71±0.01b |
15.92±0.19e |
19.25±0.02c |
18.89±0.01d |
0.01 |
NFE=Nitrogen free extract obtained by Difference, Mean in the same row with different superscripts differ significantly (P<0.05).
Table 2: Proximate composition of sweet potato peel and experimental diets.
The mean weight gain as shown in Table 3 ranged from 10.67 ± 0.02% in Diet 1 to 11.14 ± 0.02% in Diet 3. Similarly, the specific growth rate ranged from 1.63 ± 0.04%day-1 (Diet 1) to 2.06 ± 0.05%day-1 (Diet 3). Also, Diet 3 was found to be the highest in value (1.12 ± 0.01%day-1) for protein efficiency ratio (PER), while Diet 1 with 0.96 ± 0.03 had the least value. Feed conversion ratio (FCR) ranged from 2.24 ± 0.01-2.62 ± 0.07 with Diet 3 having the lowest value while Diet 1 had the highest value. The apparent net protein utilization also ranged from 48.00 ± 0.00 in Diet 3 to 43.14 ± 0.06 Diet 2. Fish fed Diet 1 had the highest percentage survival (90.00 ± 0.00) while mortality was recorded more in fish fed Diet 5 (Survival of 63.34 ± 3.34%).
| Parameters |
Diet 1 |
Diet 2 |
Diet 3 |
Diet 4 |
Diet 5 |
P-value |
| Mean initial weight (g) |
1.70±0.01 |
1.72±0.02 |
1.71±0.01 |
1.73±0.01 |
1.75±0.01 |
0.21 |
| Mean final weight (g) |
12.37±0.02 b |
12.68±0.01 b |
12.85±0.02 a |
12.73±0.03 a |
12.410±0.01b |
0.01 |
| Mean weight gain (g) |
10.67±0.02b |
10.92±0.01b |
11.14±0.02a |
11.00±0.03a |
10.69±0.01b |
0.01 |
| SGR(% day-1) |
1.63±0.04b |
1.79±0.01b |
2.06±0.05a |
1.96±0.01a |
1.72±0.03b |
0.01 |
| FCR |
2.62±0.07a |
2.52±0.04a |
2.24±0.01bc |
2.38±0.01b |
2.45±0.09ab |
0.02 |
| PER |
0.96±0.03c |
0.99±0.02bc |
1.12±0.01a |
1.06±0.01ab |
1.03±0.04cb |
0.02 |
| ANPU |
43.17±0.02c |
43.14±0.06c |
48.00±0.00b |
46.91±0.03b |
33.19±0.01d |
0.01 |
| Survival (%) |
90.00±0.00a |
70.00±3.33e |
80.00±0.00b |
76.67±3.34c |
63.34±3.34e |
0.03 |
Mean in the same row with different superscripts differ significantly (P<0.05).
Table 3: Growth evaluation of experimental fish fed diets containing increasing inclusion levels of sweet potato peel meal.
The proximate composition of fish before and after the experiments are shown in Table 4 result revealed that moisture content of fish which was 5.03 ± 0.02% before feeding ranged from 4.14 ± 0.00% in Diet 2 to 5.11 ± 0.01% in Diet 4 after the experiment. On the other hand, crude protein content was found to increase from the initial value of 43.97 ± 0.02% before feeding to 61.23 ± 0.02% in Diet 1, 61.22 ± 0.01% in Diet 2, 63.17 ± 0.02% for Diet 3, Vitamin premix contain (as mg kg-1 of diet): Thiamine (B1), 85.00; Riboflavin (B2), 60.00; Pyridoxine (B6), 25.00; Pantothemic acid, 105.00; Inositol, 500.00; Biotin, 1.80; Folic acid, 20.00; Ethoxyquin, 4.00; Choline, 1481.00; Nicotinic acid (Niacin), 250.00; Cyanocobalamin (B12), 0.03; Retinol palmitate (A), 20.00; Tocopherol acetate (E), 140.00; Ascorbic acid (C), 750.00; Menadione (K), 30.00; Cholecalciferol (D3), 0.08 (Manufacturer’s label).
| Parameters (%) |
Initial |
Diet 1 |
Diet 2 |
Diet 3 |
Diet 4 |
Diet 5 |
P-value |
| Crude protein |
43.97±0.02e |
61.23±0.02c |
61.22±0.01c |
63.17±0.02a |
62.73±0.01b |
57.24±0.01d |
0.01 |
| Moisture |
5.03±0.02c |
4.16±0.01e |
4.41±0.00d |
5.01±0.01a |
5.11±0.01b |
5.09±0.02b |
0.01 |
| Crude fat |
5.32±0.02e |
6.56±0.01d |
7.82±0.01c |
8.18±0.01a |
7.98±0.02b |
7.81±0.01c |
0.01 |
| Crude fibre |
3.41±0.02a |
2.19±0.01e |
2.11±0.01c |
2.12±0.02c |
2.06±0.01d |
1.99±0.01e |
0.01 |
| Ash |
13.33±0.03a |
10.86±0.01e |
12.03±0.02d |
12.04±0.01c |
12.19±0.01e |
12.61±0.01b |
0.01 |
| NFE |
28.95±0.05a |
15.01±0.03c |
12.42±0.00d |
8.78±0.04f |
9.94±0.01e |
15.27±0.01b |
0.01 |
Mean in the same row with different superscripts differ significantly (P<0.05).
Table 4: proximate composition of fish before and after experiment.
Mineral premix contain (as g kg-1 of diet): MgSO4,7H2O, 20.40; NaCl, 8.00; KCl, 6.04; FeSO4,7H2O, 4.00; ZnSO4, 4H2O, 0.88; MnSO4.4H2O, 0.41; CuSO4,5H2O, 0.13;CoSO4,7H2O, 0.08; CalO3, 6H2O, 0.05; CrCl3,6H2O, 0.02 (Manufacturer’s label). 62.73 ± 0.01% obseved in Diet 4 and 57.24 ± 0.01% was recorded in Diet 5. Crude fibre, however, decrease from the initial 3.41 ± 0.01% to 2.19 ± 0.01% in Diet 1, 2.11 ± 0.01% in Diet 2, 2.12 ± 0.02% in Diet 3, 2.06 ± 0.01% in Diet 4, and 1.99 ± 0.01% in Diet 5. Furthermore, the ether extract (fat) which was initially 5.32 ± 0.02% before feeding increased with 8.18 ± 0.01% being the highest recorded in Diet 3 and lowest 6.56 ± 0.01% observed in Diet 1. The initial ash values recorded before feeding was 13.33 ± 0.03% however, final values observed in the study were 10.86 ± 0.01% (Diet 1), 12.03 ± 0.02% (Diet 2), 12.04 ± 0.01% (Diet 3), 12.19 ± 0.01% (Diet 4) and 12.16 ± 0.01% (Diet 5).
Discussion
The result of the proximate analysis of sweet potato peel shows that the crude protein, fibre, moisture and ash are similar to the reports of Abd El-Hakim et al., (2010), FAO (1992) and Oyin (2006) but at variance with the values obtained from Apata and Babalola (2012)’s experiment on cassava peel. Fish fed the five different diets responded well with no deleterious effect on growth when compared with the control diet, as significant (P>0.05) higher values where observed for MFW, MWG, SGR, FCR, PER and ANPU. However, fish fed Diet 3 and Diet 4 containing 50% and 75% inclusion of SPP meal replacement level with maize shows superior growth performance over Diet 1, Diet 2 and Diet 5 containing 100%, 75% and 25% maize meal (MM) respectively. Ramezani (2009) and Sotolu (2009); had earlier stated that high feeding rate of quality feed is directly related to fish growth performance hence, trend of growth observed in the study is an indication that the energy quality of sweet potato peel is better utilized in the diet of Clarias gariepinus fingerlings compared to yellow maize meal as growth responses were significantly affected by inclusion level of SPP in the diets. Olukunle (2006) reported that replacing yellow corn at 25%, 50% and 75% with SPP improved growth performance parameters of African catfish Fry compared to the control group however the author observed that growth was best at 25% replacement levels which was different from the outcome of this study. Also, Soltan et al., (2005) incorporated potato by-product meal (PBM) in the diets of common carp as replacement of yellow corn. The Authors reported that at higher replacing level of 50%, significant decreased in body weight, weight gain and specific growth rate were observed. Furthermore, Ghazalah et al., (2002) found that, replacing 25 or 50% of yellow corn with potatoes by-product meal did not significantly affect body weight, weight gain and specific growth rate of Nile tilapia (O. niloticus). On the other hand, Shouqi et al., (1997) concluded that as dietary potato protein concentrate increased from 0 to 51% in rainbow trout (Oncorhynchus mykiss) diets, final BW and SGR significantly decreased and mortality increased. In this connection, Saleh (2001) reported that yellow corn can be substituted by either 25% date stone (DSM) or up to till 50% potato by-product meal (PBM) in Nile tilapia diets without harmful effect on the growth performance and feed utilization of fish. Omoregie et al., (2009) incorporated sweet potato peel (SPP) in Nile tilapia diets at levels of 0; 5; 10; 15; 20 and 25 percent in iso nitrogenous (31.22% crude protein) diets and found that the greatest increase in body weight of the fish was achieved with the control diet (p<0.05) and hence growth rate decreased as level of inclusion increase. The disagreement among results of this study and those of the above referenced authors may be due to factor which may include differences in experimental fish in relation to tolerance of increase level of plant protein, processing methods of the diet as it affects anti-nutritional factor, physiological age and stage of the fish etc.
However the growth performance of fish as reported in the present study were better than reports from the experiments conducted by Balagopalan et al., (1988); Omoregie et al., (1991); Solomon et al., (1996); Oresegun and Alegbeleye ( 2001) and Bichi and Ahmed (2010) who earlier evaluated the use of cassava and yam peel in the diet of Clarias gariepinus. The superiority of the energy quality and higher protein content sweet potato peels is the reason for the differences in the studies. Also the deleterious effect of cyanide may be a major cause of difference in the growth. The highest mortality record in fish fed diet with SPP at 100% inclusion level may be due to the presence of high fibre content owing to poor digestion of cellulose and increasing level of antinutritional factor.
Proximate composition of experimental fish shows significantly higher protein and fat values in fish fed diet 3 and diet 4 compared to others. Soltan et al. (2005) experiment had revealed that there was no significant effect on carcass of common carp raised with dietary inclusion of potato by-product meal (PBM) diets in replacement of yellow corn. Also, Soltan (2002) found that increasing the inclusion level of PBM up to 50% in tilapia diets did not significantly change the protein content but the higher inclusion levels (60, 70 or 80%) significantly decreased protein and ash contents of tilapia carcass. Shouqi et al., (1997) reported that, Crude Protein content of fish decreased (p<0.05) as dietary potato protein concentrate increased from 0 to 51% in rainbow trout (Oncorhynchus mykiss) diets. Xie and Jokumsen (1997) clearly stated that incorporation of potato protein concentrate in diets of rainbow trout significantly increased ash contents of fish body. Furthermore Omoregie et al., (2009) reported that carcass of Nile tilapia fed on diet containing SPP 25% replacing yellow corn had the lowest protein content, which was significantly different from the other diets except SPP15. However there was no significant difference in ash content among the six experimental diets. Fish fed diet SPP0 recorded the highest level of lipid deposit which was significantly different from the other dietary treatments. The differences in the outcome of the various studies are likely due to the differences in utilization levels of the test fishes. The present study has demonstrated that potatoes peel meal can completely replace yellow maize in the diet of African catfish; however growth is maximized at replacement level of 50 and 75%.
8193
References
- Abd El-Hakim F. N,Lashin M. M, Al-Azab A. M. A, Fahim M. A. (2010). Effect of dietary replacement of yellow corn energy with culled sweet potato (as non traditional energy source) on growth performance, nutrients utilization and carcass traits of growing Nile Tilapia (Oreochromisniloticus) Egypt J. Aquat. Biol. & Fish.14(2): 1-17
- nAderolu AZ, OA Sogbesan.(2010). Evaluation and potential of Cocoyam as carbohydrate source in catfish (C. gariepinus;Burchell, 1822)juvenile diets. African Journal of Agric. Research.5(6); 453-457
- nAdikwu, O. (1992). Dietary carbohydrate utilization in Tilapia (Oreochromisniloticus)Journal ofAgricultural science technology.2(1):33-37
- nAgbabiaka LA, Odoemenam SA, BO Esonu. (2006). Preliminary investigation on the potentials of wild variegated Cocoyam (Caladium hortulanum) replacement for maize in diets of catfish (Heterobranchusbidorsalis) fingerlings.Int. J. Agric and Rural development.7(1): 138-142
- nAOAC (Association of Official Analytical Chemists). (1990). Official Methods of Analysis (15th ed.) AOAC Inc. Arlington, Virginia, USA, 1094pp
- nBalagopalan C, Padmaja G, Nanda S.K,Moonthy S.N. (1988). Cassava in food, feed and industry.CRC press, Inc. Boca Ration, Florida, USA.pp. 6-7
- nBichi, A.H, M.K. Ahmed. (2010). Growth performance and nutrient utilization of African Catfish (Clariasgariepinus) fed varying Dietary levels of processed cassava leaves. Journal of feed technology 4(4): pp. 289-293
- nBoyd C. E. (1981). Water Quality In Warm – Water Fish Pond. Published by Auburn University.pp.359
- nBrown M.E. (1957). Metabolism. In: (W. S. Hoar, Randal, D.D. (Eds. ). Physiology of fishes. New York. Academic Press. 447p
- nFAO.(1970). Amino acid of foods and biological data on protein.FAO of United Nations, Nutritional studies FAO UN, Rome. 285p
- nFAO, (1992).Maize in human nutrition. Food and Agricultural Organisation (FAO) food and nutrition series pp:1-13
- nGabriel, U.U., O.A; Akinrotimi, D.O. Bekibele, D.N. Onunkwu and P.E. Anyanwu(2007). Locally produced fish feed, potentials for aquaculture development in sub-saharanAfrican.Journal of Agricultural Research.297:287-295
- nGhazalah, A. A,Gomaa, I.A,Hyam D. Tonsy. (2002). The use of date stone meal (DSM) and potato by-product meal (PBM) as non-conventional energy feed sources in Nile tilapia (Oreochromisniloticus) diets. The 1st Scientific Conference of the Egyptian Aquaculture Society, El-Arish, North Sinai, Egypt, 13-15 December, 2002
- nHalver J. E. (1972).Fish Nutrition. Academic Press Inc. New York, 7f1.6 pp
- nOlukunle O.A. (2006). Nutritive Potential of Sweet Potato Peel Meal and Root Replacement Value for Maize in Diets of African Catfish (Clariasgariepinus) Advanced Fry.Journal of Food Technology.4(4): 289-293
- nOmoregie E, Ofodike E.B.O,Umaru M.S,. (1991). Growth and feeding utilization of Oreochromisniloticus fingerlings fed with Diets containing cassava peelings and mango seeds Aquabyte.4(2):55-58
- nOmoregie E,Igoche L,Ojobe TO, Absalom KV,.Onusiriuka BC. (2009): Effect of varying levels of sweet potato (Ipomeabatatas) peels on growth, feed utilization and some biochemical responses of the cichlid (Oreochromisniloticus). Ajfand online, march.9(2):700-712
- nOresegun A,.Alegbeleye W.O. (2001). Growth response and nutrient utilization of tilapia (Oreochromisniloticus) fed varying Dietary levels of cassava peels based on rations supplemented with dimethionine. Fish nutrition and fish feed technology in Nigeria, pp: 38-44
- nOyin O. (2006). Nutritive potential of sweet potato meal and root replacement value for maize in Diets of African Catfish (Clariasgariepinus) advanced fry. Journal of feed Technology.20-22pp
- nRamezani, H. (2009). Effects of different protein and energy levels on growth performance of Caspian Brown Trout, Salmotruttacapinus (Kessler, 1877).Journal ofAquatic Science.4(4), 203-209
- nSaleh H. d. Tonsy (2001). The use of non-conventional energy and protein feed sources in Nile tilapia diets. Ph. D., Animal Production Department, Faculty of Agriculture, Cairo University
- nShouqi X,Jokumsen A, Sq X. (1997). Replacement of fish meal by potato protein concentrate in diets for rainbow trout, Oncorhynchusmykiss(Walbaum): growth, feed utilization and body composition. Aquaculture Nutrition.3:65-69
- nSolomon, S.G. Lamai, S.L &Tiamiyu, L.O. (1996). Studies on the nutritional value of cassava (Manihotutillisima) peels as energy source in the Diet of Oreochromisniloticus fry fed in indoor glass Aquaria. Journal of Aquatic Science.8: 33-35
- nSoltan M.A,Abdella, M.M, Abou-Seif, R.A, Hassan M.S. (2005). Usingof tomato and potato by-products as partial replacements soybean meal and yellow corn in practical diets for the common carp (Cyprinuscarpio). Egyptian J. Nutrition and feeds.8(2): 257-272
- nSoltan M. A. (2002). Using of tomato and potato by-products as nonconventional ingredients in Nile tilapia, Oreochromisniloticusdiets. Annals of Agric. Sci., Moshtohor.40(4):2081-2096
- nSotolu A.O, (2009). Comparative utilizations of fish waste meal with imported fishmeal by African Catfish (Clariasgariepinus). American Eura Journal of Science.Revista.4(4): 285-289
- nTiamiyu L.O, Solomon S.G, Sham A.R. (2007). Growth performance of Clariasgariepinus fingerling fed cooked breadfruit (Artocarpusaltilis) seed meal as replacement for maize in outdoor pond.Journal of Feed Technology. 28: 289-293
- nXie S, Jokumsen, A. (1997). Incorporation of potato protein concentrate indiets for rainbow trout effect on feed intake, growth and feed utilization. Aquaculture Nutrition.3(4):223-226.


