Research Article - (2024) Volume 0, Issue 0
Face Off: The Socio-Political Background of the COVID-19 Syndemic in USA
Jan C Biro*
Homulus Foundation, California, United States of America
*Correspondence:
Jan C Biro, Homulus Foundation,
California,
United States of America,
Tel: +1858 5186969,
Email:
Received: 21-Sep-2024, Manuscript No. IPHSJ-24-15218;
Editor assigned: 24-Sep-2024, Pre QC No. IPHSJ-24-15218 (PQ);
Reviewed: 08-Oct-2024, QC No. IPHSJ-24-15218;
Revised: 15-Oct-2024, Manuscript No. IPHSJ-24-15218 (R);
Published:
22-Oct-2024, DOI: 10.36648/1791- 809X.18.S12.001
Abstract
Background: The COVID-19 pandemic was in reality a syndemic there the balance
between a multitude of biological (Nature-made) and socio-political (men-made)
factors determined individually the outcome of every single infection, on a scale of
nothing to fatal. Now, in 2 years distance from the syndemic, it may be timely and
possible to uncover the human contribution to this historical event and learn of it.
Objective: To identify and use some qualitative approach to estimate the
objective, statistical/epidemiological value of the virus-selected individuals (in
age-normalized groups) for the rest of the society. This non-political, non-religious
approach may be the only way to understand the benefit/cost ratio of actions and
emergency orders we had to survive in addition to the virus itself.
Methods: Statistical data were obtained from publicly available official databases,
including the relevant actuarial tables and evaluated by widely used statistical
methods. The estimation of statistical/epidemiological ‘value of life’ was based,
strictly and exclusively, on the real age and the statistically calculated Residual Life
Expectancy (RLE) i.e., remaining years alive at a given age. The American healthcare
expenses were compared to the corresponding healthcare costs/capita in other
similarly well-developed West-European countries. This was the only available
method to get some ideas about the magnitude of the well-established (rational)
healthcare spending and compare it to the American standards.
Results: 1) Life expectancy uninterruptedly increased in USA since 1933, due to
continuous reduction of Mortality Rate of the youngest and oldest citizens. COVID
didn’t stop the population growth (+8.2 M/2020-2023). 2) The total count of Excess
COVID associated Deaths (XCD) is 2 times as much as the official statistic was able
to explain by virus infection. It is speculated that these Complementary COVID
Deaths (CCD) are probably the unexpected side-effects of the pandemic related
emergency orders. 3) The worldwide ‘longevity’ trend exponentially increased the
healthcare expenses, especially the care of elderly. However, the USA is unique in
this aspect and the healthcare costs are irrationally much higher than in any other
country. 4) We can see a large economic incentive in the development of excesses
under COVID syndemic.
Conclusion: The harm of the COVID virus-as well as the benefits of the mandatory,
emergency actions during the pandemic were grossly over-estimated. Professional,
unbiased (non-religious, non-political) and independent reviews are strongly
recommended.
Keywords
COVID-19; Pandemic; USA; Mortality; Lethality; Age; Aging; Life
expectancy; Actuary table; Virus; Political; Death; Healthcare expenditure; Medical;
Pharmaceutical; True; Hearsay; Viral test; Underlying cause of death; UCOD
Abbrevations
TCD: Total COVID Deaths (#); TCM: Total COVID Mortality (ratio);
CCD: Complementary COVID Deaths (#); [CD+]: ‘true’ COVID Deaths confirmed by
viral test (#); [CD?]: ‘hearsay’ COVID Deaths, not confirmed by viral test (#); [CD+/?]:
pooled ‘true’ & ‘hearsay’ COVID deaths (#); XD: eXtra or eXcess Deaths (#); XCD: eXtra or eXcess COVID associated Deaths (#); XCM: Excess COVID Mortality (ratio);
R: Reported (#); P: Predicted (#); UCOD: Underlying Couse of Death; RLE: Residual
Life Expectancy (years); ILE: Initial Life Expectancy (years); ALE: Accomplished Life
Expectancy (years); MR: Mortality (death) Rate (ratio); TRD: Total counts of Reported
Deaths (#); TPD: Total Projected (or expected) Deaths of all causes (#)
Introduction
The COVID pandemic (2020-2022) forces the population of
many countries to face global health challenges for effective
interventions. Recent consensus is stating that the COVID
pandemic was a terribly dangerous fatal enemy of the human life,
but we the brave people, led by our vice politicians and scientific
authorities, brilliant doctors and super-effective pharmaceutical
industry came out victoriously of the war with the ‘hidden enemy’
(called even the ‘China virus’).
However, a less authoritarian and much more realistic understanding is emerging:
• An investigation is in progress regarding the possible
involvement of NIH in the active financing and advising a
“gain of function” research in China [1].
• A Civil Action - filed June 29, 2020 started a long series of
court examinations to elucidate the possible misuse of the
COVID epidemic for illegal actions related to the upcoming
presidential election 2021 [2].
• Texas states authorities are suing a company for conspiracy to censor public disclosure of the effectivity of vaccines [3].
• Unsupported records suggest that some scrupulous
companies aimed to design lethal pathogens which can by
some way and sometime contribute to the need and use of
their therapeutic vaccine products [4].
• The return of the critical reviews of the diagnostic and
statistical support for the COVID epidemic in USA is on the
way [5].
• Florida state surgeon general calls for halt in the use of COVID-19 mRNA vaccines [6,7].
A realistic and objective evaluation of the real costs and benefits
of the actions taken during the COVID pandemic is necessary to
understand (and learning from) the events during this historical
period.
Materials and Methods
It is believed, that an important methodological feature of this
article is the conscious effort to rely only on primary (source)
data regarding the COVID pandemic and evaluate them de novo and independently. Statistical data were obtained from publicly
available official databases, like epidemiologic records mostly
from Center for Disease Control (CDC), statistic over the costs of
healthcare and the relevant actuarial tables [8]. Statistical data
were evaluated by simple, widely used statistical methods like
correlation analyses.
Two different approach were used to calculate the ‘value of
human life’. 1) The ratio of age specific healthcare costs and the
estimated remaining number of years alive at a given age provided a ‘monetary value of life’ (measured as $/year) at that given age.
2) The estimated number of remaining (statistically expectable)
years to live at any given age provided the ‘potential/or exchange
value’ measured as years of that given life. The practical
use, legitimacy and limitation of use of these very sensitive
measurements (in epidemiological context) are described in the
results and discussion parts of the manuscript.
Estimation of rational healthcare spending were based on the
comparison of the American healthcare costs/capita with other
similarly well-developed West-European countries [8,9]. The
calculation of publicly available healthcare costs is complex and
seems to be somewhat chaotic for a non-expert outsider. The
central part of this article is the determination of the Excess
COVID Mortality (XM), defining and counting its components. We
determined XM by subtracting the number of average, annual
number of deaths of all causes under the COVID-free period of 10
years directly prior to the COVID pandemic (2020-2021) TPD from
the total number of reported annual deaths TRD of all-causes
during the years of the COVID pandemic.
The XM vales were further divided into two subcategories:
• Total COVID Deaths (TCD) which is the reported number of
deaths there the death certificate stated that the Underlying
Cause of Death (UCOD) was determined to be the COVID
infection.
• Complementary COVID Deaths (CCD) which defines all excess
deaths which occurred during the pandemic (i.e., associated
to the existence of the virus) but it was not possible to
establish any direct, causal relationship to the COVID virus.
The real UCOD in CCD category is the subject of speculations.
The TCD could be further divided into “True” and “Hearsay”
COVID Deaths, CD+ and CD? respectively, depending on
weather the COVID infection as the UCOD was supported by
specific and timely laboratory test for the COVID virus or not.
These unconfirmed cases of deaths are regarded “hearsay”
cases of COVID deaths because their determinations were
based more on believe than evidence.
Calculation and importance of “hearsay” COVID deaths is
described elsewhere in detail [5]. It is based on the observation
that the reported number of COVID deaths exceeded the
theoretical maximum of possible COVID infections. The “hearsay”
COVID deaths are reducing the number of CCD and, by that way,
they take away the attention from the real causes of numerous
excess fatalities which are related to the pandemic but not to the
virus itself. The short-term and long-term effects of the COVID
pandemic in the USA were estimated by monitoring the most
relevant economic parameters in the USA before and under the
pandemic, like consumer price index, stock exchange, budget
deficit and of course the National Healthcare Expenditure.
Results
Biological parameters of life in USA
General life expectancy: Convincing experience tells that all individual life-length is biologically determined and it varies from species to species. The maximal possible life expectancy for humans is say 120 years [10]. However, the actual average life expectancy depends on the people themselves i.e., the sociopolitical milieu of the time and place of living. The most used parameters of life expectancy are:
• Initial Life Expectancy (ILE): It is the expected number of years alive at the moment of birth [11].
• Residual Life Expectancy (RLE): It is the expected number of years alive at a certain age [12].
• Accomplished Life Expectancy (ALE): It is the final number of years alive at the moment of deaths. This parameter describes how well a person succeeded to live until the statistically expected (average) lifetime.
Age normalized death rates, MR(i): The successive increase of the expectable years of individual lives and the associated decrease of the MRs–was continuous, almost a century, without major variation (Figure 1).

Figure 1: Historical life and death in USA-1933-2018.
However, the contribution of different age-groups is very different. The deaths rates are close to zero for persons between ages 4 to 50 but exponentially increases after 50 until the factual deaths. Medical and social healthcare improvements postpone, but never prevent the occurrence of natural deaths (Figure 2).

Figure 2: Annual changes of mortality rates by age groups-USA: The thick red line emphasizes the first year of COVID pandemic (2020).
These continuous decrease of death rates has little effect on the age-related size of the population before age 65 and over 80 years. However, the number and life-time of persons in the ‘transition age’ (65-80) are markedly increasing (Figure 3).

Figure 3: Population of USA by age 2010-2019: The arrow and the shaded area indicates the phase-shift of population-waves toward the higher ages, i.e., the population “pattern” is very similar in 2010 (POP2010–yellow line) and 2019 (POP2019–blue line) but shifted right approx. 9 years.
Socio-economic parameters of ‘longevity’
Longer life and the associated benefits are not free. Being alive is certainly very desirable (genetically programmed) condition, consequently the ‘maintenance fee’ can be very high. An objective approach to the life and death equation is possible. 1) The life has some (any) measurable value for the involved persons and communities; 2) The person and communities have the necessary resources equivalent to this calculated value to maintain and increase the number of years alive. Medical and healthcare resources are only a small, but significant part of many options that people and societies possess to pay the price of longevity.
The ‘value’ of life: Every individual life has an arbitrary monetary value. This is well known for some professionals, like military and insurance experts and they are coldly calculating and using this value. Private persons however are not supposed to know about it, even less, to speak about it. It is taboo. The general, public consensus teaches, that the value of life is immeasurable [13]. However, there still may be a way to set a well measurable statistical value for lives in a group for statistical purposes but never for valuing an individual person’s life. This is strictly limited for the calculation and comparison on the life-to-life bases.
The ‘price’ of increasing RLE (longevity): The life has an individual, subjective value for people. These values can be positive or negative, or both.
Apart from the never ending philosophical and religious speculations, the human lives - here and now - have strong positive value. The explanation is simple: More people prefer living than not. Consequently, the count of all humans (defined as carriers of 44+2 chromosomes) is steadily increasing. The positive attitude to life is expressed by two fundamentally different ways: Reproduction and longevity.
Survival and prosperity through reproduction: This is the original, collectivistic way of staying alive by propagating your individual chromosomes. This method is often the only one available.
Survival and prosperity through longevity: This might be called the egoistic way, because it is based on concentrating the life experience in fewer number of individuals instead of dispersing it to many descendants.
The industrially more developed countries (higher BNP) are on the ‘longevity’ way: They restrain their aggression to others and invest into healthcare. The ‘longevity’ investments seems to be logical, when the religious believe in the ‘life-after-this-life’ became unrealistic for more and more persons.
There are three different approaches to try setting a measurable and comparable value on the human life.
• The value of life for the individual himself can be based on the statistical calculation of alive/dead ratio for all individuals (or the RLE) in the same age. It directly gives an objective comparison with other individuals in the same and different age-groups.
• The value of life for the collective depends on the accumulated number of available years alive for all individuals in the same age-group, i.e., it is RLE multiplied by the size (#) of the group (Figure 4). These two calculations give very similar results, as expected, except minor differences depending on the variation in the size of the age-groups.

Figure 4: Estimation of the ‘value’ of life by age groups-individually and collectively. The grey line indicates the individual Residual Life Expectancy (RLE) as percentage (%) of Initial Life Expectancy (ILE=77.4 years) by age groups (right axis). The yellow line indicates the collective RLE of an age group expressed as % of total RLE (y/1 M) (right axis). The blue line indicates the % of the USA’ population (POP=328 M) by age groups (left axis).
• The value of life can be estimated even based on the annual per capita healthcare costs [10] by age. Historical records indicate the correlation between increasing Life Expectancy and the healthcare costs, in every developed industrial country (Figure 5).

Figure 5: Development and costs of ‘longevity’ in leading countries. Bars indicate healthcare costs ($/year/capita). Lines Indicate Life Expectancy at Birth (ILE, Y: Years). AUS: Australia, CAN: Canada, GBR: Great Britain, JPN: Japan, USA: United States of America. The values in USA are emphasized by red colour and thick line.
The rapid increase of healthcare costs, in the proximity of death, is not surprising. However, the increase of per capita costs for seniorcare in USA is very large compared to other equally well developed western countries (Figure 6).

Figure 6: Annual per capita healthcare costs by age. The lines indicate the age-dependency of healthcare costs ($, value in 2015) and comparison in some well developed countries in 2012 [12].
Calculation of the cost/benefit ratio of a rational health care
A neutral approach to estimate the benefit of healthcare is the calculation of its costs [8] in relation to changes of RLE. However, it is necessary to keep in mind that any change of RLE depends on a large number of factor and not only on medical (and related) efforts (Figure 7).

Figure 7: Age vs. Healthcare costs in USA. The Residual Life Expectancy (RLE) (Green line) and the Annual Healthcare Costs (AHC) (Red line) were expressed as % of the maximal available for different age categories of the population. The ratio of these two values (C/V) is indicated (Blue shaded area).
The interference of COVID pandemic with the normal life of Americans
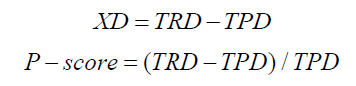
Excess Mortality (XM) during the Coronavirus pandemic (COVID-19): COVID added a new category of deaths to the traditional all-cases-mortality [14]. It is called Excess COVID Mortality (XCM) because it occurred simultaneously with the appearance of the virus infections and the pandemic-associated life changing conditions. Excess Deaths of all causes including COVID Deaths (XD)=Total counts of Reported Deaths of all causes under pandemic (TRD)-Total Projected (or expected) Deaths of all causes without COVID pandemic (TPD). The XD is often expressed as p-score (%).
Excess mortality is a more comprehensive measure of the total impact of the pandemic on deaths than the confirmed COVID-19 death count alone. It captures not only the confirmed deaths, but also COVID-19 deaths that were not correctly diagnosed and reported as well as deaths from other causes that are attributable to the overall crisis conditions. Globally, the total number of excess deaths is estimated to be two to four times higher than the reported number of confirmed deaths due to COVID-19 (incl., both deaths confirmed by specific laboratory (viral) test or not [15]). The WHO (World Health Organization) confirmed [16] that the total number of excess deaths is substantially higher than the number of confirmed deaths due to COVID-19. Consequently, the XM is the sum of two distinct categories.
• Total COVID Deaths (TCD) category contains cases their close connection to virus had been established, reported and became part of the COVID statistic:
• There the COVID virus was the Underlying Couse of Death (UCOD) and it was confirmed by specific laboratory viral test (true COVID Deaths - (CD+) and
• There the COVID was suspected as contributor to the deaths but it hadn’t been confirmed by viral test (‘hearsay’ COVID Deaths - (CD?)) [6].
• Complementary COVID Deaths (CCD) category contains all kinds of excess deaths which occurred under the pandemic but association to COVID virus itself was not possible to establish and it hadn’t been part of the official COVID statistic. It is speculated that CCM is the result of undiagnosed (“missed”) COVID cases, while some excess deaths were likely related to pandemic health care interruptions and socioeconomic disruptions (like health care delays and interruptions, housing instability, employment loss, food insecurity, social isolation, increases in poisonings, suicide, homicide, accidents and mental health issues [17-20].
Effect on the size of the population in USA
The numerically large excess mortality caused by the COVID pandemic had very little visible effect on the population of a very large country, like USA (Figure 8). (Compare to Figure 3). The estimated count of the total population grows with 8 M persons during the pandemic, compared to the 5 years average directly before the COVID events (Table 1).

Figure 8: Pre-COVID and Post-COVID population by age and years. The population count of USA, by age, before (2015-2019) and under (2020- 2023) the pandemic were compared.
| Sum of all age groups, 0-100 years old, =mean USA population (#) |
Mean 2015-2019 |
Mean 2020-2023 |
DIF= (M20-M23)-(M15-M19) |
Ratio= (M20-23)/(M15-19) |
| 324,697,807 |
332,940,554 |
8,242,747 |
1.03 |
Note:  indicates the period of COVID pandemic.
Table 1: Effect of COVID pandemic on the total population of USA.
Effect on the detailed mortality parameters: However, a very detailed analyses and comparison of all possible age groups (0- 100 years old persons) with each other revels some restructuring of the population pattern (Figure 9 and Table 2). The negative change of MR in age groups (0-14) pinpoints the possible beneficiaries of the pandemic.

Figure 9: Population changes associated to COVID pandemic in USA, 2020-2023. The difference (bars, left axis) and the ratio (line, right axis) of population, by age groups, before and under the COVID pandemic are shown. The average of annual population counts 2010-2019 and 2020-2023 were used. (See even Table 2).
| Age-group (Years) |
0-1 |
1-4 |
5-9 |
10-14 |
15-19 |
20-24 |
25-29 |
30-34 |
35-39 |
40-44 |
45-49 |
50-54 |
55-59 |
60-64 |
65-69 |
70-74 |
75-79 |
80-84 |
85-89 |
| Average MR 2020-2021 |
5.4 |
0.2 |
0.1 |
0.2 |
0.6 |
1.1 |
1.5 |
1.9 |
2.4 |
3 |
4.1 |
5.9 |
8.7 |
12.8 |
17.6 |
25.6 |
41.2 |
67.7 |
117.4 |
| Average MR 2010-2019 (R) |
5.9 |
0.2 |
0.1 |
0.1 |
0.5 |
0.9 |
1.1 |
1.3 |
1.6 |
2.1 |
3.1 |
4.9 |
7.3 |
10.4 |
14.9 |
22.7 |
35.9 |
60.8 |
106.4 |
| MR. DIFF. (XM) (#) |
-0.4 |
0 |
0 |
0 |
0.1 |
0.2 |
0.4 |
0.6 |
0.8 |
0.9 |
0.9 |
1 |
1.5 |
2.4 |
2.7 |
3 |
5.2 |
6.9 |
11.1 |
| MR. DIFF. (XM) (%) |
-7.6 |
-4 |
-1.7 |
13 |
24 |
27 |
40.7 |
51.1 |
50.6 |
44.1 |
28.7 |
20.5 |
20.1 |
23 |
18.4 |
13.1 |
14.6 |
11.3 |
10.4 |
| Historical MR.1940 |
53.7 |
2.9 |
1.1 |
1.0 |
1.7 |
2.4 |
2.8 |
3.4 |
4.4 |
6.1 |
8.7 |
12.8 |
18.5 |
26.5 |
39.6 |
61.2 |
94.4 |
140 |
208.8 |
Table 2: Excess mortality related to COVID pandemic.
The calculated weekly Excess COVID Mortality (XCM) was up to 60% over the historically expected ‘usual’ counts of deaths, corresponding to the well-known COVID mortality peeks. Less kids (age 0-14 years) died during the pandemic than expected suggesting that at least one group of people might have benefited from the exceptional rules under 2020-2023. The average XCM didn’t return to the original zero value at the end of this period of records (Figure 10).

Figure 10: Calculated excess mortality by age-groups and Weeks of Years. The weekly variation of the average P-Scores (%) of different age groups is illustrated by lines. The shaded area emphasizes the negative P-Scores almost exclusively belonging to the youngest age group.
An even deeper look at the nature and origin of the extra deaths under COVID pandemic is possible when dividing it into its natural subgroups as described above. It is especially valuable to have a closer look at the ratio of deaths which were possible to connect to the COVID virus TCD and those which were not possible to connect to the virus at all CCD (Table 3, Figures 11 and 12).

Figure 11: Origin and components of excess COVID associated mortality–using CDC method. The bars (left axis) represent the Reported (R) and Projected (P) counts of the population, the calculated excess COVID Associated Mortality (XCM); the total reported count of pooled (true) and “hearsay” COVID deaths (TCD (+&?)) and the calculated number of Collateral COVID Deaths (CCD) in the indicated years of pandemic. The lines (right axis) are indicating the corresponding p-scores (p-) and the proportion of CCDs of the XCDs.
| Year |
Reported (#) |
Predicted (#) |
R-P (#) |
(R-P)/R (%) |
Reported |
XCD-TCD (+&?) (#) |
%of XCD (%) |
| Y |
R |
P |
XCD (#) |
P-(%) |
TCD (+and?) (#) |
CCD (+ and?) (#) |
CCD (+and?) (%) |
| 2020 |
33,83,729 |
27,92,885 |
5,90,844 |
21.16 |
3,84,536 |
2,06,308 |
34.9 |
| 2021 |
34,64,231 |
27,92,885 |
6,71,346 |
24.04 |
4,62,193 |
2,09,153 |
31.2 |
| 2022 |
32,73,705 |
27,92,885 |
4,80,820 |
17.22 |
2,44,986 |
2,35,834 |
49 |
| 2023 |
29,99,999 |
27,92,885 |
2,07,114 |
7.42 |
82,539 |
1,24,575 |
60.1 |
| |
| Year |
Reported (#) |
Predicted (#) |
R-P (#) |
(R-P)/R (%) |
Reported |
XCD-TCD (+) (#) |
%of XCD (%) |
| Y |
R |
P |
XCD (#) |
P-(%) |
*TCD (+) (#) |
CCD (+) (#) |
CCD (+) (%) |
| 2020 |
33,83,729 |
27,92,885 |
5,90,844 |
21.16 |
2,88,632 |
3,02,212 |
51.1 |
| 2021 |
34,64,231 |
27,92,885 |
6,71,346 |
24.04 |
2,95,499 |
3,75,847 |
56 |
| 2022 |
32,73,705 |
27,92,885 |
4,80,820 |
17.22 |
2,44,986 |
2,35,847 |
49 |
| 2023 |
29,99,999 |
27,92,885 |
2,07,114 |
7.42 |
82,539 |
1,24,575 |
60.1 |
Note: *Calculated value, considering that the true (test positive) COVID deaths cannot be more than permitted by the frequency of positive COVID viral tests in the general population. Here the average frequency - 8.58% was used.  : The true (laboratory test confirmed) amount of COVID deaths (TCD (+);
 The two calculated components of COVID associated extra deaths, the p-values and CCD values.
Table 3: Components of extra deaths associated with the COVID pandemic-USA (2020-2023).
The average p-score of the population (all ages) was around 20%- 25% during the first two years of the pandemic, but it dropped to the 5%-10% level 2022-2023 and remained above zero after. Both components of the extra deaths XCD showed the similar pattern of changes.
However, the virus related TCD and unrelated CCD components were changing differently. This difference depends on the definition of the COVID mortality.
• Relying on the official definition-that pools the ‘true’ CD+ cases with the un-supported ‘hearsay’-based causes CD? the CCD/XCD ratio is starting 35% but increasing to 60% by time. (Upper part of Table 3 and Figure 11)
• Using the evidence-based definition that requests that the diagnosis is substantiated by specific laboratory viral test, the count of true-COVID deaths CD+ is lower than reported and the corresponding CCD is higher: The CCD/XCD ratio is starting at 50% with a slight increase by the years (~60%). (Lower part of Table 3 and Figure 12).

Figure 12: Origin and components of excess COVID associated mortality-using the evidence based method. This chart is identical to the Figure 11, except that only true, test confirmed COVID deaths were included into the count of TCD (C+) and the “hearsay-based” causes (not supported by positive viral test, (C?)) were added to the CCD instead.
These differences have no practical consequences today, the XCD counts remain the same and ‘death is death’. However, it might have significance when objectively evaluating the true magnitude of the COVID danger and compare it to the value of the human reaction.
Effects on the economy of the USA (short and long term): It is generally believed, that the COVID pandemic is solely responsible for (or at least major contributor to) the significantly increased expenses for the taxpayers, racketing healthcare costs, galloping inflation, uncontrolled increase of national debt (incl. generous printing of new money). However even if these statements are not entirely false, they are not entirely true either. More likely the virus served as a catalyst that amplified some of the already existing negative trends (weaknesses) of the recent political/ social/economical structure of the USA (Table 4).
| Name/Year |
2016 |
2017 |
2018 |
2019 |
2020 |
2021 |
2022 |
2023 |
S19-S23 |
S(%) |
| CPI-(#) (Added 2023-2023) |
241.4 |
246.7 |
252.9 |
257.3 |
260.4 |
276.6 |
298 |
307.7 |
50.4 |
19.60% |
| 257.3 |
> |
> |
> |
307.7 |
| US: DJIA-(#) (added 2023-2023) |
16,466 |
24,719 |
23,327 |
28,376 |
28,256 |
29,982 |
35,131 |
34,086 |
5,710 |
20.10% |
| 28,376 |
> |
> |
> |
34,086 |
| GNP (GDP) (Constant prices)-(T$) (Added 2023-2023) |
18.4 |
19.2 |
20.6 |
21.7 |
21.4 |
23.7 |
25.5 |
27.3 |
11.1 |
51.10% |
| 0 |
-0.3 |
2 |
3.8 |
5.6 |
| USA. National debt (ACC.,ADJ)-(T$) (Added 2023-2023) |
24.8 |
25.1 |
26.1 |
27.1 |
31.7 |
31.7 |
31.9 |
33.1 |
15.4 |
56.30% |
| 0 |
4.6 |
4.6 |
4.8 |
1.4 |
| Budget deficit-(T$) (Added 2023-2023) |
0.6 |
0.7 |
0.8 |
1.0 |
3.1 |
2.8 |
1.4 |
1.7 |
5.0 |
500% |
| 0 |
2.1 |
1.8 |
0.4 |
0.7 |
| Total national healthcare expenses-(T$) (Added 2023-2023) |
3.3 |
3.4 |
3.6 |
3.7 |
4.1 |
4.2 |
4.4 |
4.8 |
2.7 |
72.90% |
| 0 |
0.4 |
0.5 |
0.7 |
1.1 |
Note: CPI: Consumer Price Index; DJIA: Dow Jones Industrial Average; GDP: Gross Domestic Product; T$: Trillion (1012); USD; ( )Year of COVID pandemic; $19-$23: Sum of changes 2019-2023; $%: Change/2019 value (%).
Table 4: Some of the most relevant economic parameters-USA.
Correct interpretation of economic meta-data is almost a “mission impossible” for a non-expert average American meanwhile the official interpretation is sometimes unreliable. Consequently, subjective and extreme interpretations exist. Keeping in mind these difficulties we estimate the real costs of pandemic to be around 5 T$ total (corresponding to the extra budget deficit) and having two components: 1) ‘Virus-induced’ extra healthcare costs, 2.7 T$ and 2) ‘Men-made’ extra costs, 2.3 T$.
The American’s constitutional rights having been violated, by the numerous restrains under the pandemic. However, it was widely accepted as necessary under emergency conditions i.e., when the life and wellbeing of larger number of persons was seriously threatened by any natural or manmade conditions. But a dilemma is existing still not satisfactorily resolved whether the emergency situation occurred as the result. 1) The random and mindless accidental events in the Nature (like mutation) or 2) The conscious but malicious intelligence of other arrogant and greedy Humans? What caused the emergency conditions: The virus (?), the sensation driven media (?) or both?
The answer might be found in the unusual nature of the COVID infection and the weaknesses deeply rooted in the human psychology.
COVID is a syndemic: It is a synergistic epidemic, where the occurrence and interaction of multiple diseases or health conditions exacerbate their individual impact, leading to complex health challenges and increased vulnerability in populations. It is well recognized that age and preexisting comorbidities acting synergistically when COVID becomes the UCOD. There is no one documented case of death caused by COVID of a previously healthy, young individual [21].
Heterodoxy of COVID-19: COVID affects different people very differently: Infected persons experience the disease very differently and this leads to serious disagreements regarding the dangerousness of the pandemic and what is the adequate defence. As the result we could see serious disagreements up to the degree of animosity develop between persons or groups of the society, involving even the most respected scientists (experts) [22].
COVID induced ‘nocebo’ effects: In addition to well-known placebo effects, so-called “nocebo” effects also exist. Due to the placebo effect, a person recovers from an illness because they expect to recover. When a person suffers from a nocebo effect, on the contrary, they get ill just because they expect to become ill. When people expected to be infected with the “deadly China virus” every sneeze became the alarming sign of COVID infection even for otherwise cautious doctors. Not surprisingly COVID became the first and best choice when somebody died and the physicians were expected to state the UCOD on the death certificate. These nocebo generated “hearsay” COVID deaths occurred mostly in cases when the objective laboratory confirmation (specific COVID viral test) was missing of some reason [23-25].
Discussion
The archetypal fear of being sick, injured and die is very strong
and it is easy to find examples how different political and religious
ideologies, cults were and still are, able to generate massive
revenue of this weakness. There is a practical need to calculate
the material value of life (including the human life) for military
and insurance purposes. However, this kind of calculations are
usually strongly opposed by the general public. Most people
want to believe in the ‘forever’ life and the limitless value of the
living. Consequently, they react strongly for serious threats, like
an epidemic.
Hoverer there might be one general value their consensus can
be reached: People are ready to pay practically any prize to keep
themselves and the so called “loved ones” alive. This material
approach to the objective value of life might explain the cost
explosion of healthcare in the high GNP countries. Very large
proportion of profit of the medical-pharmaceutical industry
is directly related to senior care and terminal gerontology.
Consequently, a virus, like COVID is an existential threat to the
most important market of this prosperous industry (tests and
vaccines).
What did, on the other side, the public benefit from the active,
aggressive and very costly defence policy against the COVID
pandemic? It is impossible to calculate in monetary terms. A very
sensitive issue emerges when calculating the benefit/cost ration
of an aggressive anti-virus policy. The total number of Excess
COVID associated Mortality (XCM) is about twice as much as
the COVID Mortality (TCM). It is well known and confirmed fact
that 2-4 times more persons died during the pandemic than the
count of real and recognized deaths caused directly by the COVID
disease itself. The explanation is complex, like increase of suicide,
domestic violence, misuse, neglected non-COVID diseases, etc.
Statisticians tried to classify as many deaths as possible as COVID
related to reduce the gap between true COVID Mortality and
the excess COVID mortality and eliminate the complementary,
non-COVID deaths. However, the gap still exists and rises some
unpleasant questions: Is it really possible that the state-enforced,
excessive and mandatory pandemic defence killed as much
persons as the COVID virus itself?
The recent actuarial tables confirm that kids and seniors are
the major beneficiary of improving socio-economic conditions.
Elderly lives longer and spends (have to) more for healthcare
than younger. They are spending their own, well-earned and
saved money. It is easy to accept up to a rational level. It is not
difficult to accept that the average per capita health care spending
(related to the BNP of the respective countries) in well-developed
west European countries indicates the rational magnitude of
healthcare spending, even regarding the elderly.
The COVID virus showed very unusual characteristics: It infected
uncontrollably, generally and equally every single member of
the society, but it harmed only the biologically most vulnerable
minority, meanwhile the waste majority of infected persons
didn’t notice anything or, may be, some regular flu symptoms.
However, on the other hand, the aggressive defensive orders
restricted the constitutional freedom of every generation
Americans that was temporarily accepted by the people with
respect for the emergency situation. However, some of the
violations of the constitutionally guaranteed freedom, like
censorship, enforced “political correctness” seems to last
intolerably longer than it is compatible with the fundamental
nature and established laws of Americans.
Conclusion
It is concluded, that
• The value of “longevity” is increasing and it is already high
in the USA;
• The costs of longevity are extremely high in USA compared to
well-developed West-European countries;
• The COVID pandemic threatened the largest and most
profitable market of the American health-care industry
by accelerating the natural death process of elderly and
seriously sick persons;
• The state enforced defense policy was life-saving for the
medical-pharmaceutical industry;
• The benefit-cost ration of the pandemic rules is not uplifting,
especially not when, it seems to be, that as much persons
died due to the dramatic changes in life style (lockdown,
isolation, etc.) than as the result of the direct COVID disease.
It is recommended, that the people, media, politicians pay serious
attention to review and re-evaluate the events and consequences
of defence actions with the sole purpose to learn from mistakes
and not repeat them in the future. COVID pandemic-with all
certainty was not the last pandemic in the history of mankind.
Acknowledgement
The medical profession is built on solid ethical standards.
A country’s medicine is as good as the commitment of its
professionals to this standard and their character to keep their
related promise (SIC: Under oath) to the society. The author of
this article wish to express his gratitude to his colleagues who are
trying to guide this country through the massive fog associated
with the American COVID syndemic.
Conflict of Interest
The author declare that he has no known competing financial
interests or personal relationships that could have appeared to
influence the work reported in this paper.
References
- Graves MM (2023) Rand Paul Kentucky United States Senate Washington, DC 20510.
- Case 2:20-cv-00966-NR (2020) In the United States district court for the western district of Pennsylvania
- Press release by the Office of Attorney General of Texas (2023) Attorney General Ken Paxton Sues Pfizer for Misrepresenting COVID-19 Vaccine Efficacy and Conspiring to Censor Public Discourse. Ken Paxton Attorney General of Texas.
- ‘Mutating COVID-19 for New Vaccines is Under Consideration’ (2023) Project Veritas Films Pfizer Director Research and Development.
- Biro JC (2024) Critical review of the diagnostic and statistical support for COVID epidemic in USA. JMIR Preprints
[Crossref]
- Florida Health (2024) Florida State Surgeon General Calls for Halt in the Use of COVID-19 mRNA Vaccines.
- Kris W Kobach (2024) State of Kansas ex rel, Plaintiff v.Pfizer INC., Defendant: Petition.
- Esteban Ortiz-Ospina, Max Roser (2017) Healthcare Spending. OurWorldinData.org.
- The Year in Healthcare Charts (2012) 2012 - The Year in Healthcare Charts.
- Berger S, Brocke M, Zwiep I, Fontaine R, Munk R (2002) ‘His Days Shall Be One Hundred and Twenty Years’ Genesis 6:3 in Early Judaism and Ancient Christianity Zutot: Perspectives on Jewish Culture.
- Initial is relating (the length of the individual life) to the “beginning” (of individual life, the time of birth). Merriam-Webster Dictionary.
- Residual is relating to the remaining to the end. Merriam-Webster Dictionary.
- Immeasurable-very great, limitless. The value of human life is extremely great and cannot be calculated. Vocabulary.com
- Mathieu E, Ritchie H, Rodés-Guirao L, Appel C, Gavrilov D, et al. (2020) Coronavirus Pandemic (COVID-19). OWID
- Wang H, Paulson KR, Pease SA, Watson S, Comfort H, et al. (2022) Estimating excess mortality due to the COVID-19 pandemic: A systematic analysis of COVID-19-related mortality, 2020–2021. The Lancet 399(10334):1513-1536.
[Crossref] [Google Scholar] [PubMed]
- WHO (2023) Methods for estimating the excess mortality associated with the COVID-19 pandemic.
- Paglino E, Lundberg DJ, Wrigley-Field E, Zhou Z, Wasserman JA, et al. (2024) Excess natural-cause mortality in US counties and its association with reported COVID-19 deaths. Proc Natl Acad Sci USA 121;6:e2313661121
[Crossref] [Google Scholar] [PubMed]
- Shelke A, Shelke S, Acharya S, Shukla S (2023) Synergistic epidemic or syndemic: An emerging pattern of human diseases. Cureus 15(11):e48286.
[Crossref] [Google Scholar] [PubMed]
- Shir-Raz Y, Elisha E, Martin B, Ronel N, Guetzkow J (2023) Censorship and suppression of COVID-19 heterodoxy: Tactics and counter-tactics. Minerva 61:407-433.
[Crossref] [Google Scholar] [PubMed]
- Ioannidis JP (2020) Coronavirus disease 2019: The harms of exaggerated information and non-evidence-based measures. Eur J Clin Invest 50:e13222.
[Crossref] [Google Scholar] [PubMed]
- Bagus P, Peña-Ramos JA, Sánchez-Bayón A (2021) COVID-19 and the political economy of mass hysteria. Int J Environ Res Public Health 18(4):1376.
[Crossref] [Google Scholar] [PubMed]
- Bagus P, Peña-Ramos JA, Sánchez-Bayón A (2023) Capitalism, COVID-19 and lockdowns. Business Ethics, Env and Resp 32:41-51.
[Crossref] [Google Scholar]
- Hart PS, Chinn S, Soroka S (2020) Politicization and polarization in COVID-19 news coverage. Sci Commun 42(5):679-697.
[Crossref] [Google Scholar] [PubMed]
- Stroebe W, Vandellen MR, Abakoumkin G, Lemay EP, Schiavone WM, et al. (2021) Politicization of COVID-19 health-protective behaviours in the United States: Longitudinal and cross-national evidence. PLoS One 16(10):e0256740.
[Crossref] [Google Scholar] [PubMed]
- (2024) American Medical Association Code of Medical Ethics
Citation: Biro JC (2024) Face Off: The Socio-Political Background of the COVID-19 Syndemic in USA. Health Sci J Vol.18 No.S12:001.


 Clusters of age-group with * historically highest MR;
  Mostly increased relative MR during COVID epidemic;
  Mostly reduced relative MR during COVID epidemic.