Keywords
Esomus danrica; RLG; GSI; Gut; Assam
Introduction
Esomus danrica (Indian flying barb) is small freshwater fish belonging to the family Cyprinidae widely distributed in India, Pakistan, Bangladesh, Nepal, Afghanistan and Sri Lanka (Talwar and Jhingran, 1991). It also found in brackish water, drains, paddy field, wetlands and river (Talwar and Jhingran, 1991 and Gupta and Gupta, 2006). They are very active species and are able to jump to a considerable height in the water bodies. It is therefore, necessary to have a well-fitting lid on the tank or aquarium.
Fish like any other organisms depends on the energy received from its food to perform its biological processes such as growth, development, reproduction and other metabolic activities. Food is the main source of energy and plays an important role in determining the population levels, rate of growth and condition of fishes (Begum et al., 2008). Studies on the growth performance in fishes in relation to feeding period are useful information for successful application in the management and exploitation of the resources. Feeding is one of the main concerns of daily living in fishes, in which fish devotes large portion of its energy searching for food and importance in fishery biology and in successful fish farming. Detailed data on the diet, feeding ecology and trophic inter-relationship of fishes is fundamental for better understanding of fish life history including growth, breeding, migration (Bal and Rao, 1984) and the functional role of the different fishes within aquatic ecosystem (Blaber, 1997; Wootton, 1998; Hajisamae et al., 2003).
The available information on the food and feeding habit of E. danrica is very limited in the Indian sub-continent. Mustafa (1976) reported the selective feeding behaviour of Esomus danrica (Ham.) in its natural habitat. The species is widely considered as ornamental fish and sometimes found in the aquarium trade (Froese and Pauly, 2015). The fish species is included under the ‘Least Concerned’ (LC) category (IUCN, 2018). Therefore, the aim of this study was to obtain the information on different aspects of food and feeding habits of E. danrica from Upper Assam, India.
Materials and Methods
Study sites and sampling of specimens
The specimens, Esomus danrica was collected (Figure 1) from the Maijan wetland (27°30′ 14.4′′ N and 094°58′ 04.8′′ E) and fish landing sites of Guijan Ghat (27°34′ 40.27′′ N and 95°19′29.54′′ E) at Brahmaputra river of upper Assam during May, 2011 to April, 2012. A total of 500 specimens of E. danrica (383 males and 117 females) were used for the study. All the specimens were measured for total length (TL); gut length; body weight and gut to the nearest millimeter (mm) and milligram (mg) respectively. The collected specimen was immediately preserved in 5% formalin for further study. The identification of the fishes and description was done with the help of standard keys of Nelson (2006).

Figure 1: Lateral view of Esomus danrica.
Relative length of gut (RLG)
The ratio between the gut length and total length has been estimated by following procedure of Al-Hussainy (1949).
Gastrosomatic index (GSI)
It has been used to estimate the feeding intensity of E. danrica. This can be calculated as follows (Desai, 1970, and Khan et al., 1988).

Fullness of gut
It is represented visually by recording the amount of food content in the gut. The fullness was designated as empty, ¼ full, 1/2 full, 3/4 full and full as per methodology of Abdelghany (1993) and Bhuiyan et al. (2006).
Results
Body profile
In the present study, the maximum length and weight for Esomus danrica attained upto 6.8 cm and 3.4 g respectively. The average body length ranged from 4.34 (± 0.6) to 5.4 (± 0.34) cm and body weight ranged from 0.55 (± 0.11) to 2.3 (± 0.66) g. The body is elongated and lateral compressed. The dorsal profile is more or less straight. The mouth-opening is small and obliquely directed upwards. Two pairs of barbels present, the anterior pair (rostral barbels) is short, while the maxillary barbels are long and may extend at the base of the anal fin. There is a broad lateral band of a black colour extending from behind the eye to the base of the caudal fin. The body is silvery, the upper part being slightly darker. Pelvic fin somewhat reddish colour and other fins are hyaline.
Relative length of the gut (RLG)
RLG values in E. danrica showed little variation among the different size groups. The lowest value was found as 1.24 (± 0.52) in >5 cm whereas the highest values as 1.6 (± 0.7) in 4-5 cm length group (Table 1). The results reveal that RLG value was higher in younger size groups in both the species.
| Size group |
R L G |
Mean RLG |
| 3-4 |
1.3 ± 0.5 |
1.38 |
| 4-5 |
1.6 ± 0.7 |
| >5 |
1.24 ± 0.52 |
Table 1: RLG values in different size group of E. danrica
Gastrosomatic Index (GSI)
GSI in relation to months and seasonal variation for both sexes
The average monthly gastro somatic index (GSI) of E. danrica was ranged from 1.799 ± 1.396 (Dec) to 6.499 ± 2.690 (Apr) for males and from 1.81 ± 0.700 (Nov) to 5.960 ± 1.497 (Apr) for females (Table 2). As whole, the lowest GSI for both males (2.47 ± 1.52) and females (2.69 ± 0.85) was observed during postmonsoon (Sep-Nov) and that of highest GSI observed as for males (5.14 ± 1.92) and females (4.92 ± 1.0) during pre-monsoon (Mar- May).
| Month |
No. of Specimen Examined |
Males |
Females |
| Jan |
26 |
3.780 ± 0.634 |
2.946 ± 0.982 |
| Feb |
41 |
2.056 ± 0.671 |
3.943 ± 0.459 |
| Mar |
43 |
4.074 ± 0.26 |
3.963 ± 0.140 |
| Apr |
30 |
6.499 ± 2.690 |
5.960 ± 1.497 |
| May |
34 |
4.852 ± 1.452 |
4.849 ± 0.628 |
| Jun |
49 |
5.212 ± 2.732 |
4.734 ± 0.734 |
| Jul |
33 |
2.997 ± 0.52 |
2.196 ± 1.78 |
| Aug |
35 |
3.041 ± 0.25 |
2.491 ± 1.694 |
| Sep |
39 |
2.917 ± 0.766 |
3.5 ± 1.1501 |
| Oct |
47 |
2.443 ± 0.359 |
2.772 ± 2.38 |
| Nov |
72 |
2.036 ± 1.524 |
1.81 ± 0.700 |
| Dec |
51 |
1.799 ± 1.396 |
2.09 ± 0.389 |
| Total |
500 |
|
|
Table 2: Monthly mean variations of GSI in E. danrica
GSI in relation to maturity stages
In males E. danrica, the minimum GSI (3.31 ± 1.7) was observed in immature stage and that of maximum (5.14 ± 1.04) in mature stage whereas in case of females, the minimum (2.4 ± 1.1) and maximum (4.55 ± 1.3) was recorded in maturing and ripe stage respectively (Table 3).
| No. of specimen examined |
Maturity stages |
Males |
Females |
| 28 |
Immature |
3.31 ± 1.7 |
3.7 ± 1.5 |
| 60 |
Maturing |
4.9 ± 1.04 |
2.4 ± 1.1 |
| 76 |
Mature |
5.14 ± 1.04 |
3.12 ± 1.21 |
| 73 |
Ripe |
5.13 ± 1.51 |
4.55 ± 1.3 |
| 263 |
Spent |
3.53 ± 1.8 |
4.53 ± 1.3 |
Table 3: GSI at different maturity stages of E. danrica.
Fullness of gut
As far as fullness of gut in relation to months of E. danrica was concerned, the active feeding (full and 3/4 full) was recorded during November (66.7%), moderate feeding (½ full) during May (61.8%), while poor feeding (¼ full) observed during August (48.6%). Empty stomach was also recorded throughout the year with little percentage (Table 4). Again, fullness of gut in relation to the maturity stage, the highest active feeding (41.1%) was recorded in ripe species, moderate feeding (47.4%) and poor feeding (25%) in mature and immature stage respectively. The highest percentage of the empty stomach (25%) observed in immature (Table 5).
| Monthly |
No. of specimen examined |
Active feeding |
Moderate feeding |
Poor feeding |
Empty |
| Full |
¾ full |
½ full |
¼ full |
| Jan |
26 |
-- |
-- |
23.077 |
42.308 |
34.615 |
| Feb |
41 |
-- |
-- |
-- |
39 |
61 |
| Mar |
43 |
-- |
23.26 |
48.83 |
27.91 |
-- |
| Apr |
30 |
30 |
30 |
40 |
-- |
-- |
| May |
34 |
2.9 |
35.3 |
61.8 |
-- |
-- |
| Jun |
49 |
10.2 |
-- |
36.7 |
42.9 |
10.2 |
| Jul |
33 |
-- |
36.4 |
42.4 |
12.1 |
9.1 |
| Aug |
35 |
-- |
-- |
37.1 |
48.6 |
5 |
| Sep |
39 |
-- |
41 |
48.7 |
-- |
10.3 |
| Oct |
47 |
21.3 |
10.6 |
40.4 |
12.8 |
14.9 |
| Nov |
72 |
46.4 |
20.3 |
33.3 |
-- |
-- |
| Dec |
51 |
-- |
35.3 |
27.5 |
19.6 |
17.6 |
| Overall |
500 |
9.23 |
19.35 |
36.65 |
20.435 |
13.56 |
Table 4: Monthly variations of fullness of gut in E. danrica.
| Maturity stages |
No. of specimen examined |
Full |
¾ full |
½ full |
¼ full |
Empty |
| Immature |
28 |
-- |
17.9 |
32.1 |
25 |
25 |
| Maturing |
60 |
8.3 |
16.7 |
25 |
31.7 |
18.3 |
| Mature |
76 |
11.8 |
18.4 |
47.4 |
22.4 |
-- |
| Ripe |
73 |
13.7 |
27.4 |
34.2 |
19.2 |
5.5 |
| Spent |
263 |
16.7 |
22 |
33.1 |
15.6 |
12.6 |
Table 5: Percentage of fullness of gut of E. danrica at different maturity stage.
Discussion
Esomus danrica is slender body and compressed with a midlateral blackish band extending from behind orbit to the caudal fin base. Head is slightly pointed and the mouth-opening is small and upwards upturned mouth. Lateral line was often incomplete. Matthews et al. (1982) showed a strong direct relationship between mouth width and prey size. The gill-openings are large and the gill rakers are short. In the present study, there is virtually no variation observed in the morphological description of E. danrica made by Gupta and Gupta (2006).
RLG value reveals that the E. danrica is having slight variations in all the length groups. Further, it is evident that the minimum value of RLG was found in the older size groups and that of maximum in the younger size groups. Further, it depicts the species was fall in the carni-omnivorous category. It seemed that the species may be choosing its food depending on the prevalence of materials in the habitat and can subsist on a wide range of food items. The alimentary tract (guts) was not too coiled (Figure 2). The RLG appears to decrease with increase in body length in R. daniconius (Wijegoonawardana, 1990), and it does not seem to change much with increase in body length in D. aequipinnatus (De Silva et al., 1977) and B. sarana (Wijegoonawardana, 1990).

Figures 2: Alimentary tract of E. danrica.
Parameswaran et al. (1970) and Abujam et al. (2013 & 2014) found that the food and feeding habits changes as they grow into adult of N. nandus and spiny eels. Interestingly, this variation was noticed in both young and adult fish, thus ruling out any substantial change in diet. In view of the consistency in the gut length/body length ratio over the entire size range of the fish inclusive of both juveniles and adults.
The gastrosomatic index (GSI) of fish is generally used as a reflexion of the intensity of feeding (De Silva and Wijeyaratne, 1977). The lowest gastro somatic index (GSI) of E. danrica was found in January (for male) and in December (for female) while the highest was recorded in April (both male and female). The lowest GSI for both the males and females was observed during winter and that of highest during pre-monsoon for males and post-monsoon for females (Figure 3). It may be said that as a whole feeding was better in females throughout the year than in the males.
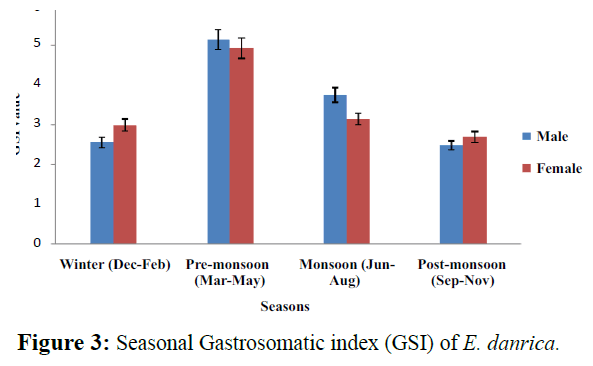
Figure 3: Seasonal Gastrosomatic index (GSI) of E. danrica.
The value of gastro-somatic index for various months showed intense feeding activity during March-April, June-August and declined from December onwards. Low feeding in winter months is because fish being poikilothermous, they are unable to ingest sufficient food due to low metabolic rate. This kind of feeding habit may be an optimal strategy for habitats where food sources are subject to seasonal fluctuations (Welcome, 1979). The variation in high and low values of feeding intensity was found much more in the case of females as compared to males because of the fact that ovaries occupy more space as compared to testes (Prakash and Agarwal,1989). However, the results were quite contrast to the finding of Rao et al. (1998) in Catla catla who reported that the feeding intensity remained high during winter months (non spawning period) and reduced during summer months (pre-spawning period). They also added that generally during spawning season, feeding rate would be relatively lower and it increases immediately after spawning as the organisms feed voraciously to recover from fast (Rao et al., 1998). The differences in the feeding habits of these fishes are perhaps due to the variations in the abundance and availability of food items in the water bodies studied.
In relation to maturity stages of E. danrica, the minimum and maximum for male GSI was recorded in immature and mature stage respectively while in case of female, minimum and maximum values recorded in maturing and ripe stage respectively. The low feeding activities in case of spent fishes coincides with the spawning season. In the present study suggested that feeding was never discontinued and even during spawning as there was no cessation of feeding. The feeding intensity of fish is related to its stage of maturity, reproductive state and the availability of food items in the environment (Khan et al., 1988; Serajuddin et al., 1988). The occurrence of low feeding in other fishes coincide with their peak breeding was reported by several workers (Fatima and Khan, 1993 and Serajuddin et al. 1988). The high feeding intensity in spiny eel (M. pancalus & M. aral) was recorded in early maturity and was relatively lower in ripening of the gonad (Abujam et al., 2013 & 2014).
The active feeding of E. danrica, was found in November, moderate feeding in May, while poor feeding observed in August. Few empty stomachs were also noted throughout the year. Most of the empty stomachs were recorded only in February. Further feeding intensity was generally low during August-October due to the faster digestive rates of carnivores (Qasim, 1972). Seasonal variation occurs in the composition of the diet of the species because availability of food organisms is often cyclic due to factors of their life histories or to climate, or other environmental conditions. The availability of food material may be the reason for higher percentage of full stomach. The result is in line with the findings of Shinkafi and Ipinjolu (2001) on the occurrence higher percentage of Synodontis clarias.
Again in relation to the maturity stage of E. danrica, the highest active feeding was recorded in ripe specimen and followed by moderate feeding and poor feeding in mature and immature stage respectively, while the highest percentage of the empty stomach was also observed in immature stage (Figure 4). Chatterjee (1974) also reported than fluctuation in feeding intensity in the fishes took place due to maturation of their gonads. Higher occurrence of non-empty stomach was due to good feeding strategy of species and food abundance in most part of the year (Fagade, 1978).

Figure 4: Percentage of fullness of gut of E. danrica in different maturity stages.
The seasonal variation in the feeding intensity of E. danrica was observed to be in the same pattern. A maximum number of empty guts were found during spawning and during the winter season (Figure 5). The seasonal variation in the feeding habits of fish resulting from climatic changes has been reported by Tuderancea et al. (1988). Intraspecific competition is reduced because different size classes rely on different food categories (Mayekiso and Hecht, 1990).
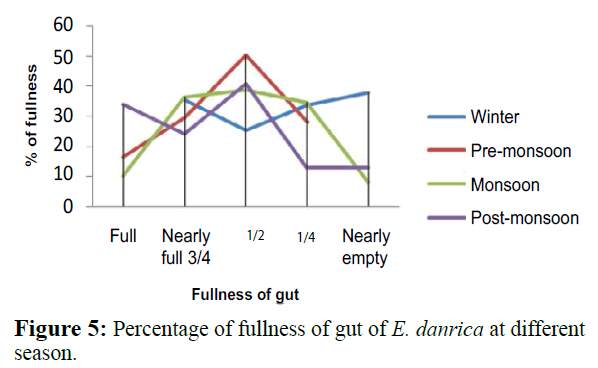
Figure 5: Percentage of fullness of gut of E. danrica at different season.
Conclusion
It is evident that RLG value of E. danrica was maximum in lower length group and that of minimum in higher length group. The lowest GSI for males and females was observed during winter and that of highest during pre-monsoon and post-monsoon. Active feeding was observed almost round the year except winter. The low feeding intensity was also recorded in spent stage. The fullness of gut revealed that active and moderate feeding observed during pre-monsoon and post-monsoon, while poor feeding during monsoon. The active and moderate feeding was found in ripe and mature and respectively and poor feeding during immature stage. The results of GSI and the fullness of stomach also indicated active feeding during pre-spawning and post-spawning period of the fish in the study.
23376
References
- Abdelghany, E.A. (1993) Food and feeding habits of Nile tilapia from the Nile River at Cairo, Egypt, In: Reintertsen, L., Dahle, A., Jorgensen, C., Twinnereim R. (editors), Fish Farm Technology, A. A. Balkema, Rotterdam, The Netherland pp: 447-453.
- Abujam, S.K.S., Shah, R.K., Soram, J.S., Biswas, S.P. (2013) Food and feeding of spiny eel Macrognathus aral (Bloch & Schneider) from upper Assam. J FishSci.com 17, 360-373.
- Abujam, S.K.S., Soram J.S., Dakua, S., Paswan, G., Saikia, A.K., et al. (2014) Food and feeding habit of spiny eel Macrognathus pancalus (Ham-Buch) from Upper Assam, India. J Inland Fish Soc India 46, 23-33.
- Al Hussainy, A.H. (1949) On the functional morphology of the alimentary tract of some fish in relation to differences in their feeding habit. Quart. J Micro Sci 92, 190-240.
- Bal, D.V., Rao, K.V. (1984) Marine fisheries; Tata McGraw-Hill Publishing Company Limited p: 457.
- Begum, M., Alam, M.J., Islam M.A., Pal, H.K. (2008) On the food and feeding habitat of an esturine catfish (Mystus gulio Hamilton) in the south-west coast of Bangladesh. Univ. J Zool Rajshahi Univ 27, 91-94.
- Blaber, S.J.M. (1997) Fish and Fisheries of Tropical Estuaries; Champan and Hall, London p: 388.
- Bhuiyan, A.S., Islam, M.K., Zaman, T. (2006) Induced spawning of Puntius gonionotus (Bleeker). J Bio-Sci 14, 121-125.
- Chatterjee, A. (1974) Studies on the biology of some carps. PhD. Thesis, Aligarh Muslim University, Aligarh.
- Desai, V.R. (1970) Studies on the fishery and biology of Tor tor (Ham.) from river Narbada. J Inland Fish Soc India 2, 101-112.
- De Silva, S.S., Kortmulder, K., Wijeyaratne, M.J.S. (1977) A comparative study of the food and feeding habits of Puntius bimaculatus and P. titteya (Pisces: Cyprinidae). Neth J Zool 27, 253-263.
- De Silva, S.S, Wijeyarante, M.J.S. (1977) Studies on the biology of young grey mullet Mugil cephalus L. 11. Food and feeding. Aquacul 12, 157-167.
- Fagade, S.O. (1978) On the biology of Tilapia guineensis (Dumeril) from the Lagos lagoon, Lagos State, Nigeria. Nigerian J Sci12, 23-87.
- Fatima, M., Khan A.A. (1993) Cyclic changes in the gonads of Rhingomugil corsula (Ham) from river Yamuna India. Asian fish Sci 6, 23-29.
- Froese, R., Pauly, D. (2015) Fish base 2015. World Wide Web electronic publication. (Accessed on 16, September, 2018).
- Gupta, S., Gupta, P. (2006) General and Applied Ichthyology: Fish and Fisheries. S. Chand & Company Limited p: 1130.
- Hajisame, S., Chou, L.M., Ibrahim, S. (2003) Feedings Habits and Trophic Organisation of the Fish Community in Shallow Waters of an Impacted Tropical Habitat; EstCoast shelf Sci 58, 89-98.
- IUCN (2009) IUCN Red List of Threatened Species (ver. 2018-1) (Accessed: 16, September 2018).
- Khan, M.S., Ambak, A.M., Mohsin, A.K.M. (1988) Food and feeding biology of a tropical freshwater catfish, Mystus nemurus with reference to its functional morphology. Indian J Fish 35, 78-84.
- Matthews, W.J., Bek, J., Surat, E. (1982) Comparative ecology of the darters Etheostoma podostemon, E. flabellare and Percina roanoka in the upper Roanoke River drainage, Virginia. Copeia pp: 805-814.
- Mayeskiso, M., Hecht, T. (1990) The feeding and reproductive biology of a South African Anabantid fish, Sandelia bainsii. Rev Hydrobiol Trop 23, 219-230.
- Mustafa, S. (1976) Selective feeding behaviour of the common carp Esomus danrica (Ham), in its natural habitat. Biol J Linean Soci 8, 279-284.
- Nelson, J.S. (2006) Fishes of the world. John Wiley and Sons. Inc. New York.
- Parameswaran, S., Radhakrishnan, S., Selvaraj, C. (1970) Some observation on the biology and life-history of Nandus nandus (Hamilton) Indian J Fish 5, 132-147.
- Prakash, S., Agarwal, G.P. (1989) A report on food and feeding habits of freshwater prawn, Macrobrachium choprai, Indian J Fish 36, 221-226.
- Qasim, S.Z. (1972) The Dynamics of Food and Feeding Habits of Some Marine Fishes; Indian J Fish 19, 11-28.
- Rao, L.M., Ramaneswari, K., Rao, L.V. (1998): Food and feeding habits of Channa species from East Godavari District (Andhra Pradesh). Indian J Fish 45, 349-353.
- Serajuddin, M.A., Khan, A., Mustafa, S. (1998) Food and feeding habits of the spiny eel, Mastacembalus armatus. Asian fish, Sci 11, 271-278.
- Shinkafi, B.A., Ipinjolu, J.K. (2001) Food and feeding habits of catfish, Synodontis clarias (Linnaeus) in River Rima, Nigeria. J Agricul Environ 2, 104-120.
- Talwar, P.K., Jhingran, A.G. (1991) Inland Fishes of India and Adjacent Countries. Oxford and IBH Publishing, New Delhi, Bombay, Calcutta 2.
- Tudorancea, C.J., Fermado, C.N., Paggy, J.C. (1988) Food and feeding ecology of Oreochromis niloticus (Linnaeus, 1758) jovenes in Lake Awasa (Ethiopia). Arch Hydrobiol 79, 267-289.
- Welcomme, R.L. (1979) Fisheries Ecology of Flood Plain Rivers. Longman Press, London p: 317.
- Wijegoonawardana, N.D.N.S. (1990) Contributions to the biology of minor cyprinids of some southern Sri Lankan reservoirs. M.Phil. Dissertation, University of Matara.
- Wootton, R. J. (1998) Ecology of Teleost Fishes; Kluwer. Academic Publisher, London p: 396.
