Introduction
The contribution of the fishery sector to global economy and food security cannot be underestimated. Fish production serves as means of livelihoods to millions of people worldwide (Green Facts, 2004). It is estimated that the inland fisheries of Africa produce 2.1 million tonnes of fish, which represents 24% of the total global production from inland waters (FAO, 2004).
Even though it is a land locked country, Ethiopia is endowed with a number of lakes and rivers, which are believed to be promising potentials of different fish stock (Felegeselam, 2003). Fisheries production in Ethiopia is under-exploited while current demand exceeds supply by about four-fold. One of the big and immediate challenges of the country is addressing the problems of food security and poverty. Artisanal freshwater fishery is one of the most important economic activities in Ethiopia (FAO, 2012). Improvements in fishery sector would contribute to poverty alleviation and environmental sustainability in Ethiopia (Global Fish Alliance, 2010).
The current annual yield of Lake Zeway is much less than the previous estimates 3000 tonnes/year. Nile Tilapia was the major composition of the catch accounting 89.3% of total catch during 1994. However, the composition had been declined to 50.9% of the total catch during 2010.
On lake Zeway, total fishermen’s were increasing tremendously. A total of 127 beach seines have been registered during 2014. The average length of beach seine during this year was 308.5m, the mean lateral length was 3.4m, and 56.3% of the beach seine’s mesh size is less than 8 cm. Report of Lake Fisheries Development Project 1997 management plan for Lake Zeway proposed gear restrictions, the recommended minimum beach seine mesh size in the cod end to be 6 cm, minimum mesh size in the wings 8 cm, and maximum allowed length 150 meters. However, it was observed that in 2014, about 56.3% of the fishermen use beach seine whose wing mesh size is less than 8 cm and 42% of the fishermen use beach seine whose cod end mesh size is less than 6 cm. The present average beach seine length is double of the recommended beach seine length and fishing materials such as gillnets were increased from, 527 to 1445 and hooks 148,009 to 408,561 and boats increased from 203 to 803 in 2014 (Megerssa et al. 2014).
The ACP Fish II programme has been developed a Lake Zeway fishery management plan (FMP) the working document. However, in this document there is no demand side information and no other studies were done before regarding the willingness to pay for lake Zeway fishery management at all. Such comprehensive investment plan for the improvement of the ecosystem should integrate people’s preferences: the willingness to pay for the improvements to take place for sustainable and wise use of the resource. Therefore, the objective of the study to identify the determinants of fishermen’s willingness to pay for fishery management and to measure mean fishermen’s willingness to pay for lake Zeway fishery management.
Methodology
Sampling Design
In this study, two-stage sampling technique was followed to select major PAs from 32 PAs where the fishermen come. During the first stage three districts where fishing activity is taking place was identified. From the total population size (1021), fifteen (15%) were taken for sample. During the second stage about 150 sample households were selected randomly based on probability proportional to size from the districts.
Survey Design And Implementation
The design of the survey followed recommendations from the NOAA Panel on Contingent Valuation (Mitchell and Carson, 1988), and consisted of three sections. Questions in the survey’s first section asked about respondent’s socio economic characteristics and survey section two covered general environmental problems and the proposed lake fishery management improvement scheme. The third section questioned respondents about their WTP. The hypothetical market was created as “Assume that Government is planning (Ministry of Water Resource) to provide an improved lake fishery management through restocking different fish species, buying and distribute boats, recommended fishing gears and after that hiring the control over the lake to manage fish for you. From the proposed project the fishermen’s will benefited by securing their ownership and cost sharing for lake fishery management. Therefore, fishermen’s are required to pay for this service.
The contingent valuation employed a single-bounded dichotomous choice format, followed by open-ended questions in the WTP section. Interviewers were supervised by the researcher. Before the main survey interviewers were trained carefully on how they approach the problem to the respondents. Three data collectors (one each from three districts administration) with college diplomas, were given one day’s training to ensure they understood each question and learned how best to approach and interview respondents to get valid information and explain the whole scenario and their levels to be used in the survey in the training session, we emphasized that they had to obtain the approval of each respondent.
The study also conducted a trial survey of 15 household/ fishermen’s heads to determine the initial fee value and work out any problems. Three starting values were chosen based on the modes of their occurrence during the pretest survey. These prices are 35, 55 and 65 birr/month, and from the total of 150 respondents, 50/50/50 respondents were randomly selected and given the respective starting price for the initial bid. Data covered socioeconomic and demographic characteristics of the household, including gender and age of household head, marital status, household size, income, and environmental attributes, such as level of environmental awareness, etc.; and design variables, such as initial fee size.
Data Analyzing Method
Both descriptive and econometric analysis was employed to infer the data. Descriptive statistics such as mean, standard deviation, percentage, ratios and frequency were used to compare and contrast different categories of sample units with respect to the desired characteristics and contingency valuation method was employed for measuring the total value fishermen give for fishery management in lake Zeway.
`In certain applications, the dependent variable is continuous, but its range may be constrained and one important model in this category is the Tobit model.
Tobin (1958) devised what became known as the Tobit (Tobin’s probit) or censored normal regression model for situations in which y is observed for values greater than 0 but is not observed (that is, is censored) for values of zero or less.
Tobit model is for metric dependent variable and when it is “limited” in the sense we observe it only if it is above or below some cut off level. It is also called censored regression model. Censoring can be from below or from above, also called left or right censoring. The Tobit model uses all of the information, including information on censoring and provides consistent estimates.
It is important to note that the dependent variable, or the WTP, is not fully observed and the dependent variable assumes zero values for a substantial part of the sample but positive for the rest of the population. Ordinary least squares (OLS) on the whole sample or just the uncensored sample will provide inconsistent estimates of β. Because an OLS estimator cannot be applied, we use a Tobit model for the observed maximum willingness to pay (MWTP).
Let MWTP* be a latent variable which is not observed when it is less than or equal to zero but is observed if it is greater than zero. Following Wooldridge (2009), the Tobit model for observed MWTP is given by:


MWTP*=Fishermen’s unobserved maximum willingness to pay for improved lake fishery management
MWTPi=Actual fishermen’s maximum willingness to pay for improved lake fishery management
Xi=a vector of explanatory variables
β=a vector of coefficients
?i=the disturbance term
Results and Discussion
Household Characteristics and Test of Mean and Frequency Differences
According to the survey results, 100% of the respondents were male. This might be because of the fishing activity especially, harvesting from the lake is culturally the male responsibility.
The average monthly income from fish was 2339.17 birr/ month with minimum 200 and maximum 7800 birr/month. From the surveyed fishermen’s 56% has no alternative income other than fishery and 44% has alternative income other than fishery. The mean difference between the willing and non-willing respondents was insignificant for the monthly income from fish.
The mean age of the respondents was 33.38 years with the youngest 17 and oldest 65 years. The mean age for willing respondents was 34.42 years and for non-willing respondents 30.19 is years. Mean of the age statistically significance difference between the older and younger respondents at 1% probability level. It implies that, the older respondents high willing to pay than the younger respondents.
Out of the total sample 92.67% were literate and 7.33% were illiterate. The average educational status of the respondents was 5.71 years. The willing fishermen’s/respondents mean educational level was 6.34 years and non-willing respondents was 3.76 years. The mean educational level of the respondents was significantly different from each other at 5% probability level. It indicates that the more educated respondents the more willing to pay for fishery management.
The average household size was 4.04 with zero and 14 minimum and maximum sizes respectively. The average household size of willing respondents and non-willing respondents were 4.45 and 2.78 respectively. About 83.32% of the respondents had household size of 0-6, while 16.68% had household size of 7-14. The mean difference of household size was statistically significant between willing and non-willing respondents. The survey shows that, the higher number of household’s respondents the higher willing to pay for fishery management.
The average experience of the respondents was 11.12 years with minimum and maximum 1, 45 respectively. The average experience of the willing and non-willing was 12.76 and 6.11 respectively. From the total sample of fishermen’s 23.34% was participate in fishing activity 3-15 days per month while 76.66% was participate in fishing activity 16-30 days and the mean average of fishing days/month was 18.78 days with minimum and maximum of 3 and 30 days per month respectively. Accordingly, mean experience of the respondents was statistically significant at 1%. This implies that respondents with long fishing experience were willing to pay for fishery management than shorter experienced fishermen.
The mean difference of the alternative income of the respondents was statistically significant at 1% probability level. That means respondents who have alternative income less willing to pay for fishery management than respondents who have not alternative income.
Actually, the two groups may not only differ in terms of continuous variables, but also in terms of discrete variables. In this case, a chi-square test was used to examine the existence of the statistically significant mean difference between the two groups. Therefore, three discrete variables were considered in this test (Table 2). The survey shows that, there is a wide differences in marital status, perception and membership status between the willing and non-willing households in the fishery management. The difference is highly significant at 1% probability level. This indicates married respondents more willing to pay than single or divorced. The respondent’s environmental perception indicates that, the respondents who have environmental perception are good the more willing to pay than their counterpart and similarly the membership status of the respondents.
| No |
Items |
Willing |
Non-willing |
Total |
t-value |
| No |
Mean |
No |
mean |
No |
mean |
| 1 |
Experience |
113 |
12.76 |
37 |
6.11 |
150 |
11.12 |
3.8104*** |
| 2 |
Age |
113 |
34.42 |
37 |
30.19 |
150 |
33.38 |
2.4866*** |
| 3 |
Education status |
113 |
6.34 |
37 |
3.76 |
150 |
5.71 |
2.2866** |
| 4 |
Monthly income from fish |
113 |
2470.44 |
37 |
1938 |
150 |
2339.17 |
1.4101 |
| 5 |
Household size |
113 |
4.45 |
37 |
2.78 |
150 |
4.04 |
3.2143*** |
| 6 |
Alternative income |
113 |
214.60 |
37 |
428.40 |
150 |
267.33 |
-3.4891*** |
*** and ** statistically significant at 1% and 5% respectively.
Table 1: t-test for mean difference of continuous variables.
| No |
Items |
Willing |
Non-willing |
Total |
χ2-value |
| No |
% |
No |
% |
No |
% |
| 1 |
Marital status |
|
|
|
|
|
|
|
| |
Married |
81 |
84.93 |
15 |
59.26 |
96 |
64 |
11.7319*** |
| |
Single |
32 |
15.07 |
22 |
40.74 |
54 |
36 |
|
| 2 |
Cooperative Membership status |
|
|
|
|
|
|
|
| |
Member |
81 |
84.93 |
15 |
59.26 |
96 |
64 |
11.7319*** |
| |
Non-member |
32 |
15.07 |
22 |
40.74 |
54 |
36 |
|
| 3 |
Perception |
|
|
|
|
|
|
|
| |
Good |
90 |
81.08 |
21 |
58.97 |
111 |
74 |
7.5901*** |
| |
Poor |
23 |
18.92 |
16 |
41.03 |
39 |
26 |
|
*** Statistically significant at 1% probability level
Table 2: Characteristics of the sample respondents for discrete variables.
Willingness to Pay for Lake Zeway Fisheries Management
Out of the total sample fishermen’s (150), about 113 (75.33%) are willing to pay for the fishery management program and 37 (24.67%) are non-willing to pay for the program. Specified reasons for not willing to pay for proposed plan was that 45% are poor and cannot afford any amount for the proposed management, 35% are satisfied with the status quo and 20% mentioned Proper management of the lake is the responsibility of the government
From the survey, out of 50 respondents who were given 35 birr as a starting price, 56% respond a yes and 44% have no answer for the first bid. Out of 50 respondents who are given 55 birr as initial bid, 36% gave a yes and 64% a no response. Whereas out of 50 respondents who were given 65 birr as starting price, 8% and 92% gave a yes and no answer for the starting price respectively. The respondents were also asked about the methods or way of payment. Therefore, 47.26% of them were willing to pay with social associations like ikub and idir, 39.04% were willing to pay direct payment and 13.70% wants to pay with water bills.
The mean willingness to pay amount was 36.97 birr/month with minimum and maximum amount of zero and 120 birr per/ month respectively. The monthly average WTP of the sampled fishermen’s accounts 1.71% of average monthly income of fishermen’s which was birr 2339.17 and it is below 5% (Table 3).
.
| Explanatory variables |
Estimated coefficients |
Standard error |
t-value |
| CONSTANT |
-5.51906 |
1.32045 |
-1.21 |
| HHSIZE |
0.8367961 |
1.032274 |
0.81 |
| EXP |
1.21257 |
0.278762 |
4.35*** |
| EDU |
3.343935 |
0.6899948 |
4.85*** |
| AGE |
0.1781518 |
0.3418124 |
0.52 |
| lnINCF |
9.815174 |
3.162466 |
3.10*** |
| ALTINC |
-0.0249203 |
0.0067456 |
-3.69*** |
| MARITAL |
5.337451 |
5.463627 |
0.98 |
| PERCEP |
13.86777 |
5.079294 |
2.73*** |
| COOPMEMBER |
3.065714 |
4.857931 |
0.63 |
| INTBID |
0.0354365 |
0.1949518 |
0.18 |
Number of Observation=150
- 37 left-censored observations at mwtp<=0
- Log Likelihood function=-552.91
- Threshold value for the model: Lower=0.0000 Upper=+infinity
|
***, indicate significant at 1% probability level
Table 3: Maximum likelihood estimates of the Tobit model.
Derivation of Aggregate Demand And Estimation Of Total Revenue
The aggregate demand for fishery management has been derived from WTP information. The aggregate demand curve is derived using the mid willingness to pay amount along the vertical axis and the number of households' willing to pay at least that mid value along horizontal axis. As shown in Figure 1, the demand curve is negatively sloped indicating the fall of the demand for improved fishery management as user charges increase, like most other economic goods.
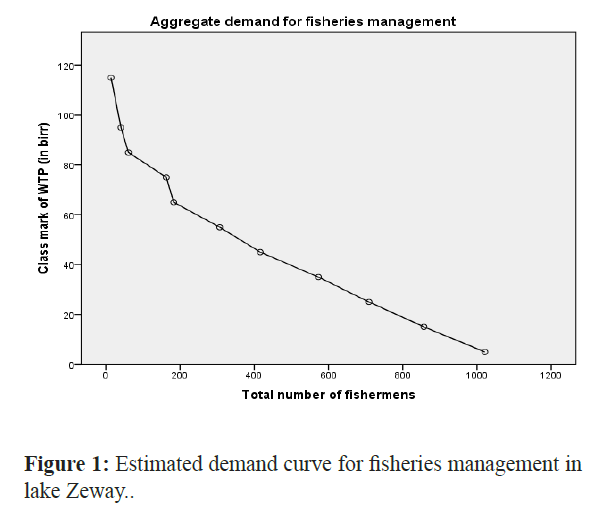
Figure 1: Estimated demand curve for fisheries management in lake Zeway..
Aggregating the mean WTP value over these fishermen households will give a total of 37,746.37 birr/month or 452,956.44 birr/year.
Total revenue that can be collected from charging a given price is obtained by multiplying the class mark by the corresponding total number of households willing to pay at least that amount. Therefore, total revenue first increases as monthly payment increases and reaches a maximum of 20,020 birr per month when the monthly payment is 35 per household. After that it decreases and reaches a minimum of 1,470 birr per month at the highest service charge due to a small number of households willing to pay that amount (Figure 2).
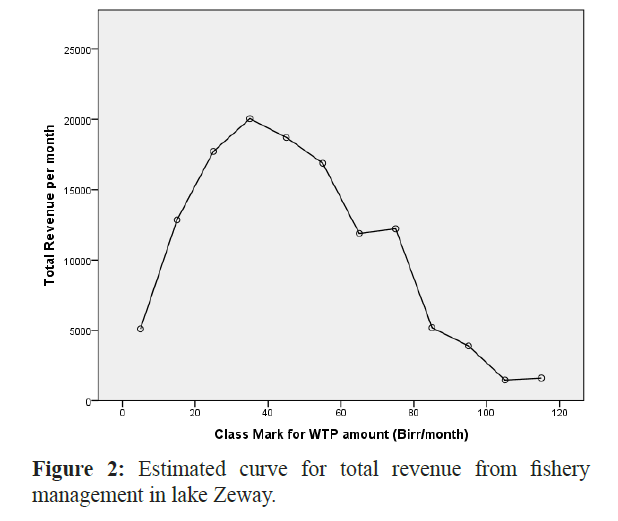
Figure 2: Estimated curve for total revenue from fishery management in lake Zeway.
Econometric Model Results
Estimate of the parameters of the variables expected to affect willingness to pay for fishery management is shown in Table 3. The dependent variable is a continuous variable that individuals respond as maximum willingness and ability to pay for the improvement service recalling the benefits expected out of it. A total of 10 explanatory variables were considered in the econometric analysis, out of which five variables were found to significantly influence the individual willingness to pay for fishery management.
Monthly Income from Fish
The variable has positive impact on the WTP as expected and its effect is strongly significant (P<0.01). The marginal effect shows that, when the monthly income from fish of the fishermen’s increase by one birr, it will increase the probability of willingness to pay for fisheries management by 0.07%. And also when fishermen’s catch/income from fish increase by 1 birr, the amount of cash the fishermen’s could pay for fisheries management would increase by 0.08 birr other factors 3being constant (Table 4).
| Explanatory variables |
Change in probabilities as independent variables changes |
Change among individual who are willing to pay |
Change among the whole |
| HHSIZE |
0.0056851 |
0.6042585 |
0.7581706 |
| EXP |
0.008238 |
0.8756084 |
1.098636 |
| EDU |
0.0227182 |
2.414688 |
3.029738 |
| AGE |
0.0012103 |
0.1286451 |
0 .1614126 |
| lnINCF |
0.0666828 |
7.087632 |
8.892938 |
| MARITAL |
0.0377676 |
3.807462 |
4.805971 |
| COOPMEMBER |
0.0213167 |
2.198475 |
2.768177 |
| PERCEP |
0.1120692 |
9.467098 |
12.18017 |
| ALTINC |
-0.0001693 |
-0.0179952 |
-0.0225788 |
| INTBID |
0.0002407 |
0.025589 |
0.0321068 |
Table 4: Marginal effects of the explanatory variables on the amount of WTP.
Experience of the Respondents
The result of the model showed that fishing experience is positively and strongly significant (p<0.01) to willingness to pay for fishery management. The marginal effect result shows that for each additional increase in years of experience of the respondents, the probability of the willingness to pay for fishery management will increase by 0.82%. Also as the experience of the respondents increase by one year, the amount of cash he is willing to pay for improved fishery management may increase by 0.88 birr, ceteris paribus. The probable reason for this might be that fishermen’s who have started fishing earlier might have developed good knowledge about the trend of fishery production problem.
Educational Level
Education level of household head influenced positively and significantly (P<0.01) on willingness to pay for fisheries management at lake zeway. Marginal effect of the variable indicates that, respondents being educated, the probability of willingness to pay for fisheries management increases by 2.27%. And also, as the years of education increases by one year, the amount of cash the household is willing to pay for fishery management may increase by 2.41 birr, other factors held constant.
Alternative Income
Having alternative income of the respondents was influenced negatively and significantly (P<0.01) on willingness to pay for fisheries management. The marginal effect shows that, those respondents having alternative income are 0.02% less willing to pay than those respondents have no alternative income. Also, respondents having alternative income are less willing to pay 0.018 birr than those who have no alternative income, ceteris paribus.
Perception of the Respondents
Perception of environmental problem is another important factor that was positively and significantly (p<0.01) influenced the WTP for fisheries management. The marginal effect of the variable shows that, those respondents having good knowledge of environmental problem or perceive lake fishery is under mismanagement have 11.21% more probability of paying for fishery management compared to respondents who didn’t recognize the mismanagement of lake Zeway fishery management. Also, respondents having good knowledge of environmental problem or perceive lake fishery is under mismanagement are willing to pay 9.47 birr more for fishery management than those who perceive the fishery management is safe or poor knowledge, ceteris paribus.
The finding of this study clearly shows socioeconomic characteristics and fishing related variables that affect respondents WTP for fishery management. Based on the research findings we can draw the following recommendations:
The strong positively relation between income from fish and willingness to pay of the respondents shows that fishing is the main economic activity of the respondents and since the current situation of the fishing activity is open access, the management interventions should be needed from government or any stakeholders through licensing and applying the tax payment on the users.
Alternative income negatively affects the WTP of the respondents. It indicates that, having income other than fishery reduces the ownership responsibility for fishery management. Therefore, diversifying the income of the fishermen’s to reduce the pressure of fishing is needed.
Education, perception and experience of the respondents were affects the WTP positively and significantly. Therefore, training, awareness creation, education through formal and informal should be needed to fulfill the gap of perception of the respondents about problem of Lake Fishery management.
Even if the proclamation was available, still the governmental bodies did not give attention for fishery sector as done for other livestock and crop production. In monthly reporting format the fishery was not included and due to this extension contact was zero. Therefore, governmental bodies should be including the fishery in their program to increase the fishermen’s awareness about fishery management and to implement food security of the fishery
Acknowledgement
Words cannot express my heartfelt thanks to my wife Meti Takele who supported, inspired and encouraged me and also for her patience during the research work. I would like to express my sincere gratitude to Oromia Agricultural Research Institute for funding the research work. I would also like to thank Mr. Getachew Senbete the director of Zeway fisheries resources research center and the rest of the staff for their positive cooperation. Thank you so much for your support. I could not have done it without your friendship.
8186
References
- nFAO (2012). Fisheries and Aquaculture department: fisheriesngovernance
- nFelegeselam Yohannes.,(2003). Management of Lake Ziway fisheries in Ethiopia. Thesis of Master of Science in InternationalnFisheries Management. Department of Economics, NorwegiannCollege of Fishery Science, University of Troms
- nGlobal Fish Alliance., (2010). The importance of capture fisheries innfood security in Ethiopia. Fact sheets on state of fisheries innAfrican countries
- nGreen Facts (2004). “World Fisheries Production”. www.greennfacts.org/fisheries/04- utilization.htm. retrieved on Januaryn13, 2006
- nLFDP (1997). Lake management plans. Lake fisheries developmentnproject, phase II: working paper 23. Ministry of Agriculture.nAddis Ababa
- nMegerssa E., Alemu L., Tilahun G., Assefa M., Eshete D., HussiennA., and Bulbula R (2014) Fisheries Base Line Survey: A toolnto design Community Based Fisheries Management of LakenZeway (Ethiopia), Ethiopian Fisheries and aquatic SciencenAssociation proceedings, Mekele University
- nMitchell RC., Carson RT., (1988) “Using surveys to value PublicnGoods: The Contingent Valuation Method.” Resource fornthe Future.Washington D.C
- nTobin J., 1958. “Estimation of Relationships for LimitednDependent Variables.” Econometrica 26:24–36