Keywords
Olmesartan Medoxomil, Lipid Based Formulation, Transmittance, Dissolution
Introduction
Olmesartan medoxomil (OLM) is a non peptide, orally active and specific angiotensin II antagonist acting on the AT1 receptor subtype. OLM is poorly soluble and aqueous solubility is reported to be less than 1 mg/ml. The drug is rapidly absorbed following oral administration, with a bioavailability approximately 26%. Peak plasma concentrations of OLM occur 1 to 2 h after an oral dose and are highly bound to plasma proteins (99%) [1]. Rapid onset of action is desirable to provide fast relief in the treatment of heart failure. Therefore, it is necessary to enhance the aqueous solubility and dissolution rate of OLM to obtain faster on set of action, minimize the variability in absorption, and improve its overall oral bioavailability. The various formulation strategies reported in the literature include the use of surfactants, cyclodextrin complexes, nanoparticles, solid dispersions, micronization, lipids, and permeation enhancers [2]. There has been increasing focus on the utility of lipid-based formulations are reported to assist the absorption of poorly soluble drugs by reducing the inherent limitation of slow and incomplete dissolution [3]. In addition to all these approaches, preparation of lipid-based formulation was tried to make formulation process easier. The main aim of the study was to develop Olmesartan Medoxomil Type I and IV lipid based formulation to improve upon the solubility of the Olmesartan Medoxomi which will have some bearing on the bioavailability. Type I systems are mixtures of lipophilic materials which have little or no solubility in water. Typically they are blends of food glycerides derived from vegetable oils, which are safe for oral ingestion, rapidly digested, and absorbed completely from the intestine. Because Type I systems do not contain surfactant they have very limited ability to selfdisperse in water. Although precipitation may sometimes be a problem, Type I formulations are an excellent option if the drug is sufficiently soluble in mixed glyceride oils. Bioavailability may be as good from Type I formulations as Type II and Type III formulations, and Type I formulations certainly have advantages, in relation to safety and drug stability. Type IV systems are essentially pure surfactants or mixtures of surfactants and co-solvents. It is generally accepted that formulation of poorly watersoluble drugs in pure co-solvents is likely to result in precipitation of the drug. The only advantage that could be gained is the possibility that the drug precipitates as a suspension of very fine crystalline or amorphous particles [4].
Material and Method
Material
Olmesartan Medoxonil was a kind gift from Torrent Research Centre, Ahmedabad, India. Gift samples of Acrysol K 140 (polyoxyl 40 hydrogenated castor oil) and Acrysol El 135 (Polyoxyl 35 castor oil) from Corel Pharma chem., ahmedabad, India. Captex 100 (Propylene glycol dicaprate ester), Captex 200 (Mixed diesters of caprylic / capric acid), Capmul C8 (Glycerol mono-dicaprylate), and Capmul MCM C8 was obtain from Abitec Corporation, USA as a gift sample. Transcutol P (Diethylene glycol monoethyl ether) and Labrasol (Caprylocaproyl macrogol-8 glycerides) were gifted from Gattefosse, france. Sunflower oil, Castor oil, Cotton seed oil and olive oil were purchased from market. Tween 80 (polysorbate 80), Tween 20 (polysorbate 80), Span 20, Span 80, PEG 400 (Polyethylene glycol), PG (Propylene glycol) and Methanol were procured form S. D. Fine Chemicals, Mumbai, India. All other chemicals were of analytical grade.
Method
Solubility Studies
The solubility of OLM in various oils, surfactants, and co-surfactants was determined, respectively. 3 gm of each of the selected vehicle were added to each cap vial containing an excess of OLM. After sealing, the mixture was heated at 400C in a water-bath to facilitate the solubilization using a vortex mixer. Mixtures were shaken with shaker at 250C for 48 h. After reaching equilibrium, each vial was centrifuged at 3000 rpm for 5 min, and excess insoluble OLM was discarded by filtration using a membrane filter (0.45 μm, 13 mm, Whatman, USA). The concentration of OLM was quantified by U. V. Spectrophometer at 257nm [5].
Formulation of Type I and IV Lipid Based Formulation (LBF)
Type I and IV Lipid based formulation was made by using different oil and different type and concentration of surfactant and co-surfactant. Different formulation was tabulated in table 1. All formulation contain 500mg ingredient respectively.
| Formulation |
Batch |
Ingredient |
| Type I |
S1 |
Capmul MCM + 25 mg OLM |
| Type I |
S2 |
Capmul MCM C8 + 25 mg OLM |
| Type I |
S3 |
Sunflower oil + 25 mg OLM |
| Type IV |
S4 |
Acrysol K 140 +25mg OLM |
| Type IV |
S5 |
Acrysol EL 135 +25mg OLM |
| Type IV |
S6 |
Acrysol K 140: Transcutol-P (1:1)+ 30 mg OLM |
| Type IV |
S7 |
Acrysol El 135: Transcutol-P (1:1)+ 30 mg OLM |
Table 1: Different formulation of Type I & Type IV LBF.
Macroscopic Evaluation
Macroscopic analysis was carried out in order to observe the homogeneity of lipid formulations. Any change in color and transparency or phase separation occurred during normal storage condition (37±2ºC) was observed in optimized lipid formulation.
Transmission test
Stability of optimized lipid formulation with respect to dilution was checked by measuring transmittance through U.V. Spectrophotometer (UV-1700 SHIMADZU). Transmittance of samples was measured at 650nm and for each sample three replicate assays were performed [6].
Robustness to dilution
Robustness of formulation to dilution was studied as per Date and Nagarsenker’s method with slight modification [7]. Formulation was diluted to 100 and 1000 times with various media viz. water, pH 1.2 buffer and pH 6.8 buffer. The diluted formulation were stored for 12 h and observed for any signs of phase separation or drug precipitation.
Stability
Temperature Stability
Shelf life as a function of time and storage temperature was evaluated by visual inspection of the lipid formulation at different time period. Lipid formulation was diluted with purified distilled water and to check the temperature stability of samples, they were kept at three different temperature range (2-8°C (refrigerator), Room temperature) and observed for any evidences of phase separation, flocculation or precipitation.
Centrifugation
In order to estimate metastable systems, the optimized lipid based formulation was diluted with purified distilled water. Thenformulation was centrifuged (Remi Laboratories, Mumbai, India) at 1000 rpm for 15 minute at 0°C and observed for any change in homogeneity of microemulsions [8].
In vitro release of OLM
In vitro drug release of OLM from optimized LBF was performed by a conventional method. A hard gelatin capsule size “0” filled with percentage (equivalent to 10 mg OLM) and pure drug (10 mg) separately ware put into each of the 900 ml phosphate buffer pH 6.8 at 37±0.50C with 50 rpm rotating speed. Samples (10 ml) were withdrawn at regular time intervals (5, 10, 15, 30, 45, 60, 90 and 120 min) and filtered using a 0.45μm filter. An equal volume of the respective dissolution medium was added to maintain the volume constant. The drug content of the samples was assayed using UV visible spectrophotometric method. All measurements were performed in triplicate from three independent samples [9].
Statistical analysis
The U.S FDA’s guidance for industry on dissolution testing of Immediate release (IR) solid oral dose forms (1997), as well as SUPAC-IR (1995), SUPACMR (1997) and bioavailability and bioequivalence study guidance for oral dosage forms, describes the model independent mathematical approach proposed by Moore and Flanner for calculating a dissimilarity factor f1 of dissolution across a suitable time interval. The similarity factor f2 is a measure of similarity in the percentage dissolution between two dissolution curves and is defined by following equation: [10]

Where n is the number of withdrawal points, rt is the percentage dissolved of the reference at the point t (marketed product of LOV) and tt is the percentage dissolved of the test at the time point t (SMEDDS formulation). A value 100% for the similarity factor (f2) suggests that the test and reference profiles are identical. Value between 50 to 100 indicate that the dissolution profile are similar value imply and increase in dissimilarity between release profile.
Determination of drug content
OLM from optimized lipid formulation was extracted in methanol using the sonication technique. The methanolic extract was analyzed for OLM content spectrophotometrically at a wavelength of 257 nm after suitable dilution [5].
Results and Discussion
Solubility Study (Screening of Oil)
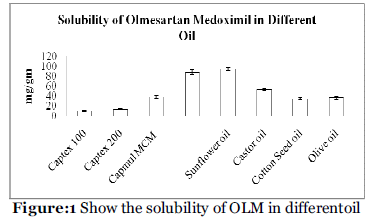
Solubility studies were aimed at identifying a suitable oily phase for development of OLM LBF. Identifying the suitable oil having a maximal solubilizing potential for the drug under investigation is very important to achieve optimum drug loading [11,12]. Solubility of OLM in various oily phases is presented in Table 2 and Figure 1. Among the various oily phases that screened, Capmul MCM C8 could solubilize the target amount of OLM (87.89 mg) in relatively quantity of 1gm. The experiment was repeated in triplicate and the result represents the mean value (mg/gm ± SD)
| Oil |
Solubility
(mg/gm) |
| Captex 100 |
10.78 ± 1.34 |
| Captex 200 |
13.45 ± 1.09 |
| Capmul MCM |
37.89 ± 2.78 |
| Capmul MCM C8 |
87.89 ± 4.56 |
| Sunflower oil |
94.45 ± 3.67 |
| Cotton oil |
53.78 ± 2.30 |
| Cotton seed oil |
34.65 ± 1.89 |
| Olive oil |
36.76 ± 2.78 |
a Data expressed as mg/gm ± SD (n=3).
Table 2: Solubility of OLM in different oil.

Figure 1: Show the solubility of OLM in differentoil
Screening of Surfactant
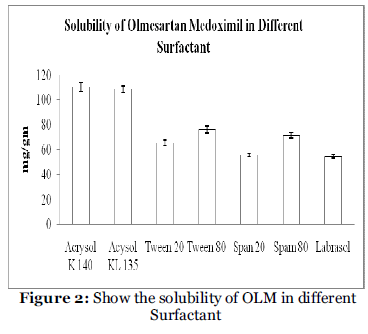
Nonionic surfactants are generally considered less toxic than ionic surfactants. They are usually accepted oral ingestion. In this study, the five nonionic surfactants (Tween 80, Tween 20, Acrysol K 140. Acrysol El 135, Span 20, Span 80 and Labrasol ) were selected, of which some are reported to have bioactive effects, like lymphotropic characters by Tween 80, Tween 20, and Span 80 and inhibitory effect on p-gp and CYP enzyme such as Acrysol K 140. Acrysol El 135. These findings were confirmed by Zhang et al., 2003 [13], who demonstrated increased AUC and Cmax for orally administered digoxin in rats when co-administered with Cremophor®. Solubility of OLM in various surfactant phases is presented in Table 3 and Figure 2. Among the various non-ionic surfactants that screened, Acrysol K 140 could solubilize the large amount of OLM (110.56 mg) in relatively quantity of 1gm. The experiment was repeated in triplicate and the result represents the mean value (mg/gm ± SD).
| Surfactant |
Solubility (mg/gm) |
| Acrysol K 140 |
110.56 ±3.67 |
| Acrysol K 135 |
108.67 ± 2.35 |
| Tween 20 |
65.43 ± 2.38 |
| Tween 80 |
76.52 ±2.67 |
| Span 20 |
55.76 ± 1.23 |
| Span 80 |
71.56 ± 2.67 |
| Labrasol |
54.5 ± 1.23 |
a Data expressed as mg/gm ± SD (n=3).
Table 3: Solubility data of OLM in different surfactant.

Figure 2: Show the solubility of OLM in different Surfactant.
Screening of Co-surfactant
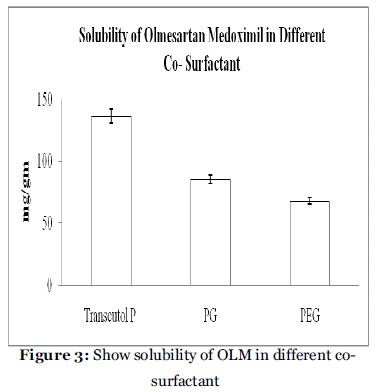
Co-surfactant is required with surfactant in LBF Type IV for reported to improved dispersibility and drug absorption from the formulation6. In view of the current investigation, three co-surfactant, namely PEG 400, PG and Transcutol P, as depicted in table 4, Transmuctol-P exihibited good emulsification with Acrysol K 140 and Acrysol EL 135. The experiment was repeated in triplicate and the result represents the mean value (mg/gm ± SD).
| Co-surfactant |
Solubility (mg/gm)a |
| Transcutol P |
135.89 ± 5.78 |
| PG |
85.34 ± 3.54 |
| PEG |
67.90 ± 2.76 |
a Data expressed as mg/gm ± SD (n=3).
Table 4: Solubility data of OLM in different co- surfactant.

Figure 3: Show solubility of OLM in different cosurfactant.
Transmission test
LBF are diluted with different medium like Water, pH 1.2 buffer and pH 6.8 buffer for 50 times and 100 times. Samples are analyzed at 650 nm. The results of transmittance value are shown in Table 5.
| Batch No. |
Transmittance (%) ± S.D. |
| 50 Times Dilution With Water |
100 Times Dilution With Water |
50 Times Dilution With 0.1 N HCL |
100 Times Dilution With 0.1 N HCL |
50 Times Dilution With Ph 6.8 Buffer |
100 Times Dilution With Ph 6.8 Buffer |
| S1 |
12.34± 0.002 |
13.42± 0.005 |
11.87± 0.004 |
14.23± 0.007 |
12.56± 0.002 |
13.89 ± 0.007 |
| S2 |
11.24± 0.002 |
13.49± 0.002 |
10.99± 0.003 |
12.99± 0.006 |
12.46± 0.009 |
13.34 ± 0.003 |
| S3 |
17.33± 0.006 |
18.83± 0.004 |
16.83± 0.003 |
19.39± 0.009 |
17.63± 0.002 |
20.10 ± 0.005 |
| S4 |
39.78± 0.007 |
42.68± 0.003 |
38.78± 0.005 |
43.40± 0.002 |
38.28± 0.003 |
44.43 ± 0.006 |
| S5 |
45.06± 0.004 |
48.05± 0.007 |
43.45± 0.006 |
47.46± 0.004 |
42.78± 0.004 |
46.76 ± 0.003 |
| S6 |
69.15± 0.002 |
70.85± 0.004 |
67.85± 0.007 |
69.43± 0.003 |
71.85± 0.002 |
72.54 ± 0.005 |
| S7 |
62.73± 0.002 |
65.69± 0.003 |
59.64± 0.002 |
61.89± 0.004 |
60.00± 0.005 |
65.76 ± 0.006 |
Table 5: Show % transmittances result of different LBF upon dilution with Water, pH 1.2 buffer and pH 6.8 buffer
In Type I lipid based formulation containing only oil and Type IV type containing surfactant and cosurfactant. So, transmittance is not achieving 100 but in formulation containing 1:1 surfactant and cosurfactant then transmittance is increase than formulation containing only oil and surfactant.
Robustness to dilution
Diluted LBF did not show any precipitation or phase separation on storage in various dilutions medium. This revels that all media were robust to dilution.
Stability
Stability studies of the LBF samples were carried out by subjecting them to temperature stability and centrifugation. The temperature stability study was carried out by keeping the sample at two different temperatures (2-80C, Room temperature) for two months and visual inspection was carried out by drawing samples at monthly intervals for the subsequent months. As per the results shown in Table no 6 & 7 evidence of phase separation or any flocculation or precipitation was observed in some LBF. The few of formulation show no sign of phase separation when subjected to centrifugation at 1000 rpm for 15 minutes. Thus, it was concluded that the few of LBF was stable thermally as well as under stressful conditions.
| Batch |
Phase Separation, Flocculation, precipitation |
| After 1 month |
After 2 month |
| 28°C |
Room Temperature |
28°C |
Room Temperature |
| S1 |
NotSeen |
Not Seen |
Seen |
Seen |
| S2 |
NotSeen |
Not Seen |
NotSeen |
Not Seen |
| S3 |
NotSeen |
Not Seen |
NotSeen |
Not Seen |
| S4 |
NotSeen |
Not Seen |
NotSeen |
Not Seen |
| S5 |
NotSeen |
Not Seen |
NotSeen |
Not Seen |
| S6 |
NotSeen |
Not Seen |
NotSeen |
Not Seen |
| S7 |
NotSeen |
Not Seen |
NotSeen |
Not Seen |
Table 6: Temperature stability study of LBF samples for different time intervals.
| Batch |
Phase Separation |
| After 1 month |
After 2 month |
| S1 |
Not Seen |
Seen |
| S2 |
Not Seen |
Not Seen |
| S3 |
Not Seen |
Seen |
| S4 |
Not Seen |
Not Seen |
| S5 |
Not Seen |
Not Seen |
| S6 |
Not Seen |
Not Seen |
| S7 |
Not Seen |
Not Seen |
Table 7: Centrifugation stability study of LBF samples for different time intervals.
| Batch |
Similarity factor (f2) |
| S1 |
31.83 |
| S2 |
30.38 |
| S3 |
30.31 |
| S4 |
24.46 |
| S5 |
25.84 |
| S6 |
24.81 |
| S7 |
28.88 |
Table 8: Similarity factor (f2) for release profiles of Pure OLM and all LBF in buffer pH 6.8.
In-vitro release of OLM
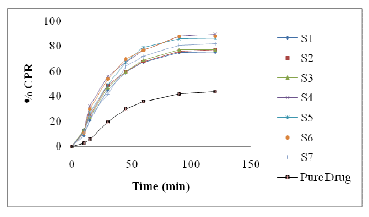
A dissolution study was performed for the LBF formulation in buffer pH 6.8 and the result was compared with pure drug. The release pattern was shown in figure 4. The release pattern shows that drug release from Type I and Type IV LBD formulations faster than pure drug. Moreover, S2 (Type I) release more than 76.89% drug release within 120 min while release rate is very slow in case of pure drug, i.e. 43.78 % within 120 min and S4 (Type IV) release more than 89.67% drug release within 120 min. It is confirmed that any of these factors affect the bioavailability of drug.

Figure 4:Show in vitro drug release from OLM LBF A value of 100% for the similarity factor (f2) suggests that the test and reference profiles are identical. Values between 50 and 100 indicate that the dissolution profiles are similar whilst smaller values imply an increase in dissimilarity between release profiles (Moore & Flanner, 1996). Calculated f2 values are presented in Table 8 from this Table, it is evident that the release profile of S2 and S4 is highly different from Pure OLM (f2 values 30.38 and 24.46).
Determination of drug content
Drug content of the of the optimized formulation was found to be 98.76± 0.56 % (mean ± SD, n=3).
Conclusion
In this study, LBF (Type I and Type Iv) of OLM were prepared and evaluated for their in vitro behavior. In Type I formulations are prepared by using lipid component (oil phase) only and Type IV formulations containing surfactant and combination of surfactant and co-surfactant. Formulation S2 and S4 exhibited faster release profile compared to other formulation and pure drug and also stable up to 2 month. No sign of phase separation and flocculation in different temperature and centrifugal effect. But in formulation S4 is Type IV formulation so may be sometime may be irritant and poorly tolerated in the gastrointestinal tract. Thus Type I formulation (S2) can be regarded as a novel and commercially feasible alternative to the current OLM formulations.
Conflict of Interest: NIL
Source of Support: NONE
5661
References
- Daryl N, Evans B III, Bridget S, Marlon H. Olmesartan Medoxomil for Hypertension: A Clinical Review. Drug forecast 2002;27(12):611-18
- Cappello B, Di Maio C, Iervolino M, Miro A. Improvement of solubility and stability of valsartan by hydroxy propyl- beta – cyclodextrin. J Incl Phenom Macrocycl Chem 2006;54: 289 –94 .
- Charman WN. Lipid, lipophilic drugs and oral drug delivery –some emerging concepts. J Pharm Sci 2000; 89(8): 967-78.
- Pouton CW, Porter CJH. Formulation of lipid- based delivery systems for oral administration: Materials, methods and strategies. Advance Drug Delivery Reviews 2008; 60:625-37.
- Bok Ki Kanga, Jin Soo Lee, Se Kang Chona, Sang Young Jeong, Soon Hong Yuk, Gilson Khanga, Hai Bang Lee, Sun Hang Choc. Development of self-microemulsifying drug delivery systems (SMEDDS) for oral bioavailability enhancement of simvastatin in beagle dogs. Int J of Pharma 2004; 274:65–73.
- Shen H and Zhong M. Preparation and evaluation of self-microemulsifying drug delivery systems (SMEDDS) containing Atorvastatin. Pharmacy and pharmacology 2006; 1183-1191.
- Date AA, Nagarsenker MS. Design and evaluation of self-nanoemulsifying drug delivery system (SNEDDS) for cepodoxime proxetil. Int. J Pharm 2007;329:166-72.
- Ghosh PK, Umrethia ML, Majethiya RJ, and Murthy RSR. Preparation and Physicochemical characterisation of caprylocapryl macrogol -8- glycerides microemulsion for oral drug delivery. Ars Pharm 2004; 45 (3): 353-372.
- Zhang P, Liu Y, Feng N and Xu J. Preparation and evaluation of selfmicroemulsifying drug delivery system of oridonin. Int J Pharm 2008; 355: 269-76.
- Moore JW and Flanner H. Mathematical comparison of dissolution profiles. Pharmaceutical Technology 1996; 20:64-74.
- Pouton CW. Lipid formulation for oral administration of drugs:Non-emulsifying, Self- emulsifying and self-microemulsifying drug delivery systems. Eur J Pharm Sci 2000;11:S93-8.
- Pouton CW, Formulation of poorly water soluble drugs for oral administration: Physiochemical and Physiological issues and the lipid formulation classification system. Eur J Pharm Sci 2006; 29: 278-87.
- Zhang P, Liu Y, Feng N and Xu J. Preparation and evaluation of selfmicroemulsifying drug delivery system of oridonin. Inl J of Pharm 2008; 355: 269-76.


