Keywords
Fish feed; Aquaculture; Microbial flora; Catfish; Clarias gariepinus; Nutrients
Introduction
In aquaculture practices, successful larval rearing at early stage of the cultured fish depends majorly on the availability of appropriate diets that are readily consumed, efficiently digested and that provide the required nutrients to support growth, health and good rearing conditions (Adewunmi, 2015). Fish hatchlings generally depend on live foods at first feeding for survival and development (Adewolu et al., 2009). Nutrients which are found in reasonable proportion in both natural and formulated fish feeds are proteins, lipids and carbohydrates. Also, some nutrients such as vitamins and minerals are required in some measurable quantity. When the fish obtain sufficient supplies of certain essential nutrients, body functions and growth process will be effective and commensurate (Ajah, 2007; Gabriel et al., 2007). The African catfish, Clarias gariepinus (Burchell, 1822), evolves through different developmental stages in its life time. The larval stage, which is the first developmental stage, depends on some environmental and management factors which include temperature and nutrition, and takes 14-42 days to complete (Arimoro and Ofojekwu, 2003). The fry stage, which is the second stage, is characterized by the some movement of the fish to the surface of the water. This movement also signifies that the fish can be stocked into ponds. The fingerling stage is reached when the fins are fully developed and most organs have been formed (Bengston, 2003; Akbary et al., 2010).
In fish hatchery management, food and feeding parts are obvious key factors for a major achievement in larval rearing. Diets of fish larvae may be selected according to different sets of conditions depending upon the perspective of the fish farmer and some physiological requirements set by the developing larva (Adikwu and Haruna, 1999; Gabriel et al., 2009). Recently, there is growing advocacy to reduce costs involved with feed preparation in the hatchery. Survival rate is given more importance than growth rate as fingerlings are sold based on numbers rather than weight (Adekunle and Joyce, 2013). Constant availability of the diet is also emphasized upon. Palatability and digestibility are most important criteria for the choice of feed. These factors are in turn affected by size of the diet in relation to the size of the fish (Craig et al., 1994). In general, the food size should be around 2-3% of the larval length (Ukwe et al., 2016).
Formulated dry feed have been used as a first feed in C. gariepinus larval rearing with the aim of avoiding the dependence on expensive and time consuming live feed (Ataguba et al., 2009). In developing countries of the world, starter feeds which include live feeds such as capsulated artemia and commercial starter feeds are imported, therefore expensive and in most cases, the prices are beyond the reach of the farmers. Many of the hatchery operators therefore resort to formulated feeds for feeding of fry in the hatchery. This study therefore focused on growth performance and microbial indices in C. gariepinus larvae fed with specially formulated feed in the hatchery.
Materials and Methods
Experimental location
The project work was carried out in the hatchery unit of the University of Port Harcourt, Choba Campus, Rivers State, Nigeria.
Experimental feeds
The commercial starter feed (Aqualis) used was produced by Aqualis and imported into Nigeria by Crown Flour Mills Nigeria Limited. It was obtained from Agro-Services Center at Rumudomaya, Port Harcourt, and Rivers State. The special feed was prepared by mixing Vital broilers starter feeds (poultry), Dana fish meal, vitamin C, and premix (containing vitamins) they were procured from Agro-services centre at Rumudomaya, in Port Harcourt, Rivers State. This Special feed contains 1.18 kg of fish meal, 0.78kg of broilers starter feeds, 0.02 kg of vitamin C and 0.02 kg of premix, given a total of 2 kg of starter fish feed.
Proximate nutrient composition of experimental diets
The four experimental feed samples were analyzed using the standard analysis method of the Association of Official Analytical Chemist (AOAC, 1990). They were analyzed as follows: The moisture content of the sample was determined by air oven method at 150°C, crude protein was obtained by using micro-kjeldahi method. Crude lipid was determined by soxhlet extraction method using petroleum ether as extracting solvent. The ash content was by muffle furnace at 550°C for four (4) hours until constant weight of ash was obtained. Crude fibre was determined by exhaustive extraction of soluble substance in sample using 1.25% H2S04 and 1.25% Na0H solution after the residue was ashed and loss in weight was recorded as crude fiber. Carbohydrate content was determined by difference 100 – (% moisture + % protein+ % fat + % crude fiber). All analysis was carried out in triplicates.
Stocking density
A total of two hundred (200) larvae of 4.8 ± 0.16 mg weight and 6.16 ± 0.30 mm lengths were transferred to each of the experimental tanks (40 × 25 × 25 cm3) that were properly labeled. The weight was obtained by the use of a Rohr sensitive electric weighing balance (Model no. 3002N, by Want Instrument Co Ltd, Shanghai, China). A wet filter paper was placed in the balance and adjusted to zero, twenty five larvae were collected randomly from the hatchery at the end of endogenous feeding(after 48 hours from hatching time) and placed at the zero weight filter paper, and the weight was taken, and its average determined. This was repeated five times, and the average of the results of the five sets was taken as the weight of the individual larvae in the hatchery. Five (5) set of five larvae each were measured using a transparent millimeter calibrated ruler and a magnifying hand lens. The average lengths of each of the sets were taken and the mean of the various sets was taken as length of each larva in the hatchery. Feeding commenced twelve (12) hours after stocking.
Physico-chemical parameters
Temperature, Dissolved Oxygen, pH, were monitored twice daily, but other parameters; Ammonia, Nitrate and Nitrite were measured twice a week due to the constant quality of the water source and water retention time in the tank (Noori et al., 2001). The temperature was taken by the use of mercury in glass thermometer calibrated in degree centigrade (0-100°C). The pH value of the water was determined by the use of a pH meter, pocket pen pH meter model 700, made in Japan. The dissolved oxygen (D.O) was determined using a 9-series multi-parameter water quality meter (Bante 980 Precision DO. Meter) Version Number: 2009070200. The ammonia, nitrite and nitrate test were conducted using La Motte Aquaculture test kit MODEL AQ-4, CODE 3635-04, chester town, Maryland, 21620. USA.
Feeding of fish larvae: The larvae were fed at 10% of their body weight of feeds per day. They were twice daily early in the morning and late in the evening.
Growth parameters: During the experiment the growth parameters were measured as follows.
Length: The length was measured by the use of a transmitted millimeter calibrated ruler and a magnifying hand lens. The initial larva length was 6.16 ± 0.30 mm and measurements were done at days.
Weight: The weight was determined by the use of an electric sensitive weighing balance (model: 3002N, No.110628014, made in Shangai, China by Wart Instrument Co. Ltd). The initial larva weight before stocking was 4.8 ± 0.16 mg.
Survival: The survival rate was determined using the formula

Specific growth rate (SGR): This was calculated as

Where: W1=Final body weight; Wo=Initial body weight; t=Time (days); Ln=Logarithms of numbers
Fulton’s condition factor (K): This was calculated as
 (Peanase and Mengumhan, 2015)
W=Weight (g); L=Length (cm)
Feed conversion ratio (FCR): This was calculated as

Feed intake (g): Total weight of food consumed by fish within the experimental period.
Protein efficiency ratio (PER): This was calculated using the formula

Percentage weight gain

Absolute growth rate

Daily weight gain

Average daily length gain

Relative weight gain (RWG)

Gross feed conversion efficiency (GFCE)

Microbiological analysis
The water samples were analyzed using the methods of American Public Health Association (APHA 1998). The total number of coliforms in a water sample was determined by the most probable number (MPN) test.
Statistical Analysis of Data
Statistical analysis was carried out on all data using the SPSS VERSION 22 for windows, 2000. Data was pooled by treatment and presented as mean ± standard deviation (SD) and standard error (SE), Data was analyzed for treatment effect by one way analysis of variance (ANOVA). The Turkey Post hoc test was used to 95% confidence level to produce specific information on which means are significantly different from each other.
Results
Proximate composition of experimental diets
The proximate composition of experimental diets used in feeding C. gariepinus larvae is shown in Table 1. Significant differences were recorded in all the parameters between Aqualis starter feed and special formulated feed. The values of moisture, fibre, ash and carbohydrates content were significantly higher in special feeds than that of Aqualis.
| Parameters |
Aqualis |
Special Feeds |
| Moisture Content (%) |
8.95 ± 0.25a |
11.76 ± 0.04b |
| Protein (%) |
53.74 ± 0.04 b |
42.72 ± 0.03a |
| Fibre (%) |
2.53 ± 0.03a |
7.22 ± 0.02b |
| Fat (%) |
7.94 ± 0.02a |
10.64 ± 0.02b |
| Ash Content (%) |
12.25 ± 0.03a |
12.11 ± 0.10a |
| Carbohydrate (%) |
14.65 ± 0.04a |
15.64 ± 0.03a |
| Energy (cal/100g) |
345.12 ± 0.08b |
329.25 ± 0.03a |
Table 1: Proximate composition of experimental feeds (Mean ± S D).
Physiochemical parameter of water in experimental tanks
The results of the physic-chemical parameters of water in experimental tanks in the C. gariepinus larvae fed with special feed and aqualis is shown in Table 2. There were no significant difference (P>0.05) in the values of temperature, pH and dissolved oxygen of the water in all the experimental tanks. While ammonia, nitrate and nitrite were 0.00 (zero) in all the experimental tanks.
| Parameters |
Aqualis |
Special Feeds |
| Temperature (°C) |
27.85 ± 1.15a |
27.96 ± 1.34a |
| pH |
6.11 ± 0.45a |
6.26 ± 0.19a |
| Dissolved Oxygen (mg/l) |
6.32 ± 0.16a |
6.09 ± 0.11a |
| NH3(mg/l) |
0.00 ± 0.00a |
0.00 ± 0.00a |
| Nitrate (mg/l) |
0.00 ± 0.00a |
0.00 ± 0.00a |
| Nitrite(mg/l) |
0.00 ± 0.00a |
0.00 ± 0.00a |
Table 2: Physico-chemical parameters of water in the experimental tanks during 21 days (Mean ± SE).
Growth response and nutrient utilization in C. gariepinus larvae fed experimental diets
The growth responses of larvae to the experimental diets are shown in Table 2. The final length, final weight, weight gained and length increase significantly (P>0.05) higher in larvae fed with special feeds than that of aqualis within the experimental period. However, percentage weight gained was higher in fish fed with aqualis than the special formulated diet. While other parameters were within the same range (Table 3). The nutrient utilization values is shown in Table 4, includes protein intake, protein efficiency ratio, feed conversion ratio and gross feed conversion efficiency were within the same range with no significant different (P>0.05).
| Parameters |
Aqualis |
Special Feed |
| Final Length (mm) |
11.85 ± 3.56a |
15.19 ± 7.30b |
| Final Weight (mg) |
20.44 ± 8.72a |
22.11 ± 11.30b |
| Weight Gained (mg) |
15.76 ± 8.83a |
16.29 ± 11.30b |
| Length Increase (mm) |
5.73 ± 3.53a |
8.96 ± 7.11b |
| Survival (%) |
58.78 ± 11.90b |
65.53 ± 11.33b |
| Specific Growth Rate (% d-1) |
9.92 ± 1.83a |
9.72 ± 1.85a |
| Condition Factor |
1.42 ± 0.37b |
0.94 ± 0.31a |
| Feed Intake (mg) |
13.23 ± 10.08a |
13.16 ± 10.50a |
| Percentage Weight Gained (%) |
71.11 ± 16.51b |
67.45 ± 20.00a |
| Absolute Growth Rate (mg) |
1.05 ± 0.30a |
1.03 ± 0.43a |
| Daily Weight Gained (mg) |
0.09 ± 0.04a |
0.09 ± 0.04a |
| Average Daily Length Gain (mm) |
0.71 ± 0.18a |
0.78 ± 0.16a |
| Relative Weight Gained (%) |
3.28 ± 1.84a |
3.95 ± 2.37a |
Means within the same row with different superscript are significantly different (P<0.05).
Table 3: Growth response in C.gariepinus fry fed Experimental diets within 21 days (Mean ± SE).
| Parameters |
Aqualis |
Special Feed |
| Protein Intake |
7.11 ± 3.59b |
5.61 ± 3.24 a |
| Protein Efficiency Ratio |
2.60 ± 1.00 a |
2.03 ± 1.45 a |
| Feed Conversion Ratio |
1.40 ± 0.54 a |
1.33 ± 0.45 a |
| Gross Feed Conversion Efficiency |
79.75 ± 25.87b |
80.27 ± 30.00a |
Table 4: Nutrient utilization in C. gariepinus fry fed experimental diets within 21 days (Mean ± E).
Comparatively, changes in weight and length gained in C. gariepinus fed with special feed and aqualis indicated that their values increased steadily in the experimental weeks, also, across the experimental period the values of weight gained and length increase in fish fed with special feed were consistently higher than the fish fed with Aqualis (Figures 1 and 2). Whereas, parameters such as survival, condition factor and food conversion ratio reduces in both feeds under consideration as the experimental period increases (Figures 3-5). While, the specific growth rate values were within the same range in all the experimental period (Figure 6).
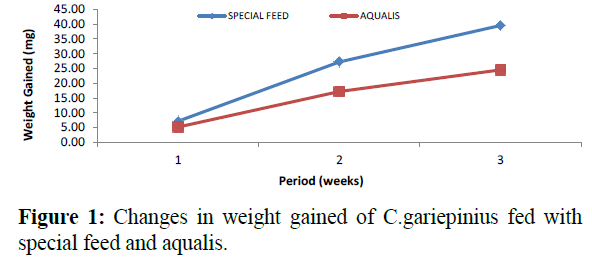
Figure 1: Changes in weight gained of C.gariepinius fed with special feed and aqualis.
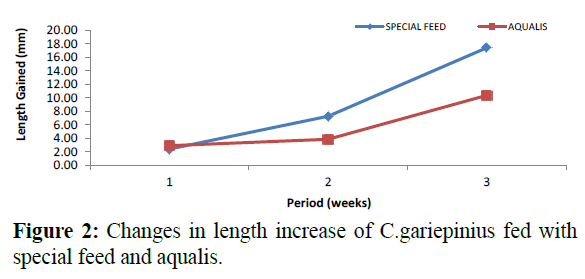
Figure 2: Changes in length increase of C.gariepinius fed with special feed and aqualis.
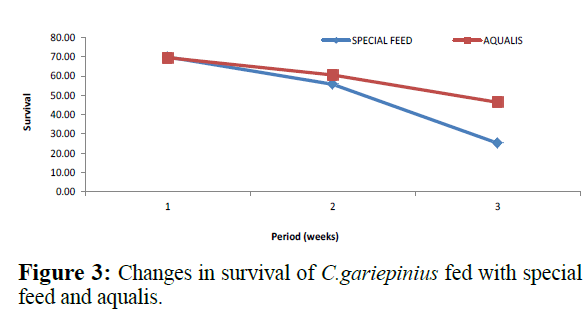
Figure 3: Changes in survival of C.gariepinius fed with special feed and aqualis.
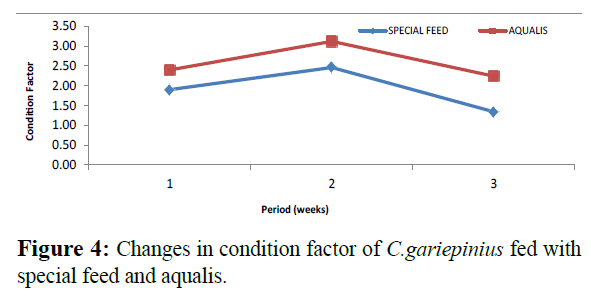
Figure 4: Changes in condition factor of C.gariepinius fed with special feed and aqualis.
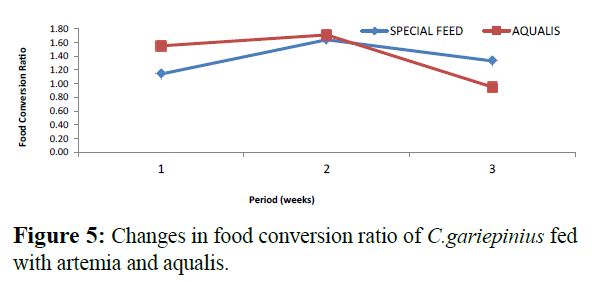
Figure 5: Changes in food conversion ratio of C.gariepinius fed with artemia and aqualis.
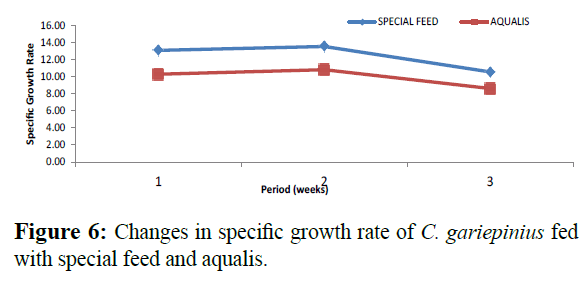
Figure 6: Changes in specific growth rate of C. gariepinius fed with special feed and aqualis.
Microbial analysis of water in experimental containers
The experimental waters in the larvae fed with Aqualis and Special feed during the periods of the experiment was analyzed for the four microbial floras (Table 5). Higher values of Total heterotrophic count and Vibro Count were recorded in experimental waters of fish fed with special feed when compared to Aqualis. While the other parameters such as Total Coliform Count and Salmonela/Shigella were less than thirty (<30) in both experimental waters.
| Parameters |
Aqualis |
Special Feeds |
| THC |
5.2 x 10³ |
7.1 ± 1.34a |
| VIBC |
<30 |
5.2 × 10² |
| TCC |
<30 |
<30 |
| SMS |
<30 |
<30 |
Note: THC- Total Heterophic Count ; VIBC - Vibro Count ; TCC -Total Coliform Count; SMS- Salmonela/ Shigella.
Table 5: Microbial Analysis of Water in Experimental Tanks of C. gariepinus fed with Special Feeds and Aqualis (Mean±SE).
Discussion
Water quality in relation with growth of larvae
In the present study, fish feeding does not leads to alterations in water quality parameters like dissolved oxygen, pH and ammonia. These parameters were not affected by different feed type application during the three weeks feeding trial. However, dissolved oxygen levels vary slightly with different feed type. However, the parameters were within the appropriate ranges for the catfish culture. Other studies also found and recommend that every growth rate is related to the water quality of the rearing containers (Adeniji and Ovie, 1990; Owhonda et al., 2007; Abu et al., 2010). This study result shows the larvae during first feeding days have good condition, and applying different type of feeds doesn't influence water quality.
Temperature and pH plays a vital role in determining the effectiveness of digestive enzymes in the fish larvae as a whole (Makinde et al., 2015). A study by Keremah et al. (2010), shows temperature influences fish growth, specifically on the sensitive early stage. According to present study, the physico-chemical parameter range, pH (6.12-6.92) and temperature of (27.80- 28.0°C) were considered suitable according to Keremah et al. (2010). A fair amount of studies do not concern conductivity and salinity, usually if the water source is from bore hole which have more consistent water quality compared to surface water, and is less likely to be contaminated by pathogens and other pollutants (Boyd, 2005).
Growth performance of Clarias gariepinus larvae
Ajah (2010) observed that, at the onset of exogenous feeding, larvae of the African catfish are able to eat, digest, absorb, and metabolize nutrients with their sizeable mouth and digestive system. In this study Clarias gariepinus larvae readily consumed both feeds after yolk absorption. During the experimental period the larvae reached an overall average growth of 11.85 and 15.99 mm in Total Length in Aqualis and special feed treatment respectively. Also, at the end of 21 days trial, average total weight of 20.44 mg was recorded for the larvae fed with Aqualis, while an average weight of 22.11 mg was in the larvae fed with special formulated diet. This result is within the standard average recommended by Gross et al. (2006) for catfish larvae fed with artificial diets in limited period of time.
Our findings in this study are based on the fact that locally formulated diets resulted in higher growth when used as starter feed. Diets that are readily consumed and efficiently digested to provide the required nutrition’s for fish growth and development must be rich in protein. As protein quality and quantity determine the growths of fish larvae (Giri et al., 2002). If there is a big difference of crude protein content between feeds, the larvae also shows different growth performances as the study examples indicate (Ovie, 2010; Olurin et al., 2012). In This study higher growth of C. gariepinus larvae was observed in fish fed with special formulated feed, when compared to Aqualis starter diets. Whereas, the crude protein content in special was lower than that of Aqualis. This observation may be due to palatability of the feeds. Low palatability and digestibility are considered possible causes for poor growth performance (Amadi and Solomon, 2001).
Microbial analysis of experimental waters
The microbial analysis of the water in the various experimental tanks confirmed the presence of the following microbial flora, in different quantities:-Total Heterotrophic bacteria, Vibrio, Total Coliform and Salmonela/Shigella. Microflora especially total heterotrophic bacteria counts were found in borehole waters within Port Harcourt metropolis, but in different quantities (Obianeme and Obire, 2017). There is a link between the microflora present in fish and its water, Lesel (1979) and Austin (2006), but not all microfloras present in fish is in the fish water. Esteve and Garay (1991) also reported that the quantity of bacteria found in the tank water varies with the quantity found in the fish. Fish injects bacteria from the environment through the mouth, Olafsen (2001). In this experiment, some of microfloras were found in the various tanks though in different quantities. This is in agreement with report of Okpokwasili and Ogbulie (1999), and Daboor (2008).
The total heterotrophic count was high in all the tanks in this experiment, this could be as result of its presence in the borehole water before the administration of the fish feeds, and the organic matter deposited as a result of uneaten feed and metabolic activities enhanced the presence of the heterotrophic bacteria, Obianeme and Obire, (2017). At a conducive environment for bacterial growth, heterotrophic bacteria can grow to the level that may be detrimental to fish and fish consumers (Eze and Ogbaran, 2010). The Vibro count in all the experimental tanks except Special feed were less than (<30). The presence of the Vibro could be as a result of fish excreta (Kay et al., 2008), and the presence of the organic matter from the feed could have encouraged their presence. The presence of Vibro noticeable in the tank fed Special feed could be due to the fact that organic matter in the Special feed deposited favored the proliferation of Vibro, and the temperature of the water may have contributed to this (Bhatnagah and Devi, 2013).
The total Coliform count and the Salmonela/Shigella count were less than thirty (<30) in all the experimental tanks. According to Kay et al., (2008) and Obianeme and Obire (2017) this could be as a result of the presence of the fish excreta. The presence of this microflora as seen in this report could lead to the transmission of diseases (Piet, 2009). There was a noticeable reduction in quantity of microflora from the first to the third week, this could be as a result of the reduction in the quantity of leftover of uneaten feeds as the fish gets older, this led to reduction in organic matter presence that favoured their proliferation. This result is in agreement with Zmyslowska et al. (2001), who reported that, the presence of bacteria decreased as the fish gets older.
Conclusion
There was no significant difference in the physico-chemical parameters of the water in all the experimental tanks, as they were all within the range of fish survival. The results obtained from this experiment indicated that the two feeds showed commendable response to growth parameters. The larvae of C. gariepinus fed Special feed (a combination of broiler starter feed, fish meal, vitamin C and premix) did better than Aqualis in terms of length increase, weight gained and survival rate of the fish. The observed microbial flora: Total heterotrophic count, Vibro, Coliform count and Salmonela/Shigella count were all present in the various experimental waters in different quantities. Vibro count was only present in considerable quantity in Special feed tanks. There is need for constant monitoring of the physico-chemical parameters and microbial flora presence of the fish water, as different feeds alter the physico-chemical parameters and microbial flora presence of the water.
22467
References
- Abu, O.M.G., Gabriel, U.U., Akinrotimi, O.A. (2010) Performance and survival of hybrid catfish (Hetero X Clarias) fed with whole cassava root meal as a replacement for maize. Agro-Science J Tropical Agriculture Food Environ Ext9, 176-183.
- Adeniji, H.A., Ovie, S.I. (1990) A simple guide to water quality management in fish ponds. Technical Report Series, No.23 National Institute for fresh Water Fisheries Research (NIFFRI), New Bussa pp: 10.
- Adewolu, M.A., Akintola, S.L., Akinwunmi, O.O. (2009) Growth performance and survival of hybrid African catfish larvae (Clarias gariepinus x Heterobranchusbidorsalis) fed different diets. Zoologists 7, 45-51.
- Adewumi, A.A. (2015) Growth performance and survival of Clarias gariepinus hatchlings fed different starter diets. European J Experimental Biol5, 1-5.
- Adekunle, A.I., Joyce, A.B. (2013) Effect of partial and total replacement of live feed with formulated diets in early stage growth of hybrid catfish fry. J Agricultural Sci 3, 492-496.
- Adikwu, I.A., Harunna, B.A. (1999) Growth, daily ratio and gastric evacuation time in the African Catfish, Clarias gariepinus fed diets with different protein sources. Bio Sci Res Communications 10, 17-22.
- Ajah, P.O. (2007) Fish feeding and hatchery management. Calabar, Nigeria: Jerry Commercial Production pp: 178.
- Ajah, P.O. (2010) Prey Selection and predation behavior of Heterobranchuslongifilis larva during first exogenous feeding. African J Food Sci 4, 73-79.
- Akbary, P., Hosseini, S.A., Imanpoor, M., Sndagar, M., Makhdomi, N.M. (2010) Comparison between live food and Artificial diet on survival rate, growth and body chemistry composition of Oncorhynchus Mykiss Larvae. Iranian J Fisheries Sci 9, 19-32.
- Amadi, E. I., Solomon, S.G. (2001) Growth and survival of first feeding larvae of Clarias gariepinus fed live and preserved zooplankton. J Aquatic Sci 5, 29-31.
- Association of Official Analytical Chmists (AOAC) (1990) Official methods of analysis, 15th edn. Holdrick K (editor); Virginia, USA. pp: 125-291.
- Arimoro, F.O., Ofojekwu, P.C. (2003) Incidence of feeding, growth and survival of the toothed carp, Aphyosemion gardneri larvae on the fresh water rotifer, B. Calyciflorus. Tropical freshwater Biol 12, 35-43.
- Arimoro, F. (2007) First feeding in African Catfish (Clarias anguillaris)fry in tanks with fresh water Rotifer, Branchinus calyciflorus Cultured in a continuous feedback mechanism in comparison with mixed zooplankton Diet. J Fisheries Aquatic Sci 2, 275-284.
- Ataguba, G.A., Annune, P.A., Ogbe, F.G. (2009) Induce breeding and early growth of progeny from crosses between African Clariid fishes, Clarias gariepinus (Burchell 1822) and Heterobranchus longifilis under hatchery conditions. J Applied Biosci 14, 755-760
- Austia, B. (2006) The bacterial microflora of fish, revised. The Scientific World J 6, 931-945.
- APHA (1998) Standard methods for the extermination of water and waste water, 20th edn. Washinton DC pp: 1193.
- Bhatnagah, A., Devi, P. (2013) Water quantity guidelines for the management of pond fish culture. International J Environmental Sci3, 1980-2009.
- Boyd, C.E. (2005) Water Quality Trading and Assessment Methods. Kluwer Academic Publishers: Norwell, Massachusetts.
- EIFAC (1980) Revise report in fish toxicity testing Procedure. Food and Agriculture Organization Technical paper, 24, 122-160.
- Esteve, C., Garay, E. (1991) Heterotrophic bacteria flora associated with European eel Anguila anguila reared in fresh water. Nippon Suisan Gakkaishi, 57, 13-69.
- Eze, V.C., Ogbaran, I.O. (2010) Microbiological and physico-chemical characteristics of fish pond water in Ughelli, Delta State, Nigeria. International J Current Research8, 082-087.
- Gabriel, U.U., Akinrotimi, O.A., Bekibele, D.O., Anyanwu, P.E. (2007) Locally produced fish feed: Potentials for aquaculture development in sub Saharan Africa. African J Agricultural Res 2, 287-295.
- Gabriel, U.U., Akinrotimi, O.A., Orokotan, O.O. (2009) Water recirculation system. A revolutionary tool for sustainable aquaculture development in Nigeria. International J Agriculture and Rural Development 12, 121-135.
- Girri, S.S., Sahoo, S.K. Shu, B.B., Sahu, K.K., Mohanty, S.N., et al. (2002) Larval survival and growth in Wallago attu (Bloch and Schneider): Effect of light photoperiod and feeding regimes. Aquaculture 213, 157-161.
- Gross, A., Boyd, C.E., Wood, C.W. (2006) Nitrogen transformations and balance in channel catfish ponds. Aquacultural Engineering 24, 1-14.
- Kay, D., Growther, J., Stapleton, C.M., Wyer, M.D., Ewtrell, L.F., et al. (2008) Fecal indicator organism concentrations in sewage and treated effluents. Water Resources42, 442-445.
- Keremah, R.T., Gabriel, U.U., Akinrotimi, O.A., Sese, M.G. (2010) Comparative efficacy and economic of selected hormones in spawning of Heterobrachus bidorsalis and Clarias gariepinus. J Applied Research 2, 83-93.
- Lesel, R. (1979) Donness preliminaries surla microflore du tube gigestif de la truite arcen-ciel Salmo-gairdneri Richardson Revue de Biologie et Ecologie mediterianeene 6, 167.
- Makinde, O.O., Edun, O.M., Akinrotimi, O.A. (2015) Comparative Assessment of Physical and Chemical Characteristics of water in Ekerekana and Buguma Creeks, Niger Delta, Nigeria. J Environmental Protection and Sustainable Development 2, 66-73.
- Mbagwu, I.G., Adeniji, H.A. (1988) The nutritional content of duck weed (Lemna paucicostata hegelm) in the Kainj lake area, Nigeria. Aqua Botany 29, 357-366.
- Noori, F., Azari, T., Van Speybroeck, M., Van Stappen, G., Shiri-Harzevilli, A., et al. (2011) Feeding Acipenser persicus and Huso huso larvae with Artemia Urmiana nauplii enriched with highly unsaturated fatty acids and vitamin C effect on growth, survival and fatty acid profile. J Applied Ichthyol, 27, 781-786.
- Obioneme, N.E., Obire, O. (2017) Microbiological and Physico-Chemical characteristics of fish ponds in Port Harcourt. Current Studies in Comparative Education, Science and Technology4, 126-139.
- Okpokwasili, G.C., Ogbulie, J.N. (1999) Bacterial and metal quality of tilapia (Oreochromis niloticus) in aquaculture system. Inter. J. Environ Health Res 3, 190-202.
- Olafsen, J.A. (2001) Interaction between fish larvae and bacteria in marine aquaculture. Aquaculture 20, 223-247.
- Olurin, K.B., Iwuchukwu, P.O., Oladapo, O. (2012) Larval rearing of African catfish, Clarias gariepinus fed decapsulated Artemia, wild copepods or commercial starter diet. African J Food Science Technol 3, 182-185.
- Orisamuko, E.A. (2006) Influence of diets on the growth of the African River Prawn, Macrobranchuim, vollenhoveni: Nigeria J fisheries 2, 110-126.
- Ovie, S. (2010) The effect of replacing fish meal with 10% of Groundnut cake in the diets of H. longifilis on it’s growth, Food conversion and survival. J Applied Science and Environmental management11, 87–90.
- Owhonda, K.N., Akinrotimi, O.A., Ansa, E.J., Edun, O.M., Anyanwu, P.E., et al. (2007) Wet season variations in some physiochemical parameters of brackish water fish ponds and main channels in Buguma, Rivers State, Nigeria. J Fishery International 2, 255-259.
- Peanase, P., Mengumphan, K. (2015) Growth performance length–Weight Relationship and condition factor of Backcross and Reciprocal Hybrid catfish Reared in Ned cages. International J Zoological Res11, 57-64.
- Piet, K. (2009) Waste Disposal Technology, Mpumalangh South Africa pp: 24-27.
- Tacon, A.G.J. (1990) The nutrition and feeding of farmed fish and Shrimp. A training Manual 2. Nutrient sources and composition. FAO/UNDP. Brazil pp:12
- Ukwe, I.O.K., Abu, O.M.G. (2016) Evaluation of Efficacy and cost effectiveness of ovuline and Ovaprime Hormines for spawning of African Catfish, Clarias gariepinus. J Fisheries SciCom 10, 53-62.
- Zmyslowska, I., Lewandowska, D., Nowakowski, J., Kozlowski, J. (2001) Occurrence of Bacteria in Water and Vendace (Coregonus Albula) during Rearing in Tanks. Polish Journal of Environmental Studies10, 51-56.




 (Peanase and Mengumhan, 2015)


