Key words
Rainbow trout, Oncorhynchus mykiss, Full-fat soya, Fatty acids
Introduction
Aquaculture has developed into a highly productive and efficient industry for production of animal protein for human consumption in the world (Cabellero et al. 2002). As aquaculture production continues to enlarge, the need for high-quality and cost-effective protein sources increases (Mundheim et al. 2004). Fish meal and fish oil are main raw materials in the production of fish feeds (Cabellero et al. 2002; Bell et al. 2010). They are also expensive feed ingredients compared to some alternative plant sources (Mundheim et al. 2004). Therefore, many plant protein sources have been used to partially or almost totally replace dietary fish meal in order to reduce cost of feed ingredients (Kaushik et al. 1995; Refstie et al. 2000). However, it is important that the commercial producers realize the influence that dietary fatty acids (FA) have on the composition of storage lipids, particularly because of fish and fish products as a source of bioactive HUFA in human nutrition. Thus, the focus is no longer just on promoting good growth in fish but also on the production of fish with good nutritional qualities (Mourente and Bell 2006).
Soya products have become a widely used protein rich feed ingredient in diets for salmonids and other fish species, which is due to its moderate price, high availability in the market and the relatively well-balanced amino acid profile (Kaushik et al. 1995; Davies and Morris 1997; Ustao?lu and Rennert 2002; Romarheim et al. 2006; 2008; Bilgüven and Bar?? 2011). Different soya products are suitable and result in good growth in salmonids and other fish species (Ustao?lu and Rennert 2002). FFS is also an important alternative feed ingredient amongst soya products. It is included in dietary formulations largely as a protein source; it also contributes to the dietary fat (Morris et al. 2005; Karalazos et al. 2007).
There has been a fast increase in recent years in the aquaculture production in Turkey. The percentage of aquaculture production in total fish production has been rising every year. For example, the ratio of cultured fish production to total fish production was 1.5% in 1990s, 13.57% in 2000 and more than 20% in 2005. Furthermore, aquaculture production constituted 23.55% of the total fishery production in 2008, and exceeded 152.186 tons, showing an 8.1% increase compared to production in 2007. In addition to wild catch, the rainbow trout is the main freshwater species cultured in Turkey. Trout production increased from 43.43 tons in 2004 to about 65.92 tons in 2008 (Anonymous 2008; Harl?o?lu 2011a).
Traditionally, fish meal and fish oil have been the main source of dietary protein for fish in Turkey. In 2003-2004, fish meal and oil were produced by 9 factories, and total fish meal production was 18,000 tons (Y?ld?r?m, 2006; Harl?o?lu 2011b). In 2006, approximately 60,000 tons of fish meal was used in fish food production (Köprücü, 2007). It means that rest of the demand was imported. Therefore, it seems that alternative feed ingredients such as full-fat soya are required to provide the essential nutrients for the growth and quality of aquaculture production in Turkey.
The aim of present study was to determine the impact of changes in rainbow trout muscle and liver fatty acid composition when full-fat soya represented 40% and 55% of the formulation in diets.
Materials and Methods
Experimental diets, fish and management
Three isoenergetic and isonitrogenous diets were formulated, containing approximately 480 g kg-1 protein and 140 g kg-1 fat. The control diet was prepared as formulated by Cho et al. (1985). The control diet did not contain full-fat soya (FFS) (FFSO), but the experimental diets were formulated to contain 400 and 550 g FFS (FFS40 and FFS55, respectively) per kilogram of diet. Fish meal (FM) was obtained from ?zmir Feed Producer Company, ?zmir Turkey. Solvent (hex-ane) extracted soybean meal, FFS, Corn gluten, Wheat Bran were obtained from Özu?ur Feed Producer Company, Elaz?? Turkey. Proximate composition of the dietary ingredients is given in Table 1. Cristalline amino acid was added to the diets to provide the IAA requirement profile ac-cording to the NRC (1993). Fish oil (FO) was purchased from Sinop-Sürsan Company, Sinop Turkey. Vitamin and mineral premixes were ob-tained from Roche Products. Diet formulation and proximate composition of experimental diets are given in Table 2, and the FA compositions are given in Table 3.

Table 1: Proximate composition (% dry matter) of dietary ingredients
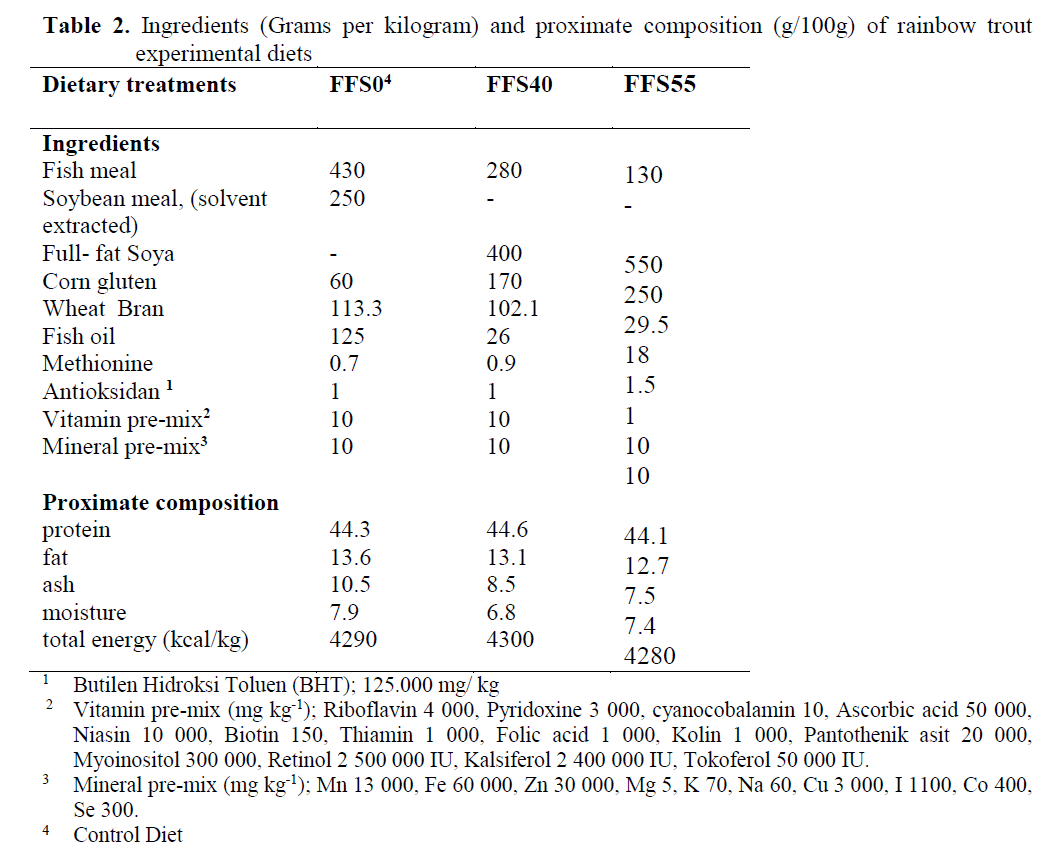
Table 2. Ingredients (Grams per kilogram) and proximate composition (g/100g) of rainbow trout experimental diets
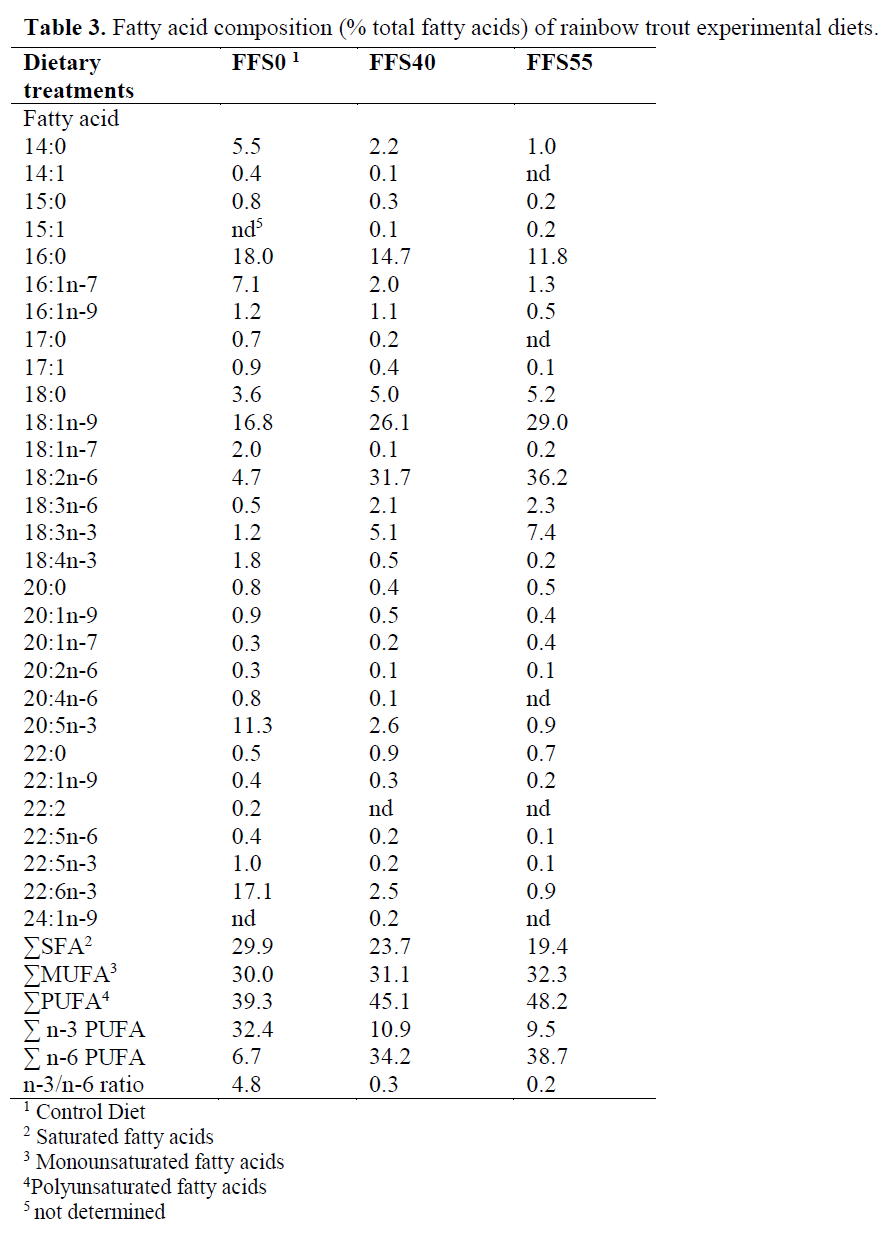
Table 3. Fatty acid composition (% total fatty acids) of rainbow trout experimental diets.
The experiment was carried out in Govern-ment Water Management Affairs of IX. Area Di-rectory, Keban, Elaz?? from June to August for 10 weeks under natural photoperiod. Each diet having three replicates, nine tanks (200 x 40 x 40 cm) were stocked with 25 rainbow trout of initial average weight of ~40 g each. Fish were weighed initially and at the end of every month. The tanks were supplied with freshwater at constant tem-perature 9-9.5 ºC. Dissolved oxygen content of water changed between 7.1-7.9 mg L–1, pH con-tent of water changed between 7.8-7.9.
At the end of the experiment, the fish were weighted after 24 h period of starvation. Seven fish were randomly taken from each tank for liver and muscle FA composition analysis. The sam-ples were frozen and stored at -20 ºC until analy-sis.
Proximate analysis of the diets
Diets samples were analyzed in triplicate for crude protein (CP), crude fat (CF), ash and moisture according to the methods described by the Association of Official Analytical Chemist (AOAC, 1995). Moisture content was measured by drying samples at 105°C for 24 h to constant weight in an oven. CP (Nitrogen x 6.25) was de-termined by Kjeldahl method autoanalyzer (Ger-hardt VAP 40), CF was estimated using a soxhlet apparatus (Gerhardt) with petroleum ether and ash by heating at 550° for 5-6 h in a Shimadzu type ashing furnace.
Fatty Acid Analyses
Lipid extraction of muscle and liver samples were extracted with hexane-isopropanol (3:2 v/v) by the method of Hara and Radin (1978). Each sample was homogenized with 10 ml hexane-iso-propanol mixture. The homogenate was centri-fuged at 5000 rpm for 5 min at 4°C and parts of tissue remnants were precipitated. The superna-tant part was used fatty acid analysis.
Fatty acids in the lipid extracts were con-verted into methyl esters including 2% sulfuric acid (v/v) in methanol (Christie, 1992). The mixture was vortexed and then kept at 50°C for 12 h. Then, after being cooled to room tempera-ture, 5 ml of 5% sodium chloride was added and then it was vortexed. Fatty acid methyl esters were extracted with 2x5 ml hexane. Fatty acid methyl esters were treated with 5ml 2% KHCO3 solution and then the hexane phase was evapo-rated by the nitrogen flow and then by dissolving in 0.5 ml fresh hexane (Christie, 1992), they were taken to auto sampler vials.
Methyl esters were analyzed with the Shi-madzu GC-17 Ver. 3 gas chromatography (Kyoto, Japan). For this analysis, 25 m of long Machery-Nagel (Germany) capillary colon with an inner diameter of 0.25 μm and a thickness of 25 micron film was used. During the analysis, the colon temperature was kept at 120-220 °C, injec-tion temperature was kept at 240°C and the de-tector temperature was kept at 280 °C. The nitro-gen carrier gas flow was 1 ml/min. The methyl esters of fatty acids were identified by compari-son with authentic external standard mixtures an-alyzed under the same conditions. After this pro-cess, the necessary programming was made and the Class GC 10 software version 2.01 was used to process the data.
Statistical analyses
Data are presented as means ±standard devia-tion (SD) (n=3). Significant differences between dietary treatments were determined by one-way analysis of variance (ANOVA) using Duncan’s test. The level of significance was chosen at p<0.05. ANOVA and regression analyses were performed using SPSS 12 (SPSS Inc. Chicago, Illinois).
Results and Discussion
In the present study final body weight de-creased in relation to the increases level of FFS in diets. Mean final weight (g, mean±SD) ranged from 69.8 ±2.1, 64.6 ±2.6 and 60.1 ±2.4 for FFS0, FFS40 and FFS55, respectively.
Diets
The increased inclusion of FFS at the rate of fish meal and fish oil had a direct effect in the FA compositions of the diets (Table 3). In particular, 14:0, 15:0 and 16:0 decreased, whereas 18:0 in-creased, resulting in a decrease for the total satu-rated fatty acids (from 29.9% in FFS0, to 19.4% in FFS55). Total monoenes remained stable, but 16:1 n-7, 16:1n-9, 17:1, 20:1n-9 decreased. On the other hand, there was a major increase in the 18:1n-9 from 16.8% to 29%, for FFS0 and FFS55, respectively. Moreover, the high content of 18:2n-6 in FFS resulted in an increase of that FA by almost 7-fold and 18:3n-6 by almost 4-fold, and a subsequent increase in total n-6 poly-unsaturated fatty acid (PUFA). 18:3n-3 was in-creased by 6-fold between FFS0 and FFS55.
In the present study, it was found that 20:5n-3 and 22:6n-3 reduced and total n-3 also reduced from 32.4 to 9.5%, for FFS0 and FFS55, respec-tively. In addition, the n-3/n-6 ratio decreased from 4.8 in FFS0 to 0.2 in FFS55.
Fatty acid composition of muscle and liver
The fatty acid composition of the rainbow trout muscle was given in Table 4. The inclusion of FFS resulted in a reduction in 14:0, 16:0, 16:1n-7, 20:1n-9, 20:5n-3, 22:1n-9, 22:6n-3, but it caused an increase in 18:1n-9, 18:2n-6 and 18:3n-3 in the fatty acid contents of muscle.
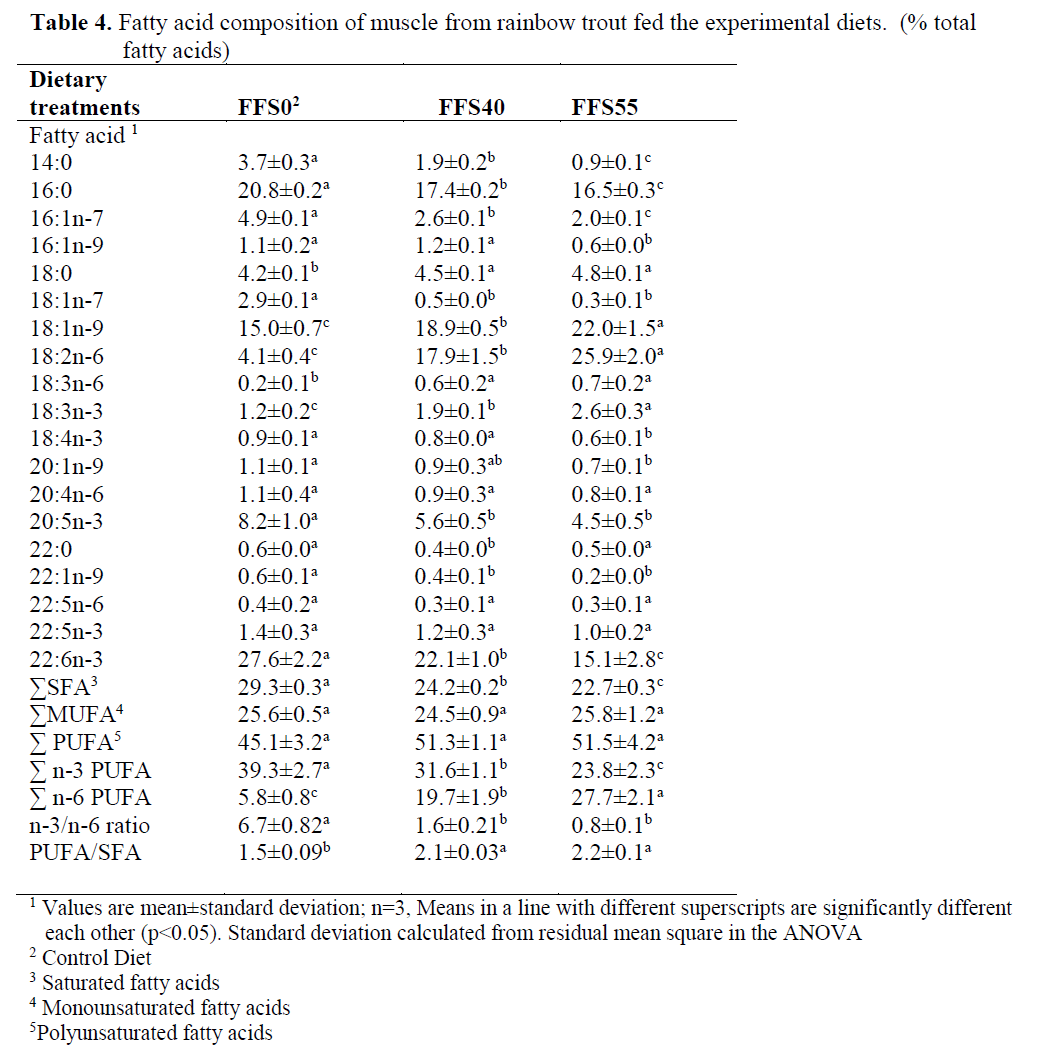
Table 4. Fatty acid composition of muscle from rainbow trout fed the experimental diets. (% total fatty acids)
In muscle, in addition to the increase in lino-leic acid (18:2n-6), with graded inclusion of FFS, the concentration of total n-6 PUFA also in-creased (from 5.8% to 27.7%, for FFS0-FFS55, respectively). However, there were significant reductions in 16:1n-7 (from 4.9% to 2.0%, for FFS0 and FFS55, respectively) (P<0.05), but 18:1n-9 increased significantly from 15.0% to 22.0% between the control group and FFS55 (P<0.05). The DHA concentration was also de-creased from 27.6% in FFS0 (control group) to 15.1% in FFS55. The EPA concentration was also decreased from 8.2% in FFS0 to 4.5% in FFS55 although there were no significant differ-ences between the two groups fed the FFS (P>0.05).
The results also showed that the replacement of FFS resulted in a significant reduction in the n-3/n-6 ratio, from 6.7 to 0.8 for the FFS0 and FFS55 groups, respectively, but there were no significant differences in the n-3/n-6 ratio be-tween the two groups fed FFS40 and FFS55 (P>0.05). Saturated fatty acid (SFA) and n-3 PUFA were significantly higher in the rainbow trout fed FFS0 while n-6 PUFA was higher in the trout fed diet FFS40 and FFS55. However, there were no significant differences in 20:4n-6, 22:5n-6 and 22:5n-3 between dietary groups (P>0.05) (Table 4).
In liver (Table 5), the dietary inclusion of FFS resulted in a reduction in 14:0, 16:0, 16:1n-7, 17:0, 18:1n-7, 20:1n-9, 20:4n-6, 20:5n-3, 22:1n-9, 22:5n-3, 22:6n-3 and 24:1n-9 and it caused also increase in 18:0, 18:1n-9, 18:2n-6 and 18:3n-6, 20:3n-6 in the fatty acid contents of liver.
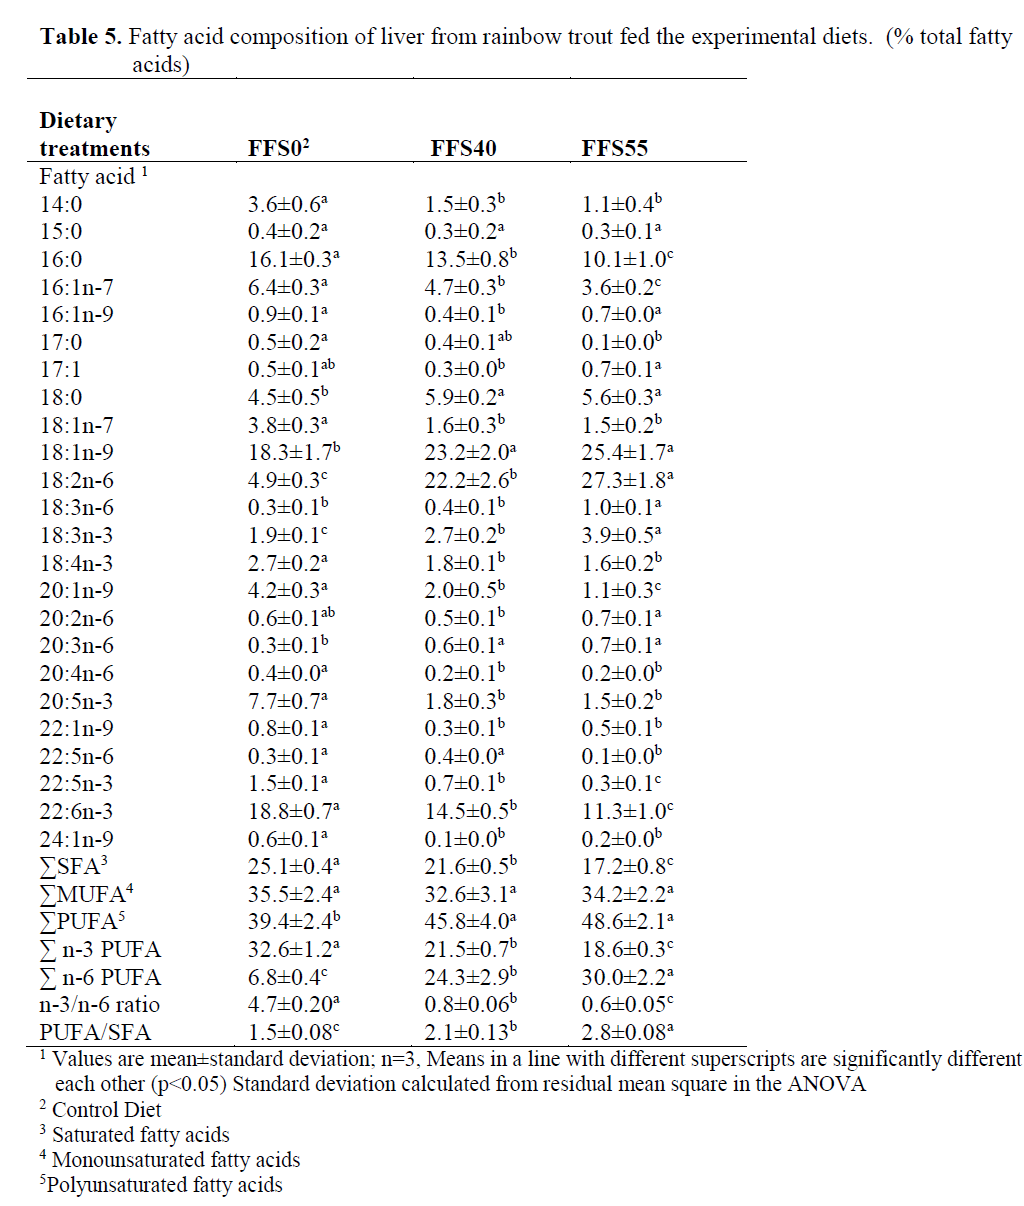
Table 5. Fatty acid composition of liver from rainbow trout fed the experimental diets. (% total fatty acids)
In liver, the dietary inclusion of FFS and the consequent major increase in the concentration of 18:2n-6 resulted in a significant increase in the total n-6 PUFA (from 6.8% FFS0 to 24.3% for FFS40 and 30% for FFS55, respectively) (P>0.05). In addition, 18:1n-9, 18:3n-6 and 18:3n-3 were also significantly increased from 18.3%, 0.3% and 1.9% to 25.4%, 1.0% and 3.9%, respectively. In contrast, significant reductions were observed between FFS0 and FFS55 in 14:0 (3.6-1.1%), 16:0 (16.1-10.1%), 17:0 (0.5-0.1%), 16:1n-7 (6.4-3.6%), 18:1n-7 (3.8-1.5%), 20:1n-9 (4.2-1.1%), 20:5n-3 (7.7-1.5%), 22:5n-3 (1.5-0.3%), 22:6n-3 (18.8-11.3%), total SFA (25.1-17.2%), total n-3 PUFA (32.6-18.6%) and the n-3/n-6 ratio (4.7-0.6%) (Table 5).
The concentrations of 18:2n-6, 18:1n-9, 18:3n-3, 20:5n-3, 22:6n-3 and n-3/n-6 ratio in muscle and liver were plotted against the respec-tive dietary FA concentrations. The plots of mus-cle FA against dietary FA concentrations are shown in Figure 1. The results showed that there was a significant linear correlation between dietary and muscle 18:2n-6, 18:1n-9, 18:3n-3, 20:5n-3, 22:6n-3 and n-3/n-6 ratio. Correlation coefficients (r), P values from these plots, slopes of the lines for individual fatty acids are given in Table 6 which establishes that different fatty ac-ids have different slopes.
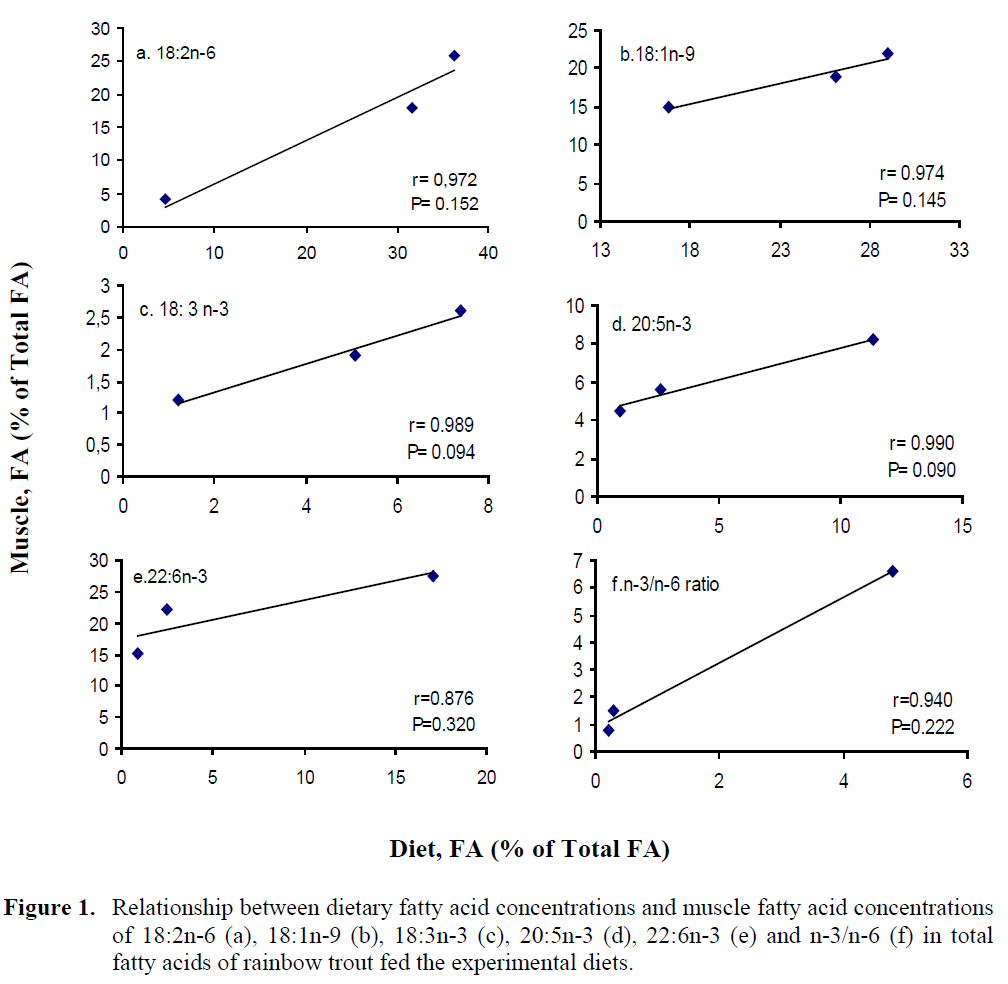
Figure 1: Relationship between dietary fatty acid concentrations and muscle fatty acid concentrations of 18:2n-6 (a), 18:1n-9 (b), 18:3n-3 (c), 20:5n-3 (d), 22:6n-3 (e) and n-3/n-6 (f) in total fatty acids of rainbow trout fed the experimental diets.
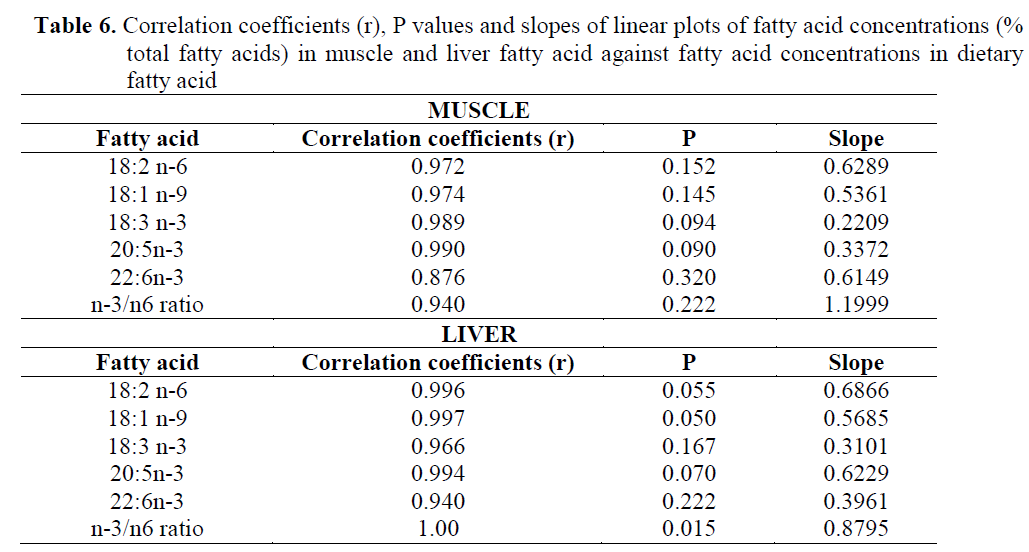
Table 6. Correlation coefficients (r), P values and slopes of linear plots of fatty acid concentrations (% total fatty acids) in muscle and liver fatty acid against fatty acid concentrations in dietary fatty acid
In addition, the plots of liver FA concentra-tions against the dietary FA concentrations are shown in Figure 2, and the correlation coefficients (r), P values from these plots, slopes of the lines for individual fatty acids are shown in Table 6. The regression analysis and the plots of the concentrations of 18:2n-6, 18:1n-9, 18:3n-3, 20:5n-3, 22:6n-3 and n-3/n-6 ratio in the diet against their concentrations in the liver showed significant linear correlation for all those correla-tion coefficients, ranging from 0.94 to 1.00).
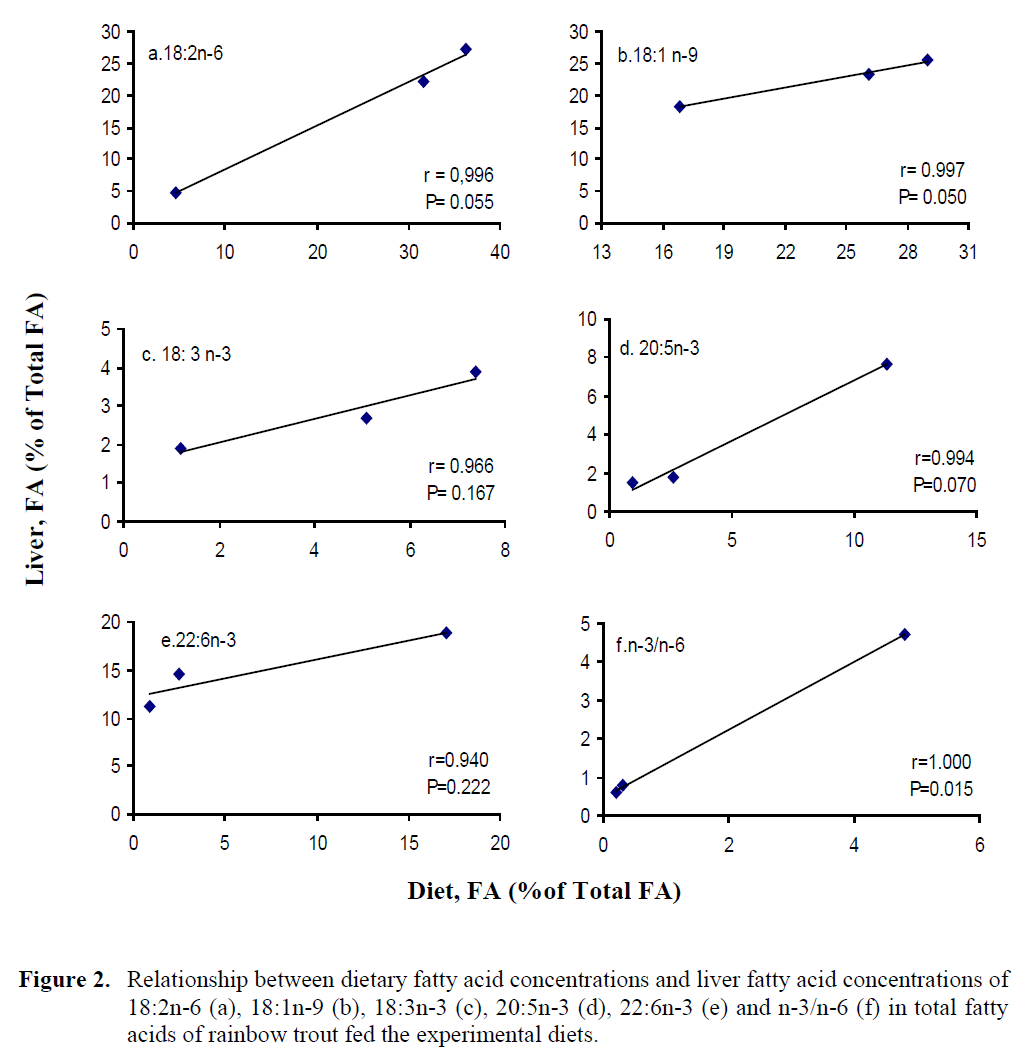
Figure 2: Relationship between dietary fatty acid concentrations and liver fatty acid concentrations of 18:2n-6 (a), 18:1n-9 (b), 18:3n-3 (c), 20:5n-3 (d), 22:6n-3 (e) and n-3/n-6 (f) in total fatty acids of rainbow trout fed the experimental diets.
In general, inclusions of high levels (>25%) of a single plant ingredient in salmonid diets was suggested to have negative effects on fish per-formance (Ogunkoya et al. 2006; Cheng et al. 2003; Francesco et al. 2007; Drew et al. 2007). The present study also showed that the replace-ment of fish meal with FFS protein resulted in decrease in trout growth.
In the present study, the replacement of fish meal and fish oil with the FFS resulted in an in-crease in total PUFA in fish fed FFS40 and FFS55 diets compared to those fed FFS0 diet. This was due to a significant increase in 18:2n-6 and 18:3n-3 which balanced a significant de-crease in 20:5n-3, 22:6n-3.
The fatty acid content of fish generally re-flects the fatty acid composition of the diet (Stef-fens, 1997;Izquierdo et al. 2003; Hei-Zhao et al. 2007; Bell et al. 2002; Bell et al. 2010). This was visibly shown in the present study. A linear rela-tionship between dietary and both muscle and liver FA concentrations was observed for 18:2n-6, 18:1n-9, 18:3n-3, 20:5n-3, 22:6n-3. Similarly, several other studies investigating the linear rela-tionship between dietary and muscle FA compo-sitions have been reported for O. mykiss by Drew et al. 2007, for Gadus morhua by Karalazos et al. 2007 for Salmo salar by Bell et al. 2002.
Some of the fatty acids in both muscle and liver reflected significantly by the fatty acid compositions of the feed. This study has also demonstrated that DHA, EPA and total n-3 PUFA fatty acids were reduced in rainbow trout muscle when fish meal and oil were replaced with FFS. The fatty acid profile of the muscle changed to reflect the fatty acid content of the feeds, but without affecting the amount of MUFA and PUFA. Likewise, Wu et al. (2002) found that the amount of MUFA and PUFA did not reflect their dietary origins. The main effect found in the muscle was an increased level of 18:2n-6. In gen-eral, replacement of fish oil with plant oil has re-sulted in a lower level of long chain n-3 fatty ac-ids, EPA and DHA, and higher levels of the 18 C fatty acid oleic acid and linolenic acid in muscle of several salmonid species such as rainbow trout and brown trout (Cabellero et al. 2002).
Most studies have shown that the levels of EPA and DHA are decreased in fish fed diets containing plant oils (Drew et al. 2007; Mourente and Bell 2006). Mourente and Bell (2006) re-ported that the levels of EPA and DHA found in fish muscle are directly related to their dietary levels in a range of species studied including salmon, rainbow trout, sea bass, sea bream and turbot. The fatty acid composition of the muscle in the present study was significantly influenced by that of the feed. However, in the present study, in trout muscle, EPA and DHA were found in much higher concentrations than in the diet when the fish were fed FFS. On the other hand, the DHA concentration of liver was lower than that of the muscle. According to Izquierdo et al.
(2003) and Hei-Zhao et al. (2007) the differences in utilization of specific FA in muscle and liver are related to the different mechanisms of FA in the two tissues.
Mourente and Bell (2006) stated that while dietary fatty acids are closely related to fatty ac-ids deposited in the muscle, specific fatty acids are selectively retained or utilized. There was selective deposition and retention of DHA, since muscle DHA concentrations were always higher than diet concentrations. This fact has also been stated by Cabellero et al. (2002) and Morris et al. (2005) for O. mykiss. Preferential deposition and/or retention of selected fatty acids including linoleic acid, arachidonic acid and DHA has pre-viously been recorded in rainbow trout (Morris et al. 2005). Most freshwater fish can elongate and desaturate 18:2n-6 and 18:3n-3 to into the longer chain n-3 fatty acids (Tocher et al. 2001; Bell et al. 2001).
In the present study, in muscle, EPA and DHA were found in higher concentrations in control diet then the fish fed FFS40 and FFS55 diets. Bell et al. (2001) suggest that the extent to which trout can elongate and desaturate 18:3n-3 to 22:6n-3 may have been exaggerated and that the majority of 22:6n-3 may be obtained from diet. Therefore, Bell et al. (2004, 2005) and Tor-stensen et al. (2004, 2005) stated that one way to successfully restore total n-3 PUFA is to dilute or wash out the plant oil derived fatty acids using a fish oil finishing diet. Bell et al. (2002) con-cluded that higher levels of plant oil could, in principle, be used in feed formulations for salmon provided that, at an appropriate time be-fore harvest, fish were placed on a fish oil and fish meal diet so that muscle levels of DHA, EPA, 18:2n-6 were normalized.
In fish, diet composition is mainly affected on muscle and liver fatty acid compositions. Never-theless, in the present study, in muscle and liver, 18:2n-6, 18:3n-3 and 18:1n-9 was found in lower concentrations than in the diet when the fish were fed FFS. In salmonids, muscle lipids are the main site of body lipid storage. Storage lipids as a re-serve of metabolic energy may be used during times of low feed intake and provide fatty acids for energy production (Sargent et al. 2002; Mourente and Bell 2006). For this reason, these FA were selectively utilized for metabolism, probably for energy production (Karalazos et al. 2007; Mourente and Bell 2006). In this study, the concentration of these fatty acids in liver was higher than in the muscle when the fish were fed FFS. This may be due to the different lipid class composition of these two tissues of trout. Y?ld?z and ?ener (2003) found higher 18:2n-6 and 18:3n-3 levels in the liver of the sea bass (Dicen-trarchus labrax) fed soybean oil than the sea bass fed fish oil, sunflower oil and corn oil diets. Sim-ilarly, Hunt and Tekelio?lu (2004) reported that, the levels of 18:2n-6 and 18:3n-3 were increased in the sea bass fed diets containing soybean oil.
As regarding PUFA/SFA, it was found to be 1.5, 2.1 and 2.2 in muscle for FFS0, FFS40 and FFS55 respectively in the present study. Ac-cording to the nutritional guidelines of the De-partment of Health (1994) of the UK, a ratio of 0.45 or more is recommended as a balanced fatty acid intake on healthy diet (Wood et al., 2003). Thus, in the present study, PUFA/SFA contents of muscle from O. mykiss fed experimental diets presented a higher PUFA/SFA ratio, which is also much higher than the minimum recom-mended value of 0.45. On the other hand, in the present study inclusion of FFS at levels 40% and 55% resulted in significant reductions in total n-3 PUFA, specifically EPA and DHA in the muscle such that the nutritional benefit to the consumer would be reduced.
Conclusions
In this study it was found that SFA, n-3 PUFA and n-3/n-6 were higher in the muscle of rain-bow trout fed fish oil and fish meal than the mus-sel of rainbow trout fed full-fat soya diets. The present results showed that the replacement of full-fat soya instead of fish meal and fish oil did not cause statistically significant changes in the muscle of total PUFA. This is important from the perspective of the nutritional quality of the prod-uct for human consumer, as long-chain PUFA play important role with regard to human health.
487
References
- Anonymous, (2008).Yearly Fishery Statistics.Prime Ministry of Turkey, Turkish Statisti-cal Institute (TURKSTAT), Ankara, Turkey
- nAOAC, (1995).Of ficial Methods of Analysis.Association of Official Analytical Chemists (AOAC) 16th edn, Arlington, V.A
- nBell, M.V., Dick J.R., Porter, A., (2001). Bio-synthesis and tissue deposition of do-cosahexaenoic acid (22:6n-3) in rainbow trout (Oncorhynchusmykiss), Lipids, 36(10):1153-1159. doi:doi: 10.1007/s11745-001-0826-1
- nBell, J.G., Henderson, R.J., Tocher, D.R., McGhee, F., D.ick, J.R., Porter, A., Smullen, R.P., Sargent, J.R., (2002). Substituting fish oil with crude palm oil in the diet of Atlantic salmon (Salmosalar) affects muscle fatty acids composition and hepatic fatty acid metabolism, The Journal of Nutrition, 132: 222-230
- nBell, J.G., Henderson, R.J., Tocher, D.R., Sar-gent, J.R. 2004. Replacement of dietary fish oil with increasing levels of linseed oil: modification of flesh fatty acid compositions in Atlantic salmon (Salmosalar) using a fish oil finishing diet, Lipids, 39: 223-232. doi: 10.1007/s11745-004-1223-5
- nBell J.G., McGhee, F., Dick, J.R., Tocher, D.R., (2005). Dioxin and dioxin-like polychlorin-ated biphenyls (PCBs) in Scottish farmed salmon (Salmosalar) effects of replacement of dietary marine fish oil with vegetable oils, Aquaculture, 243: 305-314. doi: 10.1016/j.aquaculture.2004.10.016
- nBell, J.G., Pratoomyot, J., Strachan, F., Hender-son, R.J., Fontanillas, R., Hebard A., Guy, D.R., Hunter, D., Tocher, D.R., (2010). Growth, flesh adiposity and fatty acid com-position of Atlantic salmon (Salmosalar) families with contrasting flesh adiposity: Ef-fects of replacement of dietary fish oil with vegetableoils, Aquaculture, 306: 225-232. doi: 10.1016/j.aquaculture.2010.05.021
- nBilgüven, M., Bar??, M., (2011).Effects of the feed containing different plant protein sources on growth performance and body composition of rainbow trout (Oncorhyn-chusmykiss), Turkish Journal of Fisheries and Aquatic Sciences, 11: 345-350.doi: 10.4194/1303-2712-v11_3_02
- nCabellero, M.J., Obach, A., Rosenlund, G., Montero, D., Gisvold, M., Izquierdo, M.S., (2002). Impact of different dietary lipid sources on growth, lipid digestibility, tissue fatty acid composition and histology of rain-bow trout, (Oncorhynchusmykiss), Aqua-culture, 214: 253-271. doi: 10.1016/S0044-8486(01)00852-3
- nCho, C.Y., Cowey, C.B., Watanabe, T., 1985.Finfish Nutrition in Asia: Methodological Approaches to Research and Development, Ottawa, Ont., IDRC
- nChristie, W.W., (1992). Gas chromatography and lipids. The Oil Pres, Glaskow, pp: 302
- nCheng, Z.J., Hardy, R.W.,Blair, M., (2003). Ef-fects of supplementing methionine hydroxy analogue in soybean meal and distillers dried grain-based diets on the performance and nutrient retention of rainbow trout, (On-corhynchusmykissW.), Aquaculture Re-search, 34: 1303-1310.doi: 10.1046/j.1365-2109.2003.00940.x
- nDavies, S.J., Morris, P.C., (1997). Influence of multiple aminoacid supplementation on the performance of rainbow trout, (Oncorhyn-chusmykissW), fed soya based diets, Aqua-culture Research, 28: 65-74. doi: 10.1111/j.1365-2109.1997.tb01316.x
- nDepartment of Health (1994).Nutritional Aspects of Cardiovascular Disease. Report on Health and Social Subjects No. 46. HMSO, Lon-don
- nDrew, M. D., Ogunkoya, A.E., Janz, D.M., Van Kessel, A.G., (2007). Dietary influence of replacing fish meal and oil with canola pro-tein concentrate and vegetable oils on growth performance fatty acid composition and organochlorine residues in rainbow trout (Oncorhynchusmykis), Aquaculture, 267: 260-268. doi: 10.1016/j.aquaculture.2007.01.002
- nFrancesco, M.De.,Parisi, G., Perez-Sanchez, J., Gomez-Requeni, P., Medale, F. Kaushik, S.J. Mecatti, M., Poli, B.M., (2007). Effect of high-level fish meal replacement by plantproteins in gilthead sea bream (Sparusaurata) on growthand body/filet quality traits, Aquaculture Nutrition, 13: 361-372. doi: 10.1111/j.1365-2095.2007.00485.x
- nHara, A., Radin, N.S., (1978). Lipid extraction of tissues with alow- toxicity, Analytical Bio-chemistry, 90(1):420-426. doi: 10.1016/0003-2697(78)90046-5
- nHarl?o?lu, A.G., (2011 a). Present status of fish-eries in Turkey, Reviews in Fish Biology and Fisheries, 21: 667–680.doi: 10.1007/s11160-011-9204-z
- nHarl?o?lu, A.G., (2011 b). The influence of re-placing fish meal partially in diet with soy-bean meal and full-fat soya on growth and body composition of rainbow trout (On-corhynchusmykiss), Pakistan Journal of Zoology, 43(1): 175-182
- nHei-Zhao, L., Yong –Jian, L., Jian,-Guo, H., Wen-Hui, Z., Li-Xia, T., (2007).Alternative vegetable lipid sources in diets for grouper, Epinepheluscoioides(Hamilton): effects on growth, and muscle and liver fatty acid composition, Aquaculture Research, 38: 1605-1611.doi: 10.1111/j.1365-2109.2007.01811.x
- nHunt, A.Ö.,Tekelio?lu, N., (2004). Effect of die-tarylipit sources on the growth and liver fatty acid composition of sea bass (Dicen-trarchuslabraxL. 1758), SüleymanDemirel University, Journal of E?irdir Fisheries Faculty, 12: 20-25
- nIzquierdo, M.S., Obach A., Arantzamendi, L., Montero, D., Robaina, L., Rosenlund, G., (2003). Dietary lipid sources for seabream and seabasss: growth performance, tissue composition and flesh quality, Aquaculture Nutrition, 9: 397-407.doi: 10.1046/j.1365-2095.2003.00270.x
- nKaralazos, V., Treasurer, J., Cutts, C.J., Alder-son, R., Galloway, T.F., Albrektsen, S., Ar-nason, J., Macdonald, N., Pike, I., Bell, J.G., (2007). Effects of fish meal replacement with Full-fat soy meal on growth and tissue fatty acid composition in Atlantic cod (Ga-dusmorhua), Journal of Agricultural and Food Chemistry, 55: 5788-5795. doi: 10.1021/jf0629383
- nKaushik, S.J., Cravedi, J.P., Laqlles, J.P., Sump-ter, J., Fauconneau, B., Laroche, M., (1995). Partial or total replacement of fish meal by soybean protein on growth, protein utiliza-tion, potential estrogenetic or antigenic ef-fectscholesterolemia and flesh quality in rainbow trout, (Oncorhynchusmykiss), Aq-uaculture, 133: 257-274. doi: 10.1016/0044-8486(94)00403-B
- nKöprücü, K., (2007). Water products production and their use in Turkey (in Turkish), Turk-ish-Agriculture Periodical, 178: 22-28
- nMorris, P.C., Gallimore, P., Handley, J., Hide, G., Haughton, P., Black, A., (2005). Full-fat soya rainbow trout (Oncorhynchusmykiss) in freshwater, Effect on performance, com-position and flesh fatty acid profile in ab-sence of hind,-gut enteritis, Aquaculture, 248: 147-161.doi: 10.1016/j.aquaculture.2005.04.021
- nMourente, G., and Bell, J.G. (2006). Partial re-placement of dietary fish oil with blends of vegetable oils (rapeseed, linseed and palm oils) in diets for European sea bass (Dicen-trarchuslabrax L.) over along term growth study: Effects on muscle and liver fatty acid composition and effectiveness of a fish oil finishing diet, Comparative Biochemistry and Physiology Part B, 145: 389-399. doi: 10.1016/j.cbpb.2006.08.012
- nMundheim, H., Aknes, A., Hope, B., (2004). Growth, feed efficiency and digestibility in salmon (Salmosalar) fed different dietary proportions of vegetable protein sources in combination with two fish meal qualities, Aquaculture, 237: 315-331. doi: 10.1016/j.aquaculture.2004.03.011
- nNRC, (1993).Nutrient Requirements of Fish. National Research Council (NRC), National Academy Press, Washington, D.C
- nOgunkoya, A.E., Page, G.I., Adewolu, M.A., Bu-reau, D.P. (2006). Dietary incorporation of soybean meal and exogenous enzyme cock-tail can effect physical characteristics of fae-cal material egested by rainbow trout (On-corhynchusmykiss). Aquaculture, 254: 466-475.doi: 10.1016/j.aquaculture.2005.10.032
- nRefsitie, S., Korsoen, O.J., Storebakken T., Baeverfjord, G., Lein, I., Roem, A.J., (2000). Differing nutritional responses to di-etary soybean meal in rainbow trout (On-corhynchusmykiss) and Atlantic Salmon (SalmoSalar), Aquaculture, 190: 49-63. doi: 10.1016/S0044-8486(00)00382-3
- nRomarheim, O.H., Skrede, A., Gao, Y., Kroogdahl, A., Denstadli, V., Lilleeng, E., Storebakken, T., (2006). Comparision of white flakes and toasted soybean meal partly replacing fish meal as protein source in ex-truded feed for rainbow trout (Oncorhynchusmykiss), Aquaculture, 256: 354-364. doi: 10.1016/j.aquaculture.2006.02.006
- nRomarheim, O.H., Skrede, A., Penn, M., Mydland, L.T., Krogdahl, A., Storebakken, T., (2008). Lipid digestibility, bile drainage and development of morphological intestinal changes in rainbow trout (Oncorhynchusmykiss), fed diets containing defatted soy-bean meal, Aquaculture, 274: 329-338. doi: 10.1016/j.aquaculture.2007.11.035
- nSargent, J.R., Tocher, D.R., Bell, J.G. (2002). Thelipids. In: Halver, J.E., Hardy, R.W.(Eds.), Fish Nutrition , 3rd ed. Elsevier, USA, pp. 181-257
- nSteffens, W., (1997). Effects of variation in es-sential fatty acids in fish feeds on nutritive value of freshwater fish for humans, Aqua-culture, 151: 97-119. doi: 10.1016/S0044-8486(96)01493-7
- nTocher, D.R., Bell, J.G., MacGlaughlin, P., McGhee, F., Dick, J.R., (2001). Hepatocyte fatty acid desaturation and polyunsaturated fatty acid composition of liver in salmonids: effects of dietary vegetable oil, Comparative Biochemistry and Physiology, 130(B): 257-270
- nTorstensen, B.E., Froyland, L., Lie, O., (2004). Replacing dietary fish oil with increasing levels of rapeseed oil and olive oil –effects on Atlantic salmon (Salmosalar) tissue and lipoprotein composition and lipogenetic en-zyme activities, Aquaculture Nutrition, 10: 175-192. doi: 10.1111/j.1365-2095.2004.00289.x
- nTorstensen, B.E., Bell, J.G., Sargent, J.R., Rosenlund, G., Henderson, R.J., Graff, I.E., Lie, O., Tocher, D.R., (2005). Tailoring of Atlantic salmon (SalmosalarL.) flesh lipid composition and sensory quality by replac-ing fish oil with a vegetable oil blend, Jour-nal of Agricultural and Food Chemistry, 53: 10166-10178. doi: 10.1021/jf051308i
- nUstao?lu, S., Rennert, B. (2002). The apparent nutrient digestibility of diets containing fish meal or isolated soy protein in starlet (Acipenserruthenus), International Review of Hydrobiology, 87: 577-584. doi: 10.1002/1522-2632(200211)87:5/6<577::AID-IROH577>3.0.CO;2-4
- nY?ld?r?m, Ö., (2006). Circumstances of fish meal-oil fabrics in Sinop and their position in Turkish fish meal-oil production, F?rat Uni-versity International Journal of Science and Technology, 18(2): 197-203
- nY?ld?z, M., ?ener, E., (2003). The effects of re-placing fish oil with vegetable oils in starter feeds on the liver fat composition of sea bass (DicentrarchuslabraxL. 1758), Turkish Journal of Veterinary and Animal Sciences, 27:709-717
- nWood, J.D., Richardson, G.R., Nute, G.R., Fisher, A.V., Campo, M.M., Kasapidou, E., Sheard, P.R., Enser, M., (2003).Effects of fatty acids on meat quality: a review, Meat Science, 66: 21-32.doi: 10.1016/S0309-1740(03)00022-6
- nWu, F.C., Ting, Y.Y., Chen, H.Y., (2002). Do-cosahexaenoic acid is superior to eicosa-pentaenoic acid as the essential fatty acid for growth of grouper, (Epinephelusmalabari-cus), Journal of Nutrition, 132:72-79.
