Research Article - (2024) Volume 15, Issue 4
Infusing the alligator: Infusion studies in a low compliance system
Anchal Scott,
Michael Cramberg,
Hadyn De Leeuw,
Matthew Dille,
Seth Parker,
Emily Pick,
Stephanie Sopko,
Annelise Swords,
Ethan Taylor,
Mary Thompson and
Bruce A. Young*
Department of Anatomy, Kirksville College of Osteopathic Medicine, Kirksville, MO 63501, USA
*Correspondence:
Bruce A. Young, Department of Anatomy, Kirksville College of Osteopathic Medicine, Kirksville, MO 63501,
USA,
Email:
Received: 29-Jul-2024, Manuscript No. ipjnn-24-15088;
Editor assigned: 31-Jul-2024, Pre QC No. P-15088;
Reviewed: 12-Aug-2024, QC No. Q-15088;
Revised: 17-Aug-2024, Manuscript No. R-15088;
Published:
24-Aug-2024
Abstract
An Infusion study is a neurological procedure in which a volume of
fluid is added to the existing cerebrospinal fluid. The additional fluid
volume increases the intracranial pressure; by monitoring how the
system responds to this challenge, the clinician gains insight into the
compliance of the dura and nervous tissue. Though commonly used
clinically, the invasive nature of infusion studies means that they have
rarely been applied in non-clinical studies, and appear to have only been
used on mammalian subjects.
Infusing a bolus of artificial cerebrospinal fluid into the cranial
compartment of the American alligator (Alligator mississippiensis),
produces pressure/volume curves with most of the attributes
seen during infusion studies of humans or other mammals. Two
consistent, unusual findings were noted: the compliance in the cranial
compartment of Alligator is low (around 1.0) likely due to the small size
of both the compartment and the dural sinuses; and the peak pressure
drops off much faster than in a typical infusion study. A second round
of bolus infusions were performed, these had a bidirectional design
with infusions conducted at the midpoint of the spinal compartment
as well as the cranial compartment. Similar results were obtained: the
spinal compartment compliance was low (around 1.0), and the peak
infusion pressures dropped off quickly with minimal propagation to
the other compartment. The spinal dura of Alligator is ensheathed by
a large venous sinus, which contributes to the low compliance of the
spinal compartment. A final round of bidirectional infusions tested the
influence of the spinal venous sinus; a bolus of Ringer’s solution was
injected into the sinus immediately before the infusion. As expected,
the pressurization of the spinal venous bolus lowered the compliance of
the system, raising peak infusion pressures; however, the pressures still
showed rapid decay with little propagation to the other compartment.
Herein it is proposed that the paradox of low compliance coupled
with rapid pressure loss and minimal pressure propagation is present
because the spinal dura of A. mississippiensis functions as a pressure
modulated relief system for the cerebrospinal fluid.
Keywords
Pressure volume index; Cerebrospinal fluid; Infusion test;
Pressure pulsations; Crocodylia; Venous sinus
Introduction
Low compliance infusion
The Cerebrospinal Fluid (CSF) surrounds and perfuses the brain and spinal cord, which it nourishes, cleanses, and supports [1]. The flow and fluid pressure of the CSF is irregular and pulsatile, being influenced by the cardiac [2] and ventilatory cycles [3], as well as by movement [4]. The fluid dynamics of the CSF are highly influenced by the compliance of the surrounding meninges, particularly the dura mater [5,6]. Meningeal compliance is influenced by blood pressure within the associated meningeal arteries, and, more importantly, the dural sinus complex [7].
The Relationships between CSF pressure and meningeal compliance can be assayed by performing an infusion study [8]. In an infusion study a quantity of artificial Cerebrospinal Fluid (aCSF) is added to the existing CSF, using either a rapid bolus [7] or longer constant rate protocol [9] and the resulting changes in CSF pressure are tracked. Changes in the CSF pressure as the system returns to the resting state are determined by the compliance and resistance of the system [10-12]. In a healthy human or other mammal, the cranial compliance is typically 2x greater than the spinal compliance [7]. Despite this difference in compliance, under both natural conditions and during clinical alterations, such as infusion studies, nearly identical pressure/volume curves will be recorded in the cranial and spinal compartments [13-15].
Not all vertebrates have differential compliance in their CSF compartments. Crocodylians, including the American alligator (A. mississippiensis), have a large spinal venous sinus. Partial descriptions of this sinus were provided by Pothiwong, et al. [16] and Zippel, et al. [17]. A detailed analysis [18] demonstrated that the spinal venous sinus of Alligator ensheaths the spinal dura and has a cross-sectional area nearly 3x that of the spinal CSF. In Alligator the cranial compartment is characterized by a high ratio of CSF volume: vascular volume, while the spinal compartment is characterized by a low ratio of CSF volume: vascular volume Fig. 1. The surrounding meninges are essentially the same in both compartments; Alligator, like other reptiles, does not have a fused periosteal dura in the skull [19]. Since the meninges are the same, the compliance difference between these two compartments will be determined by the ratio of CSF volume: vascular volume and, in particular, by the venous blood pressure. Previous experimental work showed that there is only a slight directional asymmetry in CSF flow through the foramen magnum of Alligator [20] and that a complex relationship exists between pressure waves in the spinal CSF and venous blood pressure waves in the surrounding spinal venous sinus [21]. Accordingly, we hypothesize that in A. mississippiensis the spinal and cranial compartments will exhibit a balanced low compliance. The present study was undertaken to test the hypothesized balanced low compliance within the spinal and cranial compartments using the established clinical tool of an infusion study. More specifically, we sought to test three hypotheses:
Hypothesis one: Performing identical infusion protocols in the spinal and cranial compartments of A. mississippiensis will produce similar quantitiative metrics of compliance (the Pressure Volume Index or PVI) in the two compartments, as well as statistically similar pressure/volumes curves (similar pressure/volume curves are obtained even in systems with differential compliance) [14].
Hypothesis two: The low compliance of Alligator is largely due to the presence of a large venous sinus surrounding the spinal dura and spinal CSF; accordingly, increasing pressure within this venous sinus should significantly increase the spinal compliance, create a compliance asymmetry in this system, and amplify any differences in the pressure curves obtained during infusion studies in the cranial and spinal compartments.
Hypothesis three: The basic structural features of the cranial compartment of A. mississippiensis are similar to those of other vertebrates; as such infusion studies in the cranial compartment of Alligator are hypothesized to parallel those of humans and other mammals and can be used to accurately gauge the compliance of the cranial compartment. The unique feature of the Alligator system is the unusual spinal compliance caused by the large spinal venous sinus.
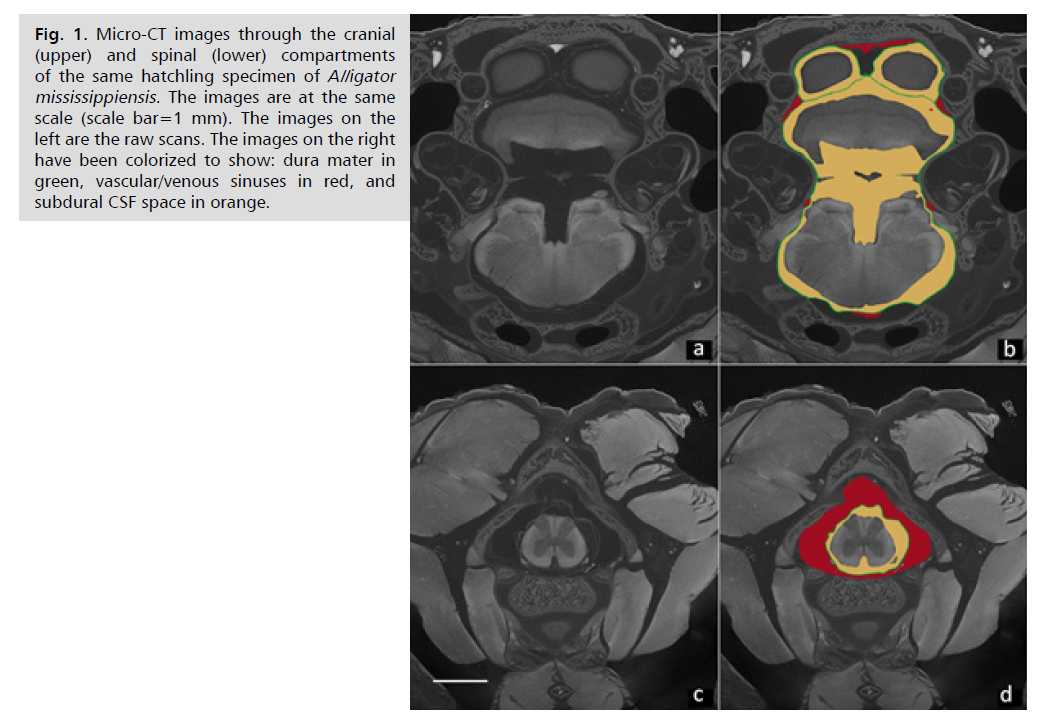
Fig. 1: Micro-CT images through the cranial
(upper) and spinal (lower) compartments
of the same hatchling specimen of Alligator
mississippiensis. The images are at the same
scale (scale bar=1 mm). The images on the
left are the raw scans. The images on the right
have been colorized to show: dura mater in
green, vascular/venous sinuses in red, and
subdural CSF space in orange.
Materials and Methods
Live animals
Thirteen live sub-adult (164 - 190 cm total length, 12.5– 25.4 kg mass) American alligators (A. mississippiensis) were obtained from the Louisiana Department of Wildlife and Fisheries. The animals were housed communally in a 29 m2 facility that featured three submerging ponds, natural light, and artificial lights on a 12:12 cycle. The facility was maintained at 30–33°C; warm water rain showers were provided every 20 minutes which helped maintain the facility at > 75% relative humidity. The alligators were maintained on a diet of previously frozen adult rats. The husbandry and use of the live alligators followed all applicable federal guidelines, and were approved by the IACUC of A.T. Still University (Protocol #226, approved 16 March 2022).
Surgical preparation
When the individual alligator was noosed for the surgical experiment it was induced to bite a cushioned bite pad, and the animal’s mouth was taped shut around the bite pad. Each individual alligator was placed on a stiff board (244 x 28 x 3.8 cm thick), which exceeded the maximum width and length of the alligators used for this study. Six 2.5 cm wide heavy duty straps were used to secure the alligator to the board; the straps were tight enough to minimize movement of the animal but not tight enough to impede ventilation or circulation. With the alligator’s mouth held open by the bite pad, a laryngoscope was used to depress the gular valve and expose the glottis. A cuffed endotracheal tube was inserted into the larynx and connected to a custom anesthesia system that included a ventilator pump, Vaporstick anesthesia machine (Surgivet; Morrisville, NC, USA), isoflurane vaporizer (Surgivet), and Capnomac Ultima respiratory gas monitor (Datex-Engstrom; Madison, WI, USA). The alligators were maintained on a steady ventilatory pattern of 6-7 breaths per minute each with a tidal volume of 500 ml. Anesthesia was accomplished using 5% isoflurane. A 0.2 mg/kg dose of Meloxicam (MWI, Boise, ID, USA) was administered into the left triceps to serve as an analgesic.
Infusion studies
For infusion into the cranial compartment, a surgical drill was used to bore a 4mm diameter hole through the dorsum of the alligator’s skull to expose the dura. A small incision was made in the dura to allow the passage of a pressure catheter. Surgical adhesive was used to seal the dura around the catheter and then epoxy cement was added to fill the surgical opening and secure the catheter to the skull. For infusion into the spinal compartment, laminectomies were performed on the alligator equivalent of the L2 and L3 vertebrae in order to expose a length of the spinal venous sinus. An incision, approximately 5 mm in length, was made in the sinus, then hemostatic sponges and/or powder used to stop any bleeding while not impeding venous blood flow along the spinal venous sinus. An opening was made in the hemostatic material to expose the dorsal surface of the spinal dura. A small incision, approximately 2 mm in length, was made in the spinal dura; a pressure catheter, identical to the one implanted in the skull, was implanted into the subdural space of the spinal cord. The two pressure catheters were separated by a mean distance of 52 cm Fig. 2.
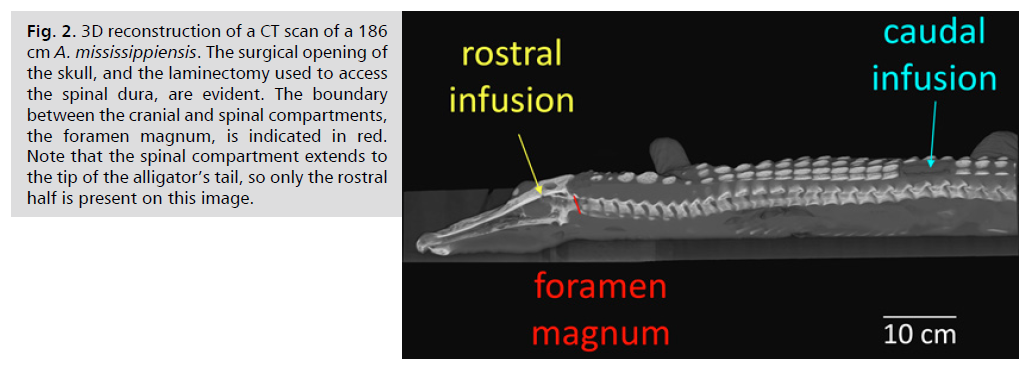
Fig. 2: 3D reconstruction of a CT scan of a 186
cm A. mississippiensis. The surgical opening of
the skull, and the laminectomy used to access
the spinal dura, are evident. The boundary
between the cranial and spinal compartments,
the foramen magnum, is indicated in red.
Note that the spinal compartment extends to
the tip of the alligator’s tail, so only the rostral
half is present on this image.
Identical fluid pressure transducers (APT300, Harvard Apparatus; Holliston, MA, USA) were mounted on the board, at the level of the dorsal surface of the alligator. The pressure transducers, and the attached pressure catheters, were filled with Artificial Cerebrospinal Fluid (aCSF). The pressure transducers were coupled to strain gauge amplifiers (P122, GRASS Instruments; West Warwick, RI, USA); surface EKG electrodes were connected to another P122 amplifier. The outputs from the two pressure transducers (rostral and caudal), and the EKG, were sampled simultaneously at 4 kHz using the MiDAS (Xcitex Inc., Woburn, MA, USA) data acquisition system.
Hypothesis one
Bidirectional trials were performed using a “fast” infusion protocol (10.0 ml/min, for a duration of 15s, yielding a total bolus volume of 2.5ml of aCSF) using an infusion pump (22, Harvard Apparatus). The resulting CSF pressure changes were monitored for the next 300s in both the cranial and spinal compartments. Once the CSF pressures returned to the resting (starting) level, the protocol was repeated but with the aCSF being added through the other pressure catheter (into the other compartment). The order (rostral or caudal) of the infusion trials was randomized. An initial three trials were conducted in which the infusion was delivered manually, then four additional A. mississippiensis were studied using the infusion pump.
Hypothesis two
Bidirectional infusion trials were performed as described above, except immediately before the addition of the aCSF, a 3.0 ml bolus of reptilian Ringers solution [22] was injected into the spinal venous sinus at the level of the foramen magnum. An initial three trials were conducted in which the infusion was delivered manually, then four additional A. mississippiensis were studied using the infusion pump.
Hypothesis three
Rostral infusions with two different protocols were performed; a slow infusion (rate of 2.0 ml/min, for a duration of 30s, yielding a total bolus volume of 1.0 ml), and a moderate infusion (rate of 8.0 ml/min, for a duration of 15 s, yielding a total bolus volume of 2.0 ml). The slow and moderate infusion protocols were then repeated, but this second round of infusions were performed with the animal maintained at a 30° head-down posture. Previous studies have shown that when Alligator is placed in this posture, there is a sustained elevation of cranial arterial blood pressure, cranial venous blood flow, and cranial CSF pressure [23-25] no orthostatic compensatory mechanism has been observed in Alligator. Lastly, the alligators were returned to a horizontal posture, and 3.5 ml of an Acetazolamide (Sigma-Aldrich, St. Louis, MO, USA) solution was administered into the rostral portion of the spinal venous sinus. The Acetazolamide solution was prepared to yield an effective dosage of 100 mg/kg; which is equivalent to the clinical mammalian dosage [26]. Ten minutes after the administration of the Acetazolamide, a third series of slow and moderate infusion studies was performed. The six consecutive infusion trials used for the test of hypothesis three were performed on six A. mississippiensis.
Data analysis
Both pressure catheters were individually calibrated after each trial. The baseline CSF pressure in alligators is typically around 4.5 mmHg, but varies over time and between individuals (as it does in humans, e.g.,) [27] to eliminate this variation, all pressure traces were adjusted so that the baseline pressure was equal to 4 mmHg. As with the resting baseline pressure, CSF pressure curves produced during the infusion studies will be shown independent of the increased pressure (on the order of 20 mm Hg) caused by the head-down posture. For each pressure record, the peak pressure and time to peak pressure (defined as the interval between the first sustained increase in pressure above baseline and the peak pressure) were quantified. The pressure-volume index (PVI) was calculated [10]. The curve fitting algorithm in EXCEL was used to calculate the slope of the pressure trace for 30 s beginning at the peak pressure; consistently a power curve (CSF pressure=intercept * timeslope cofficient) yielded the best fit to the pressure traces. Bonferroni-adjusted two-tailed t-tests were used to compare these four metrics of the CSF pressure curves.
Subsequently, each set of pressure traces (i.e., the four cranial CSF pressure traces recorded during caudal infusions without a venous bolus) was averaged to yield a single summary pressure curve. For each summary curve the same four metrics (peak pressure, time to peak pressure, PVI, power coefficient of pressure decrease) were determined, as was the total area under the curve (in mmHg*s), and the outflow resistance (Rout in mmHg/ml/minute, following) [10].
Results
Experimental test of hypothesis one
General pattern of the bidirectional infusion: The CSF pressures in the sources (i.e., the cranial pressure during rostral infusions and the spinal pressure during the caudal infusions) were characterized by a rapid pressure increase (corresponding to the 15 s duration of the infusion protocol), then a more gradual decline in pressure Fig. 3. The spinal CSF pressures had greater peak pressures, despite identical infusion protocols and catheters Fig. 3. The CSF pressures in the sinks (i.e., the sinks being the cranial pressure during caudal infusion and the spinal pressure during rostral infusion) had a more gradual increase and much lower peak pressures Fig. 3.
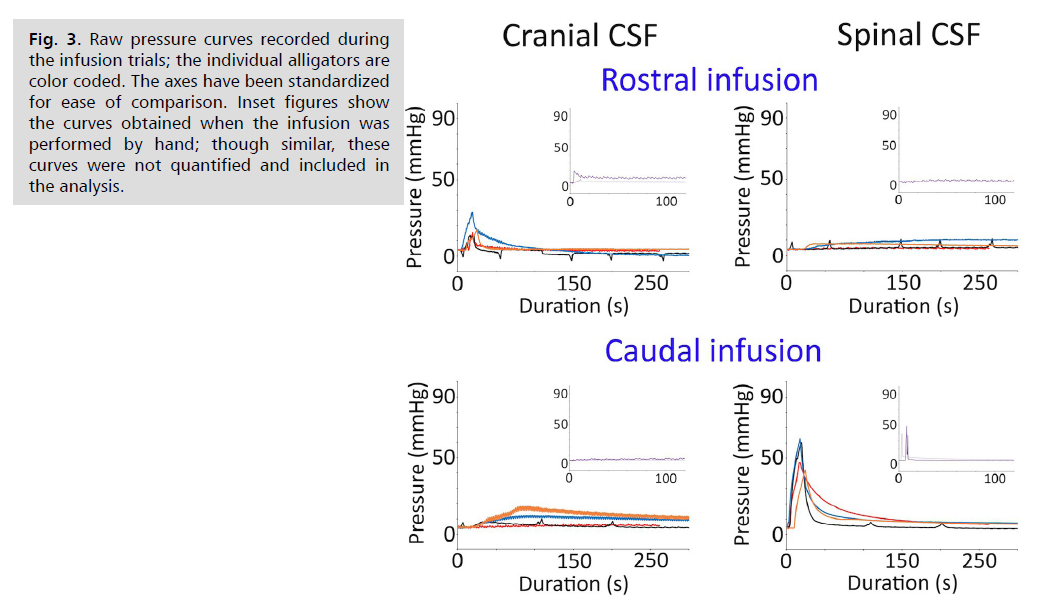
Fig. 3: Raw pressure curves recorded during
the infusion trials; the individual alligators are
color coded. The axes have been standardized
for ease of comparison. Inset figures show
the curves obtained when the infusion was
performed by hand; though similar, these
curves were not quantified and included in
the analysis.
Features of the bidirectional pressure traces: The peak infusion pressures Tab. 1. were always greater at the source than at the sink. Without a venous bolus, this differential was significant during both rostral (t=3.29, p=0.008) and caudal (t=7.41, p=0.0002) infusions. But there was also a marked asymmetry to the data. The peak pressures recorded in the cranial CSF Tab.1. while it served as the source (during rostral infusions) or as the sink (during caudal infusions) were not significantly different (t=1.86, p=0.113). In contrast, the peak pressures recorded in the spinal CSF Tab. 1. While it served as the source (during caudal infusions) or as the sink (during rostral infusions) were consistently the greatest differential and were significantly different (t=8.85, p=<0.0001).
| Variables |
Infusion |
Infusion |
| Peak CSF Pressure |
| Cranial CSF Pressure |
19.2,6,8 |
11.3,5.1 |
| Spinal CSF Pressure |
7.3,2.5 |
52.9,10.0 |
| Time to Peak Pressure |
|
| Cranial CSF Pressure |
12.7,7.0 |
83.2,53.0 |
| Spinal CSF Pressure |
128.2,83.0 |
15.3,1.2 |
| Differential Onset Time |
26.65,13.35 |
12.15,1.49 |
| Propagation Velocity |
2.24,0.81 |
4.32,0.50 |
| Pressure Coeffient |
| Cranial CSF Pressure |
-0.75,0.25 |
-0.22,0.13 |
| Spinal CSF Pressure |
-0.06,0.06 |
-1.53,0.69 |
| Pressure Velocity Index |
| Cranial CSF Pressure |
1.38,0.13 |
3.05,1.4 |
| Spinal CSF Pressure |
5.75,3.04 |
0.98,0.074 |
Tab. 1. Quantified metrics from the bidirectional infusion study of Alligator mississippiensis. All values are: mean, standard deviation. Red lines indicate statistically significant differences (as judged by Bonferroni-adjusted paired t-tests).
During the bidirectional trials the source pressures (cranial CSF during rostral infusions, and spinal CSF during caudal infusions) reached their peak over a duration that corresponded to the 15s duration of the infusion. In contrast, it typically took over a minute to reach peak pressure in the sink Tab. 1. so the source and sink times to peak pressure were significantly different. There was an asymmetry between the two sinks with the spinal CSF taking longer to reach peak pressure than the cranial CSF, though the high variation rendered this difference not significant (t=0.91, p=0.198).
The differential time to peak pressure is largely a reflection of the shape of the pressure curve Fig. 3. in the source and the sink. To get an idea of propagation times, the onset of the pressure increase was also quantified. This was defined as the first sustained increase in CSF pressure after the start of the infusion trial. If the differential values of the onset time (e.g., sink onset time minus source onset time) are compared Tab. 1. during rostral infusions the differential onset times were roughly double those of the caudal infusion but this difference was not significant (t=-2.07, p=0.130). Though the onset times were not significantly different, the associated propagation velocities were (t=4.38, p=0.0071) Tab. 1.
When a power curve was fit onto the infusion pressure curves for a period of 30s beginning at the peak pressure, the coefficient of the slope equation was always greater from the source line than from the sink line Tab. 1. The difference between the sink and source slope coefficients was smallest with the cranial CSF pressures, but even here the difference was significant (t=3.71, p=0.0069). The sink coefficients, though lower in magnitude, collectively had greater relative variation than did the source coefficients; this was due to a few positive and (effectively) zero coefficients among the slope equations from the sink pressures.
The Pressure-Volume Index (PVI) was developed by Marmarou, et al. [7] as a means of assessing compliance from infusion pressure curves. The results of the bidirectional trials showed that: 1) the PVI at the sink is consistently larger than the PVI at the source Tab 1. and 2) the differential between source and sink was greater for the spinal CSF, though the two sink PVIs were not significantly (t=2.1, p=0.045) different, the two source PVIs were (t=5.54, p=0.0007).
| Variables |
Baseline |
After Venous Bolus |
| Peak CSF Pressure |
Rostral Infusion |
| Cranial CSF Pressure |
19.2,6.8 |
41.8,15.6 |
| Spinal CSF Pressure |
7.3,2.5 |
16.0,7.8 |
| Caudal Infusion |
| Cranial CSF Pressure |
11.3,5.1 |
13.2,1.5 |
| Spinal CSF Pressure |
52.9,10.0 |
78.2,12.0 |
| Time to Peak Pressure |
Rostral Infusion |
| Cranial CSF Pressure |
12.7,7.0 |
15.5,4 |
| Spinal CSF Pressure |
128.2,83.0 |
18.3,11.8 |
| Caudal Infusion |
| Cranial CSF Pressure |
83.2,53.0 |
79.3,72.0 |
| Spinal CSF Pressure |
15.3,1.2 |
14.5,0.4 |
| Differential Onset Time |
Rostral Infusion |
26.65,13.35 |
13.1,4.35 |
| Caudal Infusion |
12.15,1.49 |
5.92,1.06 |
| Propagation Velocity |
Rostral Infusion |
2.24,0.81 |
4.33,1.48 |
| Caudal Infusion |
4.32,0.50 |
11.67,2.15 |
| Pressure Coefficient |
Rostral Infusion |
| Cranial CSF Pressure |
-0.75,0.25 |
-1.53,0.92 |
| Spinal CSF Pressure |
-0.06,0.06 |
-0.49,0.29 |
| Caudal Infusion |
| Cranial CSF Pressure |
-0.22,0.13 |
-0.60,0.84 |
| Spinal CSF Pressure |
-1.53,0.69 |
-1.86,0.88 |
| Pressure Velocity Index |
Rostral Infusion |
| Cranial CSF Pressure |
1.38,0.13 |
1.12,0.21 |
| Spinal CSF Pressure |
5.75,3.04 |
2.07,0.62 |
| Caudal Infusion |
| Cranial CSF Pressure |
3.05,1.4 |
2.11,0.19 |
| Spinal CSF Pressure |
0.98,0.07 |
0.845,0.05 |
Tab. 2. Quantitative comparison of the influence of adding a bolus of Ringer’s solution into the spinal venous sinus immediately prior to the infusion study. All values are: mean, standard deviation. Red lines indicate statistically significant differences (as judged by Bonferroniadjusted paired t-tests).
Despite using identical infusion protocols, pressure transducers, and pressure catheters, over half of the measured variables were significantly asymmetric Tab. 1. Compliance in the spinal compartment (as measured by PVI) had a mean of 0.98, with a standard deviation of 0.07.
Experimental test of hypothesis two
The addition of a venous bolus increased the peak pressures in both of the sources, but did not change the basic appearance of the infusion curves in the sinks Fig. 4. The addition of the venous bolus significantly increased the peak spinal CSF pressures during caudal infusion (t=3.22, p=0.009), the peak cranial CSF pressure during rostral infusion (t=2.65, p=0.019); while the source pressures significantly increased; the peak increase in the sin pressure was not significant) Tab. 2. The addition of the venous bolus had no significant influence on the time to peak cranial CSF pressure, whether recorded as a source or a sink; however, the addition of the venous bolus significantly (t=2.62, p=0.019) reduced the time to peak pressure recorded in the spinal CSF, but only when acting as a sink Tab. 2.
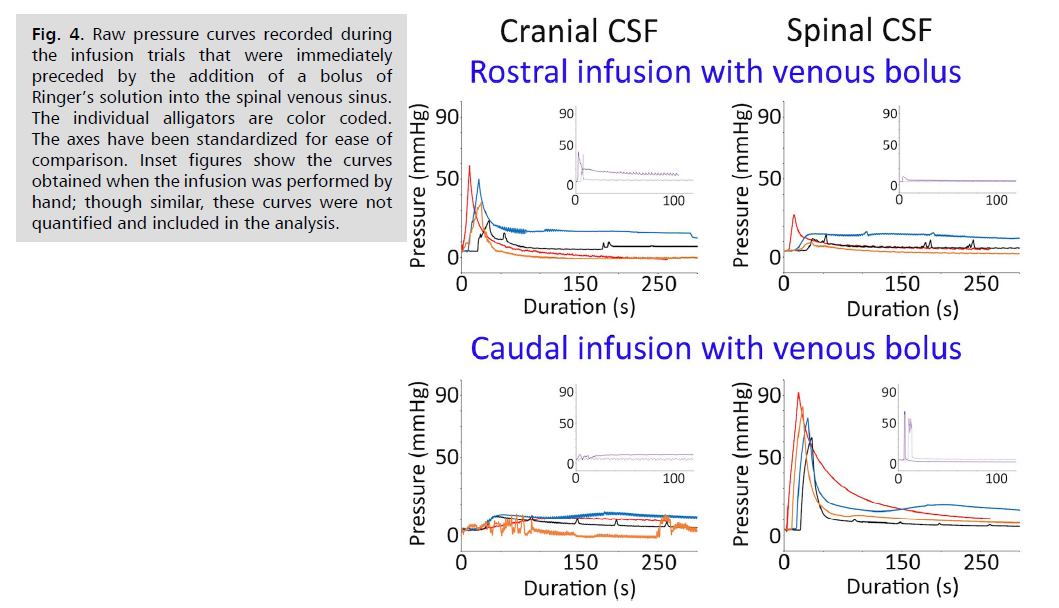
Fig. 4: Raw pressure curves recorded during
the infusion trials that were immediately
preceded by the addition of a bolus of
Ringer’s solution into the spinal venous sinus.
The individual alligators are color coded.
The axes have been standardized for ease of
comparison. Inset figures show the curves
obtained when the infusion was performed by
hand; though similar, these curves were not
quantified and included in the analysis.
The introduction of the venous bolus significantly reduced the differential onset times during both rostral (t=-1.93, p=0.05) and caudal (t=-3.67, p=0.005) infusions Tab. 2. Associated with the decrease in differential onset times following the venous bolus, there were significant increases in propagation velocity during both rostral (t=2.47, p =0.024) and caudal (t=4.3, p=0.0025) infusions Tab. 2. The introduction of a venous bolus prior to the infusion test increased the slope coefficients for both the sink and source pressure lines Tab. 2. however, this increase was only significant (t=2.93, p=0.031) for the spinal CSF pressures during rostral infusions. The addition of the venous bolus lowered all of the PVIs, reducing the differential between the source and the sink Tab. 2. The reduction in PVI values was significant for the spinal CSF during both caudal (t=3.05, p=0.011) and rostral (t=2.37, p=0.027) infusions; the reductions in the cranial CSF PVI were not significant Tab. 2.
The administration of a venous bolus prior to the infusion test, when compared to the baseline (no bolus) infusion results, resulted in significant differences in over half of the quantified variables Tab. 2.
Generalized comparison of the bidirectional infusion results
During the Infusion trials, particularly those that were preceded by a venous bolus, the decrease in pressure after the peak sometimes resulted in pressures that were below the resting (baseline) levels Fig. 3. and Fig. 4. This complicated some of the planned analyses, but this complication could be eliminated, in a consistent fashion, by simply averaging the curves from the four trials. The averaging was done based on neither trial start time, not the onset of pressure increase nor time of peak pressure. Variation in these temporal features resulted in mean curves with reduced peak pressures Fig. 5. and reduced PVI values (which are determined, in part, by peak pressure). The mean curves preserved the basic pattern described above; there is a marked disparity between the source and sink infusion curves, and another disparity between the cranial and spinal sink curves.
The area under each mean infusion curve was calculated, in units of mmHg*s. During rostral infusions, when the cranial CSF was the source, the source curves had a larger area, but the sink (the spinal CSF) was comparable. This similarity held after the addition of the venous bolus, which raised the difference between the two curves, but the difference was still less than 10%. During the caudal infusion trials, where the spinal CSF served as the source, the area under the source curve was much larger than under the sink (the cranial CSF) curve Fig. 5. The differential between the areas under the spinal and cranial CSF curves during caudal infusions was increased by the addition of the venous bolus; the presence of the bolus resulted in a mmHg*s area under the spinal CSF curve that was 3.5x that of the cranial CSF.
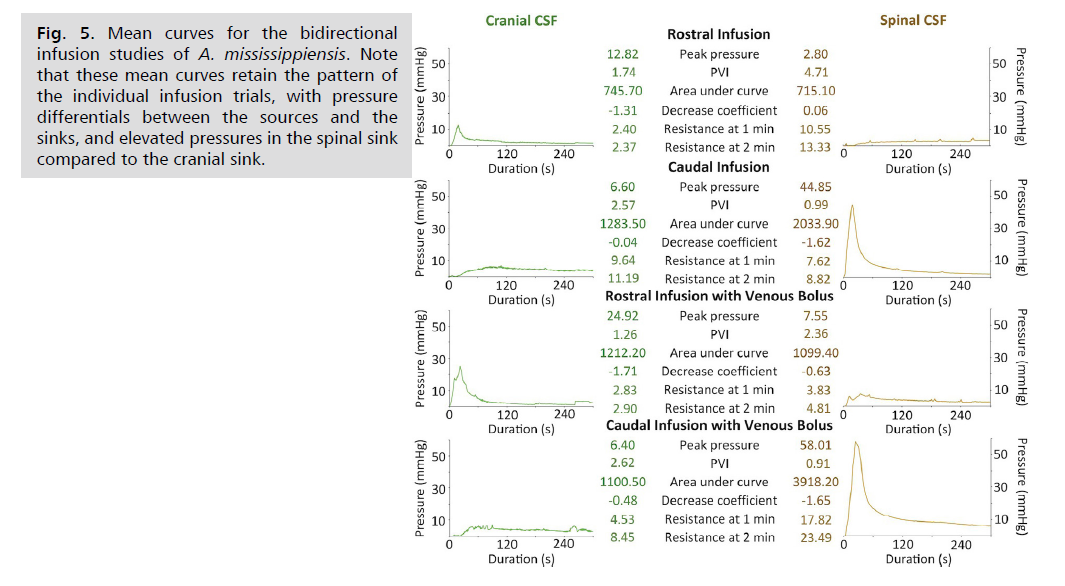
Fig. 5: Mean curves for the bidirectional
infusion studies of A. mississippiensis. Note
that these mean curves retain the pattern of
the individual infusion trials, with pressure
differentials between the sources and the
sinks, and elevated pressures in the spinal sink
compared to the cranial sink.
The mean infusion curves were also used to calculate outflow resistance, in units of mmHg/ml/min. During the rostral infusions, the sink (the spinal CSF) had greater outflow resistance than the source, though the addition of the venous bolus resulted in a marked decrease in the outflow resistance of the spinal CSF Fig. 5. During the caudal infusion without a venous bolus, the same pattern held with the source (the spinal CSF) having lower outflow resistance than the sink (the cranial CSF). The addition of the venous bolus to the caudal infusion changed the pattern; during these trials, the source (the spinal CSF) had outflow resistance levels that were more than 2x those calculated from the cranial CSF sink Fig. 5. A comparison of the pre- and post-bolus caudal infusion curves suggests that the unusual pattern in outflow resistance determined during the bolus trials results both from increasing resistance at the source and decreasing resistance at the sink.
Experimental test of hypothesis three
The moderate (rate of 8 ml/min, duration of 15 s, bolus of 2.0 ml ) and fast (rate of 10 ml/min, duration 15 s, bolus of 2.5 ml) infusion protocols yielded peak infusion pressures that were not significantly different; however, both the moderate and fast infusion protocols resulted in peak CSF pressures which were significantly (t=5.96, p=0.0003 and t=4.01, p=0.0025, respectively) higher than those produced by the slow (rate of 2.0 ml/min, duration 30 s, bolus volume 1.0 ml) infusion protocol Fig. 6.
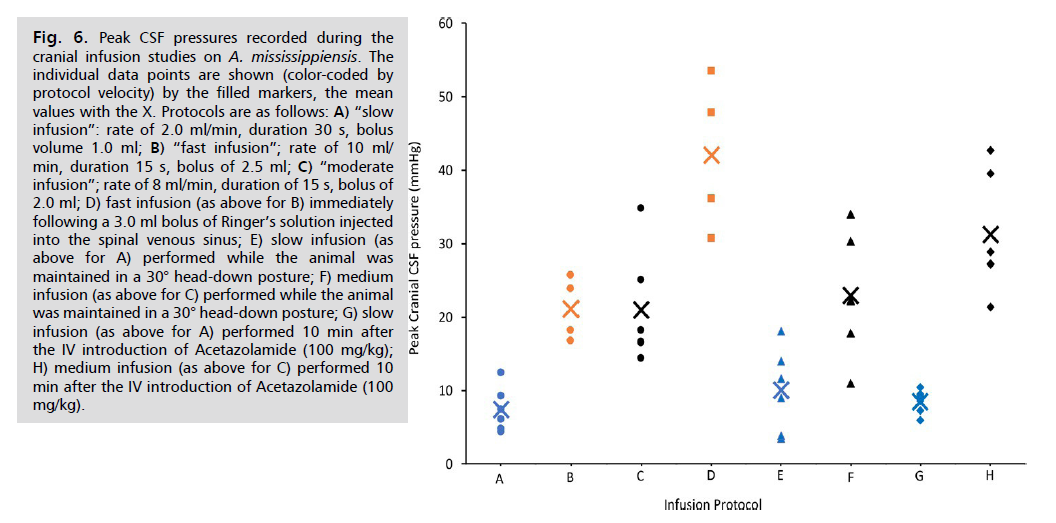
Fig. 6: Peak CSF pressures recorded during the
cranial infusion studies on A. mississippiensis. The
individual data points are shown (color-coded by
protocol velocity) by the filled markers, the mean
values with the X. Protocols are as follows: A) “slow
infusion”: rate of 2.0 ml/min, duration 30 s, bolus
volume 1.0 ml; B) “fast infusion”; rate of 10 ml/
min, duration 15 s, bolus of 2.5 ml; C) “moderate
infusion”; rate of 8 ml/min, duration of 15 s, bolus of
2.0 ml; D) fast infusion (as above for B) immediately
following a 3.0 ml bolus of Ringer’s solution injected
into the spinal venous sinus; E) slow infusion (as
above for A) performed while the animal was
maintained in a 30° head-down posture; F) medium
infusion (as above for C) performed while the animal
was maintained in a 30° head-down posture; G) slow
infusion (as above for A) performed 10 min after
the IV introduction of Acetazolamide (100 mg/kg);
H) medium infusion (as above for C) performed 10
min after the IV introduction of Acetazolamide (100
mg/kg).
The addition of a bolus of Ringer’s solution into the venous blood of the dural sinuses caused a significant (t=3.71, p=0.00499) increase in peak CSF pressure during subsequent fast protocol infusions. Increasing the venous blood within the dural sinuses by placing the animal into a head-down posture did not significantly alter the peak cranial CSF pressure during infusions performed under either the moderate or slow protocols Fig. 6. The administration of a clinically-relevant dose of Acetazolamide did not significantly increase the cranial peak CSF pressure during slow protocol infusion, but did significantly (t=2.23, p=0.025) raise peak CSF pressure during subsequent moderate protocol infusions Fig. 6.
Though significant differences were found in the peak cranial CSF pressures recorded during the different variations of infusion protocols, the same was not true for the rate of CSF pressure change Fig. 7. As expected, the rates of change all fell out according to the programming of the infusion pump; neither tilting the animal, nor the administration of Acetazolamide, had a significant impact on the rate of CSF pressure change. The addition of a bolus of Ringer’s solution immediately prior to the fast infusion did increase the rate of CSF pressure change relative to the baseline value, but this increase was not significant (t=1.99, p=0.05).
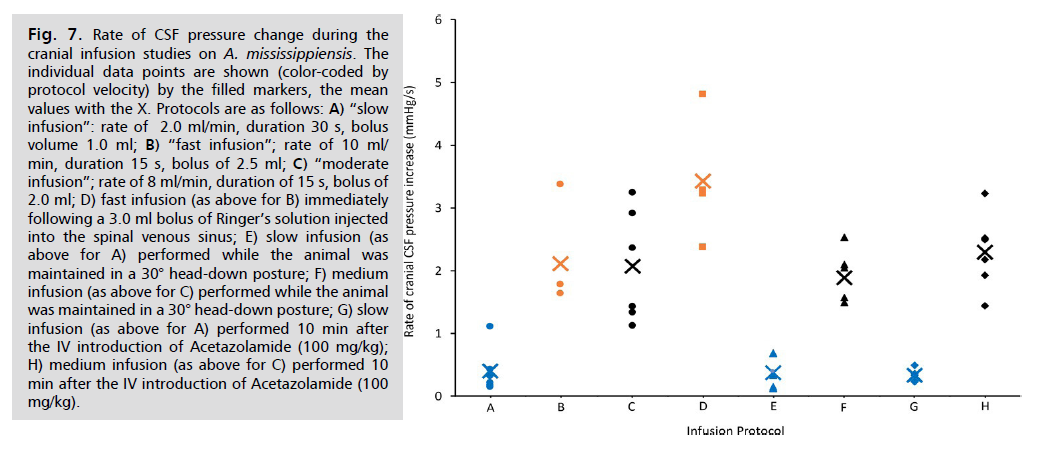
Fig. 7: Rate of CSF pressure change during the
cranial infusion studies on A. mississippiensis. The
individual data points are shown (color-coded by
protocol velocity) by the filled markers, the mean
values with the X. Protocols are as follows: A) “slow
infusion”: rate of 2.0 ml/min, duration 30 s, bolus
volume 1.0 ml; B) “fast infusion”; rate of 10 ml/
min, duration 15 s, bolus of 2.5 ml; C) “moderate
infusion”; rate of 8 ml/min, duration of 15 s, bolus of
2.0 ml; D) fast infusion (as above for B) immediately
following a 3.0 ml bolus of Ringer’s solution injected
into the spinal venous sinus; E) slow infusion (as
above for A) performed while the animal was
maintained in a 30° head-down posture; F) medium
infusion (as above for C) performed while the animal
was maintained in a 30° head-down posture; G) slow
infusion (as above for A) performed 10 min after
the IV introduction of Acetazolamide (100 mg/kg);
H) medium infusion (as above for C) performed 10
min after the IV introduction of Acetazolamide (100
mg/kg).
When Compliance (as PVI) was calculated from this infusion data set, rather consistent results were obtained Fig. 8. The pooled cranial compliance was found to have a mean of 1.16, with a standard deviation of 0.23.

Fig. 8: Cranial compliance, as measured by Pressure
Velocity Index or PVI, during infusion studies on A. mississippiensis. The individual data points are
shown by the filled markers (color coded as indicated
on the Y axis), the mean values with the X.
When the cranial CSF pressure curves are examined from different infusion protocols. Fig. 9. two interesting features can be seen. Firstly, during slow infusions (bottom trace, Fig. 9. the intrinsic cardiac and ventilatory pulsations within the CSF are not lost, even with pressure increases of over 5 mmHg. In contrast, during the higher rates of infusion (both moderate and fast protocols) the pulsations are lost as soon as the infusion begins (top trace, Fig. 9); when the CSF pressure drops below 10 mmHg the pulsations return, but often showing a gradual increase in amplitude with decreasing pressure. The second interesting feature can be seen by comparing the baseline pre-infusion trace (Inset A in Fig. 9.) with the transitory elevated portion of the pressure trace that occurs after the initial drop in CSF pressure (Inset B in Fig. 9. During the later portions of the infusion trials, after the peak CSF pressure has decreased, there is tachycardia equal to about a 20% increase in heart rate. The size of the ventilatory pulsations in the CSF shows, at most, only a modest increase after the infusion-induced CSF peak pressure. In contrast, the cardiac pulsations within the CSF pressure have a linear relationship between increasing pulse amplitude and increasing CSF pressure Fig. 10.
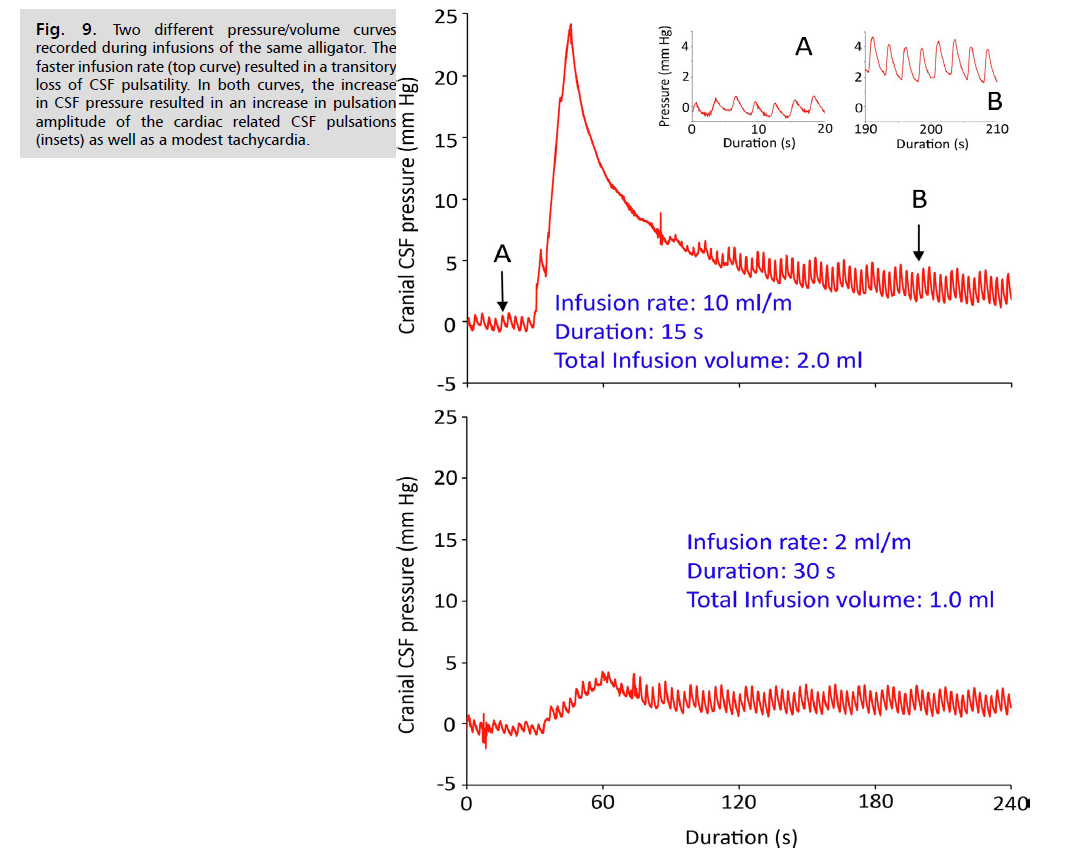
Fig. 9: Two different pressure/volume curves
recorded during infusions of the same alligator. The
faster infusion rate (top curve) resulted in a transitory
loss of CSF pulsatility. In both curves, the increase
in CSF pressure resulted in an increase in pulsation
amplitude of the cardiac related CSF pulsations
(insets) as well as a modest tachycardia.
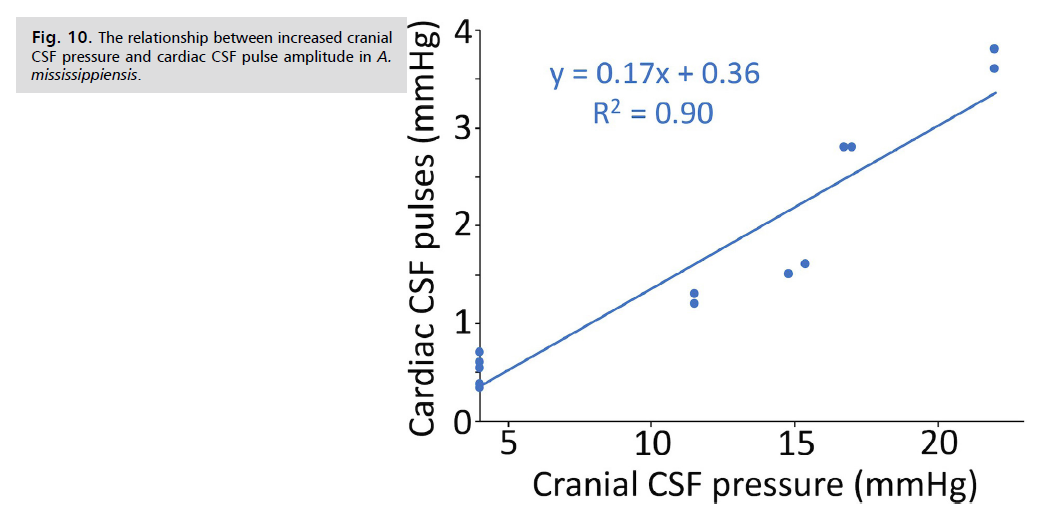
Fig. 10: The relationship between increased cranial
CSF pressure and cardiac CSF pulse amplitude in A. mississippiensis.
Discussion
This study was performed to test three hypotheses:
• That the compliance of the cranial and spinal compartments of mississippiensis is low and relatively balanced or “symmetric,” resulting in similar metrics of compliance and pressure/volume curves.
• That the main cause for the balance in compartmental compliance is the presence of a large spinal venous sinus.
• That infusion studies could be used to study aspects of the dynamics of the CSF in non-mammalian vertebrates.
Infusions studies are a well-established clinical tool, in which a quantity of artificial CSF (aCSF) is added to the existing CSF and the ensuing pressure changes tracked. The infusion study can be performed following one of several methodologies [8] including the bolus protocol used in the present study; comparative analyses have suggested that the different methodologies yield generally similar results [28]. Ultimately, the infusion study provides information about compliance within the cranial (most common) or spinal compartments. Changes in compliance reflect underlying changes in the dynamic balance between CSF pressure, cranial perfusion, and venous pressure in the brain and dura [29]. Clinically, infusion studies are most commonly performed on patients with (among other conditions) hydrocephalus, traumatic brain injury, and subarachnoid hemorrhage to inform decisions regarding shunting of the CSF to reduce intracranial pressure [30].
The present work appears to be the first infusion study performed on a non-mammalian vertebrate. Despite the smaller volume of the cranial compartment in A. mississippiensis (compared to mammals with a similar body size), and the differences in the meninges [19] and cranial vasculature [31], the infusion studies performed on Alligator yielded rather "typical" results. The three infusion protocols performed yielded similar compliance values (as measured by PVI, Fig. 8. the magnitude of which are similar to, but slightly lower than, values typically reported from bolus infusion of humans [7], likely reflecting the volumetric differences in the cranial compartments. The slopes of the pressure/volume curves Fig. 7. obtained during the infusion of Alligator, reflected the varied settings on the infusion pump, and were not significantly changed by posture or Acetazolamide; however, as in humans, the peak CSF pressures Fig. 8. proved more variable [32-34].
As in human studies Eide, et al. [33], the size of the infusion bolus influenced the shape of the resulting pressure/volume curve, the higher bolus volumes caused a loss of CSF pulsatility which was recovered as the pressure decreased Fig. 9. The infusion studies of Alligator consistently produced an increase in CSF cardiac-related pulsatility with increasing CSF pressure Fig. 9. and Fig. 10. this relationship, sometimes referred to as "Marmarou's Law" is regularly found during human infusion studies Czosnyka, et al. [29], Eide, et al. [33] and Qvarlander, et al. [34]. Furthermore, experimental studies have demonstrated the “Bainbridge effect,” in which an intravenous infusion results in modest tachycardia [35,36], as found in the present study Fig. 9.
This study was performed, in part, to test the hypothesis that infusion studies would yield similar metrics of compliance and pressure/volume curves when conducted in the spinal and cranial compartments of A. mississippiensis. Previous human studies have shown bolus infusion into the spinal CSF produce similar pressure changes in both the cranial and spinal compartments [13]. A similar study using sheep [14] found that bolus infusion-induced pressure changes in the spinal compartment were mirrored in the cranial compartment. Though a different technique was employed, Klarica, et al. [15] found that adding or withdrawing small volumes of spinal CSF from cats resulted in similar pressure changes in the spinal and cranial compartments. The results of the present study are markedly different. The site of infusion (the source) consistently had significantly higher CSF pressure Fig. 3 and Tab. 1. than the other compartment (the sink). The pressure differential between the source and the sink was not constant; infusion performed in the spinal compartment generated significantly greater CSF pressure than infusion performed in the cranial compartment Fig. 3 and Tab. 1. The significant differences between the pressure volume curves from the spinal and cranial compartments, despite the identical pressure catheters, transducers, and infusion protocols, is a strong challenge to the first hypothesis.
The current study measured compliance via PVI and found mean values of 1.16 and 0.98 for the cranial and spinal compartments, respectively. Previous studies have found greater differences in compliance between the cranial and spinal compartments of humans [7,37]. While the difference between the compartments compliances in Alligator is significant Tab.1. it appears to be the lowest reported differential compliance between the two compartments. This study was the first attempt to directly measure compliance in the dural system of Alligator. A previous study, using impulses on the CSF flowing through the foramen magnum [20], found the compliance differential between the two compartments was 1.38:1, compared to the 1.18:1 value determined in the present study. The direct measure of compliance in the present study supports the first hypothesis, that the cranial and spinal compartments of A. mississippiensis have functionally balanced compliance.
The third hypothesis examined in the present study was that the compliance of the dural system in Alligator, and in particular the compliance of the spinal compartment, would be significantly influenced by the spinal venous sinus. The rationale for this hypothesis is the presence of the large spinal venous sinus, which extends the length of the spinal compartment and ensheaths the spinal dura [18]. Previous experimental analysis showed that there is differential propagation of CSF pressure waves between the cranial and spinal compartments, and that much of this differential was due to changes in pressure within the spinal venous sinus [21]. The present study tested this hypothesis by comparing the results of bilateral infusion studies performed before, and immediately after, the addition of a bolus of Ringer’s solution into the spinal venous sinus. The presence of the additional fluid pressure within the spinal venous sinus amplified the effect of the infusion protocol Fig. 4. resulting in the majority of the quantified variables changing significantly Tab.2. Not surprisingly, most of the variables significantly altered by changing pressure in the spinal venous sinus were associated with the spinal compartment (Tab. 2). Accordingly, we find strong support for the hypothesis that the spinal venous sinus influences the CSF dynamics within (at least) the spinal compartment.
There were two, potentially related, unusual findings in the present study; the rapid decrease in infusion pressure and the effective lack of propagation of the perfusion pressure. A recent study of bidirectional bolus infusion in sheep [14] provides an invaluable comparative data set. When a bolus of aCSF is infused into the sheep, essentially identical CSF pressure curves are recorded from the cranial and spinal compartments [14]. In contrast, in Alligator, the CSF peak pressure at the infusion source is always significantly greater than at the sink Fig. 3 and Tab. 1; this distinction holds even when mean values are compared Fig. 5. were amplified by the addition of the venous bolus into the spinal venous sinus Fig. 4 and Tab. 2. The bolus perfusion performed on sheep [14] yielded CSF pressure spikes of approximately 28 mmHg, these spikes decreased to half their peak pressure in approximately 200 seconds. The spinal CSF pressure peaks recorded during bolus infusion of Alligator were often 2x as large as those presented by Podgorsak, et al. [14], yet they decreased to half their peak pressure in approximately 25 seconds Fig. 3. - Fig. 5. The sharp decrease in the infusion pressure curves is what makes the fitted power curves have a large negative exponent Tab.1 and Tab. 2.
Herein we hypothesize that the two unusual features of this alligator infusion study may both be due to CSF movement from the spinal subdural space to along the spinal nerves and/or nerve roots. The flow of CSF along the spinal nerves, whether due to loss at spinal arachnoid granulations or true perineural flow, has been extensively discussed [38,39] though it is not always clear if the CSF remains in the peripheral nerve sheath or is lost to the lymphatic system [40]. Previous work in mammals has claimed that up to 25% of CSF loss occurs in the spinal compartment [41] and that the rate of loss [42,43] is increased during elevated CSF pressures (as occurred during the infusions studies of Alligator). The lengthy spinal compartment of Alligator, which extends from the foramen magnum to the tip of the tail [44,45], may be particularly well-suited to rapidly dissipate localized CSF pressure spikes. If this hypothesis is correct, it would also alter the PVI and resistance values since these are calculated using volume change [46-48]. If the proposed loss of CSF pressure to the spinal nerves is supported, it would provide an explanation for the contradictory test results for the first hypothesis (the hypothesis being supported by the similar PVI values, but challenged by the differential shapes of the pressure/volume curves).
The low compliance of the cranial and spinal CSF compartments in Alligator may be particularly suited for studying clinically-relevant aspects of CSF dynamics. For example, subarachnoid hemorrhage lowers the compliance of the (typically cranial) compartment [49,50] changing the CSF dynamics [51]. In Alligator, it may be possible to replicate the key changes in the CSF dynamics observed during subarachnoid hemorrhage simply by adding a bolus of Ringer's solution to the spinal venous sinus.
Conclusion
Bolus CSF infusion studies, performed in both the cranial and spinal compartments of the American alligator (A. mississippiensis), produce similar PVI values (1.16 and 0.98, respectively) demonstrating that Alligator has balanced low compliance. Unlike earlier studies on humans and other mammals, in Alligator the infusion source has a significantly higher pressure than the infusion sink, and infusions performed in the spinal compartment yield significantly higher pressures than those performed in the cranial compartment. The differences between the cranial and spinal pressure/volume curves were significantly amplified by pressurizing the unique crocodylian spinal venous sinus, which completely surrounds the spinal dura. While infusion studies are clearly applicable to the crocodylian CSF system, in this study they resulted in the puzzling findings of balanced low compliance, coupled with significantly different pressure/volume responses that are quite unlike those previously reported from mammals. Herein it is proposed that in the spinal compartment of Alligator there is a natural loss of CSF pressure via the spinal nerves, and that this mechanism can effectively reconcile the observed CSF dynamics of the cranial and spinal compartments.
References
- Johanson CE, Duncan JA, Klinge PM, et al. Multiplicity of cerebrospinalfluid functions: New challenges in health and disease. Cerebro Fluid Res. 2008; 5:1-32.
Google Scholar, Indexed at
- Linninger AA, Tangen K, Hsu CY, et al. Cerebrospinal fluid mechanics and its coupling to cerebrovascular dynamics. Ann Rev Fluid Mech. 2016; 48(1):219-257.
Google Scholar, Crossref, Indexed at
- Dreha-Kulaczewski S, Joseph AA, Merboldt KD, et al. Inspiration is the major regulator of human CSF flow. J Neurosci. 2015; 35(6):2485-2491.
Google Scholar, Crossref, Indexed at
- Young BA, Cramberg MJ. Treadmill locomotion in the American alligator (Alligator mississippiensis) produces dynamic changes in intracranial cerebrospinal fluid pressure. Sci Rep 2022; 12(1):11826.
Google Scholar, Crossref, Indexed at
- Alperin N, Hushek SG, Lee SH, et al. MRI study of cerebral blood flow and CSF flow dynamics in an upright posture: effect of posture on the intracranial compliance and pressure. Acta Neurochir Suppl. 2005; 95:177-81.
Crossref, Indexed at
- Anile C, Bonis PD, Ficola A, et al. An experimental study on artificially induced CSF pulse waveform morphological modifcations. Neurol Res. 2011; 33:1072-82.
Google Scholar, Crossref, Indexed at
- Marmarou A, Shulman K, Lamorgese J. Compartmental analysis of compliance and outflow resistance of the cerebrospinal fluid system. J Neurosurg. 1975; 43(5):523-534.
Google Scholar, Crossref, Indexed at
- Kayis C, Aygok GA. Cerebrospinal fluid dynamics and infusion techniques. Adult Hydrocephalus. 2014.139.
Google Scholar
- Katzman R, Hussey F. A simple constant‐infusion manometric test for measurement of CSF absorption: I. Rationale and method. Neurology. 1970; 20(6):534.
Google Scholar, Crossref, Indexed at
- Kosteljanetz M. Resistance to outflow of cerebrospinal fluid determined by bolus injection technique and constant rate steady state infusion in humans. Neurosurg. 1985; 16(3):336-340.
Google Scholar, Crossref, Indexed at
- Kim EY, Park HS, Chung CK, et al. Resistance to cerebrospinal fluid outflow measured by bolus injection method in normal adults. j korean Neurosurg Soc. 2000; 29(9):1209-1214.
Google Scholar
- Andersson K, Sundström N, Mal J, et al. Effect of resting pressure on the estimate of cerebrospinal fluid outflow conductance. Fluids Barriers CNS. 2011; 8:1-6.
Google Scholar, Crossref, Indexed at
- Lenfeldt N, Koskinen LO, Bergenheim AT, et al. CSF pressure assessed by lumbar puncture agrees with intracranial pressure. Neurology. 2007; 68(2):155-158.
Google Scholar, Crossref, Indexed at
- Podgoršak A, Trimmel NE, Oertel MF, et al. Intercompartmental communication between the cerebrospinal and adjacent spaces during intrathecal infusions in an acute ovine in-vivo model. Fluids Barriers CNS. 2022; 19:1-13.
Google Scholar, Crossref, Indexed at
- Klarica M, Radoš M, Erceg G, et al. Cerebrospinal fluid micro-volume changes inside the spinal space affect intracranial pressure in different body positions of animals and phantom. Front Mol Neurosci. 2022; 15:931091.
Google Scholar, Crossref, Indexed at
- Pothiwong W, Prachammuang P, Koykol W. The subdural sinus of the freshwater crocodile (Crocodylus siamensis). Thailand J Veter Med. 2000; 30 (1):51-55.
Google Scholar, Crossref, Indexed at
- Zippel KC, Lillywhite HB, Mladinich CR. Anatomy of the crocodilian spinal vein. J Morph. 2003; 258(3):327-335.
Google Scholar, Crossref, Indexed at
- Parker S, Cramberg M, Scott A, et al. On the spinal venous sinus of Alligator mississippiensis. Anat Rec. 2024;1-13.
Google Scholar, Crossref, Indexed at
- Starck D. Cranio-cerebral relations in recent reptiles. Biol Reptilia, 1979; 9:1-38.
- English CJ, Taylor Z, Cramberg M, et al. Dynamic asymmetry in cerebrospinal fluid pressure: An indicator of regional differences in compliance. Surg Neurol Internat. 2023;14:1-11.
Google Scholar, Crossref, Indexed at
- Taylor Z, English C, Cramberg M, et al. The influence of spinal venous blood pressure on cerebrospinal fluid pressure. Nature: Sci Rep. 2023; 13 (1):20989.
Google Scholar, Crossref, Indexed at
- Barfuss D, Dantzler W. Glucose transport in isolated perfused proximal tubules of snake kidney. Am J Physiol. 1976; 231(6):1716–1728.
Google Scholar, Crossref, Indexed at
- Knoche L, Young BA, Kondrashova T. The influence of gravitational gradients on the American alligator (Alligator mississippiensis). Anat Physiol Current Res. 2019; 33(S1):615-5.
Google Scholar, Crossref
- Kondrashova T, Blanchard J, Knoche L, et al. Intracranial pressure in the American alligator (Alligator mississippiensis): reptilian meninges and orthostatic gradients. J Comp Physiol A. 2019; 206:45-54.
Google Scholar, Crossref, Indexed at
- Young BA, Adams J, Beary JM, et al. Variations in the cerebrospinal fluid dynamics of the American alligator (Alligator mississippiensis). Fluids Barriers CNS. 2021: 18;1-15.
Google Scholar, Crossref, Indexed at
- Scotton WJ, Botfield HF, Westgate CS, et al. Topiramate is more effective than acetazolamide at lowering intracranial pressure. Cephalalgia. 2019; 39(2):209-218.
Google Scholar, Crossref, Indexed at
- Lee SC, Lueck CJ. Cerebrospinal fluid pressure in adults. J Neuro-ophth. 2014; 34(3): 278-283.
Google Scholar, Crossref, Indexed at
- Sundström N, Andersson K, Marmarou A, et al. Comparison between 3 infusion methods to measure cerebrospinal fluid outflow conductance. J Neurosurg. 2010; 113(6):1294-1303.
Google Scholar, Crossref, Indexed at
- Czosnyka M, Schuhmann MU, Czosnyka ZH, et al. Cerebrospinal fluid pressure dynamics. Pediatric Hydrocephalus. 2019; 293-326.
- Kim DJ, Czosnyka Z, Kasprowicz M, et al. Continuous monitoring of the Monro-Kellie doctrine: Is it possible?. J Neurotrauma. 2012; 29(7):1354-1363.
Google Scholar, Crossref, Indexed at
- Porter WR, Sedlmayr JC, Witmer LM. Vascular patterns in the heads of crocodilians: blood vessels and sites of thermal exchange. J Anat. 2016; 229(6):800-824.
Google Scholar, Crossref
- Qvarlander S, Lundkvist B, Koskinen LD, et al. Pulsatility in CSF dynamics: pathophysiology of idiopathic normal pressure hydrocephalus. J Neurol Neurosurg Psychiatry. 2013; 84 (7):735-741.
Google Scholar, Crossref, Indexed at
- Eide PK, Brean A. Cerebrospinal fluid pulse pressure amplitude during lumbar infusion in idiopathic normal pressure hydrocephalus can predict response to shunting. Cerebro Fluid Res 2010; 7:1-11.
Google Scholar, Crossref, Indexed at
- Qvarlander S, Malm J, Eklund A. The pulsatility curve-the relationship between mean intracranial pressure and pulsation amplitude. Physiol Meas. 2010; 31(11): 1517-1528.
Google Scholar, Crossref, Indexed at
- Bainbridge, FA. The influence of venous filling upon the rate of the heart. J Physiol. 1915; 50(2): 65-84.
Google Scholar, Crossref, Indexed at
- Bishop VS, Lombardi F, Malliani A, et al. Reflex sympathetic tachycardia during intravenous infusions in chronic spinal cats. Am J Physiol. 1976: 230(1); 25-29.
Google Scholar, Crossref, Indexed at
- Takizawa H, Gabra-Sanders T, Miller DJ. Changes in the cerebrospinal fluid pulse wave spectrum associated with raised intracranial pressure. Neurosurgery. 1987; 20(3):355-61.
Google Scholar, Crossref, Indexed at
- Brodbelt A, Stoodley M. CSF pathways: a review. Br J Neurosurg. 2007; 21(5):510-20.
Google Scholar, Crossref, Indexed at
- Chen L, Elias G, Yostos MP, et al. Pathways of cerebrospinal fluid outflow: a deeper understanding of resorption. Neuroradiology. 2015; 57:139-47.
Google Scholar, Crossref, Indexed at
- Proulx ST. Cerebrospinal fluid outflow: a review of the historical and contemporary evidence for arachnoid villi, perineural routes, and dural lymphatics. Cell Mol Life Sci. 2021; 78(6): 2429-2457.
Google Scholar, Crossref, Indexed at
- Bozanovic–Sosic R, Mollanji R, Johnston MG. Spinal and cranial contributions to total cerebrospinal fluid transport. Am J Physiol Regul Integr Comp Physiol. 2001; 281 (3):R909-916.
Google Scholar, Crossref, Indexed at
- Davson H, Welch K, Segal MB. The physiology and pathophysiology of cerebrospinal fluid. Churchill Livingstone, New York. 1987.
- Vinje V, Eklund A, Mardal KA, et al. Intracranial pressure elevation alters CSF clearance pathways. Fluid Barriers CNS. 2020; 17:1-19.
Google Scholar, Crossref, Indexed at
- Greer S, Cramberg MJ, Young BA. Morphometrics of the spinal cord and surrounding structures in Alligator mississippiensis. Biology. 2022; 11(4):514.
Google Scholar, Crossref, Indexed at
- Greer S, Cramberg M, Young BA. Morphology of the distal tip of the spinal cord in Alligator mississippiensis. Anat Rec. 2023; 306(4): 889-904.
Google Scholar, Crossref, Indexed at
- Andersson N, Malm J, Backlund T, et al. Assessment of cerebrospinal fluid outflow conductance using constant-pressure infusion-a method with real time estimation of reliability. Physiol Meas. 2005; 26(6); 1137-1148.
Google Scholar, Crossref, Indexed at
- Shapiro K, Marmarou A, Shulman K. Characterization of clinical CSF dynamics and neural axis compliance using the pressure‐volume index: I. The normal pressure‐volume index. Ann Neurol. 1980; 7(6):508-514.
Google Scholar, Crossref, Indexed at
- Wåhlin A, Ambarki K, Birgander R, et al. Assessment of craniospinal pressure-volume indices. Amer J Neuroradiol. 2010; 31(9):1645-1650.
Google Scholar, Crossref, Indexed at
- Bhattacharjee S, Rakesh D, Ramnadha R, et al. Subarachnoid hemorrhage and hydrocephalus. Neurol India. 2021; 69:S429-33.
Google Scholar
- Eide PK, Rapoport BI, Gormley WB, et al. A dynamic nonlinear relationship between the static and pulsatile components of intracranial pressure in patients with subarachnoid hemorrhage. J Neurosurg. 2010; 112(3):616-25.
Google Scholar, Crossref, Indexed at
- Kosteljanetz M. CSF dynamics in patients with subarachnoid and/or intraventricular hemorrhage. J Neurosurg. 1984; 60(5):940-946.
Google Scholar, Crossref, Indexed at


