Keywords
Intraoperative neuromonitoring; VEP: Visual Evoked Potentials; Visual function; Electroretinography
Introduction
The ability to see confers a distinct survival advantage to organisms and the visual apparatus has evolved accordingly to adapt to evolutionary requirements. In humans, vision is subserved by a large, complex cortical and subcortical network and modulated by input from several areas of the brain. Thus visual function tends to be affected by disease processes involving cortical and subcortical structures. Identifying investigative tools or methods to better understand the physiology and pathology of the visual pathway has hence been of significant interest to the medical community. By the 1960s, Visual evoked potentials (VEPs) were identified as a neurophysiologic test that could reflect the integrity of the visual pathway. Hence it came to be used as a tool in the diagnosis of demyelinating conditions such as multiple sclerosis, and in tumors compressing the optic pathway, optic atrophy, amblyopia and stroke) [1,2].
However it was not until the late 1970s that VEPs came to be used intraoperatively for monitoring surgeries involving the visual pathways. The goal was to use VEPs as a marker for visual function during orbital, trans-sphenoidal, parasellar, cortical (parietal, temporal and occipital) and endoscopic surgeries. Nevertheless, several studies [3-7], have found that obtaining robust and reproducible waveforms during surgery is difficult, thus making VEPs unreliable for monitoring visual function. Some studies in the recent past, on the other hand, have reported more reliable techniques for recording VEPs [8-10]. Despite this apparent improvement, the need for reliable monitoring of the visual pathway during surgeries involving structures in or closer to the visual pathway remains unmet. Over the last 15 years, there have been an alarming number of reports of significant postoperative visual loss following long duration spine surgeries, particularly those in prone position and associated with significant blood loss. The most likely mechanism is considered posterior ischemic optic neuropathy due to infarction of the intraorbital portion of the optic nerve [11-15]. Thus, even though not directly involving visual pathways, such high-risk surgeries may also benefit from VEP monitoring.
In this literature review, we describe the various techniques used to record VEPs intraoperatively, and explore why VEPs failed to be as promising a tool as other evoked potentials. We start with a brief history of VEPs and the anatomy of visual pathways. Then we look at the techniques employed in obtaining VEPs intraoperatively, their advantages and limitations. We conclude with suggestions at improving the methodology for recording intraoperative VEPs.
History
Recording evoked potentials relies on the fact that stimulation of sense organs (vision and hearing) or peripheral nerves (vibration and pain) evokes an electrical response in the corresponding cortical receptive areas and subcortical relay stations [1,16]. One of the first recordings of potentials evoked by visual stimuli, date back to 1934 when Adrian and Mathews [17] recorded rhythmic potentials as high as 25/second using scalp electrodes, while exposing the eyes to flickering light. They noted that in order to produce the response, the flicker must involve a considerable part of the visual field and that if the flicker was limited to the central part of the field, the potential changes were very small and irregular. Since the potentials generated are small (only a few microvolts), Dawson in 1954 [18] introduced an averaging method to improve the signal to noise ratio. His method involved saving a defined time period of EEG activity following a visual stimulus, which when repeated several times and added together, averages away the random EEG activity as well as artifact, leaving the time-locked visual evoked potential intact. Following this, Copenhaver and Beinhocker in 1963 [19] devised a method to record focal visual stimulation using a computer specifically designed for that purpose. Although, visual evoked responses to brief flashes of light (a.k.a flash VEPs) had become popular in the 1960s, there were limitations. Flash VEPs showed high variability and could not be quantified. To minimize the effect of such variability, thought to be partially related to dispersion of light within the eye and to improve patient co-operation, Regan and Heron [20] described a new objective technique in 1969, i.e., Pattern visual evoked potentials. Pattern VEPs have since been widely used in clinical medicine to assess visual function (and thus indirectly the integrity of the visual system) in awake patients who are able to maintain attention and focus on the presented visual stimulus, while flash VEPs remain a useful tool in children and ICU patients.
Anatomy of visual pathway
Light travels through the inner layers of the retina before it reaches the photoreceptor cells (rods and cones). From the photoreceptor cells, the visual pathway consists of a three neuron chain (Bipolar cells, retinal ganglion cells and lateral geniculate nucleus of the thalamus) that processes visual information and conveys it to the cortex [21]. Bipolar cells form the first step of a parallel processing system, responding to the rapid changes in light. The optic nerve, comprising of the axons of the ganglion cells, travels through an intracranial portion (25 mm), intracanalicular and again intracranial (18-20 mm), before it converges at the optic chiasm [22]. The optic chiasm lies above the sella turcica, cavernous sinus and pituitary gland. Above it is the hypothalamus and behind, the infundibulum. At the chiasm, the nasal fibers of each eye decussate and join the temporal fibers of the opposite eye to form the optic tract (Figure 1). Therefore each optic tract contains information from the contralateral visual field. For example, the right optic tract carries information that originated in the left half of the visual field of both eyes. The fibers of the optic tract synapse in the Lateral geniculate nucleus (LGN) of the thalamus. From the LGN, axons project to the primary visual cortex (Brodmann’s area 17) via the optic radiations. Fibers with information from the lower visual field travel to the upper portion of the calcarine sulcus and fibers with information from the upper visual field loop around the inferior horn of the lateral ventricle (Meyer’s loop) and travel to the lower portion of the calcarine sulcus. Fibers with information from the fovea project directly to the calcarine sulcus. The visual association cortex (areas 18 and 19) is responsible for recognition of objects and perception of color [23].
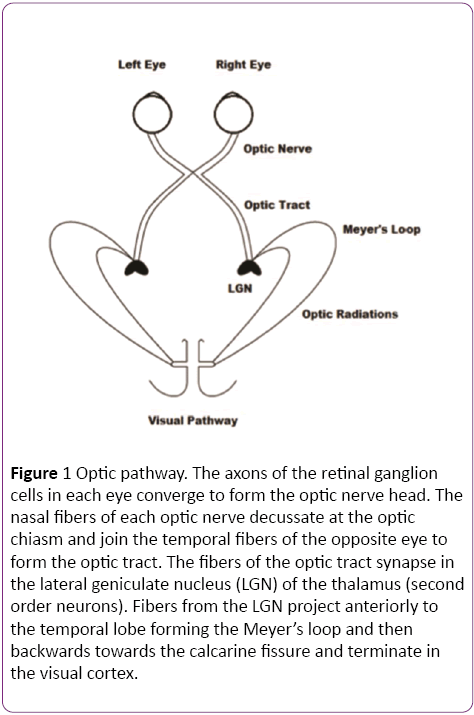
Figure 1: Optic pathway. The axons of the retinal ganglion cells in each eye converge to form the optic nerve head. The nasal fibers of each optic nerve decussate at the optic chiasm and join the temporal fibers of the opposite eye to form the optic tract. The fibers of the optic tract synapse in the lateral geniculate nucleus (LGN) of the thalamus (second order neurons). Fibers from the LGN project anteriorly to the temporal lobe forming the Meyer’s loop and then backwards towards the calcarine fissure and terminate in the visual cortex.
Recording VEPs
In a clinical setting, the pattern reversal stimulus is preferred over flash, as the responses produced by the former are easier to detect and measure than the latter and the evoked waveform is more consistent from one individual to another [1]. The subject is seated comfortably in a quiet dark room approximately 70 cm away from the stimulus. A high contrast black and white computer generated checkerboard pattern stimulus is routinely used for clinical testing. The pattern reverses 4 times per sec or less. A fixation point is provided which is distinct from the stimulation field. The location of this point determines the region of the visual field tested. In Figure 2, the fixation point (red dot) is located right in the center of the checkerboard pattern indicating a full-field stimulus. Standard disk EEG electrodes are used for recording VEPs. The Queen square system or the 10-20 International System (Figure 3) can be used for electrode placement. The band pass frequency is set at 1-100 Hz and each waveform is analyzed for 250 msec [24].
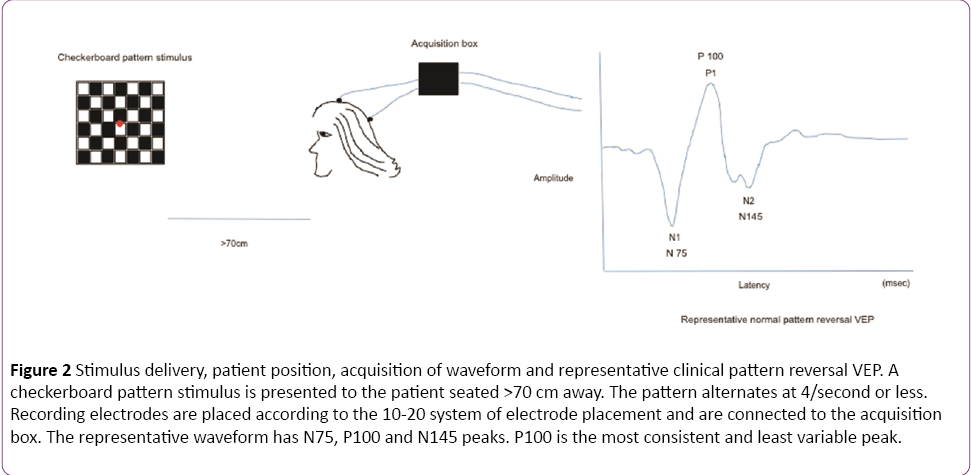
Figure 2: Stimulus delivery, patient position, acquisition of waveform and representative clinical pattern reversal VEP. A checkerboard pattern stimulus is presented to the patient seated >70 cm away. The pattern alternates at 4/second or less. Recording electrodes are placed according to the 10-20 system of electrode placement and are connected to the acquisition box. The representative waveform has N75, P100 and N145 peaks. P100 is the most consistent and least variable peak.
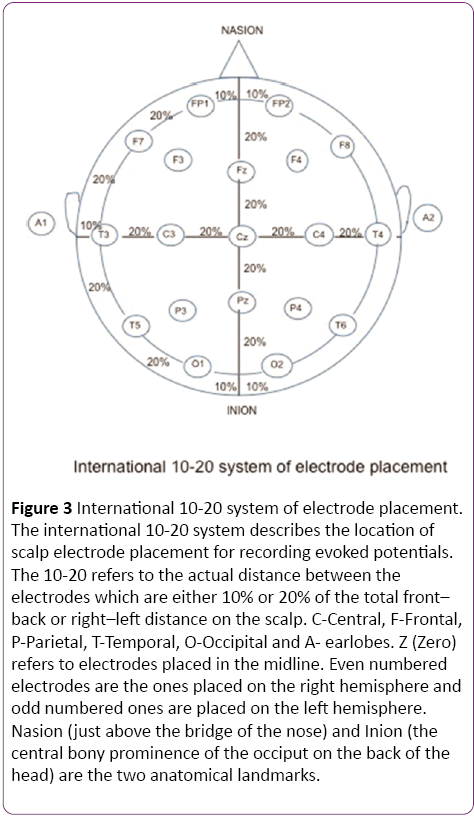
Figure 3: International 10-20 system of electrode placement. The international 10-20 system describes the location of scalp electrode placement for recording evoked potentials. The 10-20 refers to the actual distance between the electrodes which are either 10% or 20% of the total front– back or right–left distance on the scalp. C-Central, F-Frontal, P-Parietal, T-Temporal, O-Occipital and A- earlobes. Z (Zero) refers to electrodes placed in the midline. Even numbered electrodes are the ones placed on the right hemisphere and odd numbered ones are placed on the left hemisphere. Nasion (just above the bridge of the nose) and Inion (the central bony prominence of the occiput on the back of the head) are the two anatomical landmarks.
Waves recorded from the occipital region include N75, P100 and N145, of which the P100 (positive waveform at 100 msec) is the most consistent and least variable peak. The neural generators of these waveforms are not clearly defined but the consensus is that visual cortex is the source of the first negative peak at 70-75 milliseconds (N75) [25]. The positive peak at 95-110 milliseconds (P100) is generated in the dorsal extrastriate cortex of the middle occipital gyrus. The late negative peak at 145-150 milliseconds (N145) is generated from several areas including a deep source in the parietal lobe [26]. Any significant (as defined by each laboratory normative data) prolongation in the P100 absolute latency and/or in the inter-eye P100 latency difference signifies involvement of one optic nerve. Bilateral prolongation of latencies, demonstrated by separate stimulation of each eye, can be due to lesions in both optic nerves, the optic chiasm or the visual pathway posterior to the chiasm [1].
While the use of a checkerboard pattern to elicit VEP is suitable in an awake, alert and attentive patient, in anesthetized patients in the operating room, flash VEP is commonly used for neuromonitoring.
Although challenging, successful recording of flash and pattern reversal VEPs have been reported in the pediatric population. A reliable VEP waveform can be recorded as early as 24 weeks of gestation using a flash stimulus and at 33 weeks using pattern reversal [27]. However, due to maturational changes, the latency and amplitude of the waveform elicited by a pattern–shift stimulus become similar to that of the adult waveform, only when the child is about 4-5 years of age [27].
Intraoperative use of VEPs
The reliable use of visual evoked potentials (VEPs) to diagnose demyelinating and other conditions clinically, suggested that monitoring these potentials during neurosurgical procedures involving the visual pathways could serve as a valuable tool to help guide the surgeon during the procedure and preserve postoperative visual function [28,29]. However, since the 1970s several authors who monitored VEPs intraoperatively reported significant difficulties in reliably monitoring them. The methodology, technical parameters and the type of anesthesia used in these studies are summarized in Table 1.
| Author |
Device |
N |
Recording Electrode |
Anesthesia |
Flash Frequency (Hz) |
Bandpass Filter (Hz) |
ERG |
Result |
| Cedzich et al. -1987 |
Red LED |
35 |
Oz-Fz |
Inhalational |
1.9 |
5-100 |
No |
|
| |
| Cedzich et al. -1988 |
Red LED |
45 |
Oz-Fz |
Inhalational |
1.9 |
5-100 |
No |
VEP recordable, but no correlation between intraoperative findings and post-operative visual function |
| |
| Raudzens -1982 |
Flash Red LED on opaque eye patch |
71 |
Oz-Fz, Ground A1 |
- |
1.8-2.4 for 3 msec |
30-Jan |
No |
|
| |
| Chacko et al. -1996 |
Red LED |
36 |
Oz-Fz |
Inhalational |
1.9 |
5-100 |
No |
30.8% improvement in the visual field defect in the monitored group compared to 18.4% in the controls. No correlation between intraoperative findings and postoperative visual function |
| Harding et al. -1990 |
Stroboscopic flash light over dilated pupils |
57 |
Oz-Fz |
Inhalational |
1.6 |
30-Jan |
No |
Loss of VEP >4 min cause post-operative decrease in visual function (Visual Acuity) |
| Wiedemayer et al. (2003) |
Red LED |
32 |
Oz-Fz, Oz- A1/A2 |
TIVA |
1.5 |
Feb-30 |
No |
|
| Pre-operative high inter-individual variability. No stable recording. |
| Wiedemayer et al. (2004) |
Red LED |
30 |
Oz-Fz, Oz- A1/A2 |
TIVA |
8.5 |
Feb-30 |
No |
|
| Chung et al. -2012 |
Red LED avg Luminosity 2000 Lx, for max 4 sec. |
65 |
Oz, LO, RO, Cz ref to A1,A2 |
TIVA |
1 for 20msec |
- |
No |
VEP recordable, but no correlation between intraoperative findings and post operative visual function |
| Kodama et al. -2010 |
Thin curved goggles with 15 red light emitting diodes |
53 |
ERG, A1,A2, Lt,LO, Rt, RO, Oz |
TIVA |
1 for 40msec |
10-1000 |
Yes |
103/106 (97%) VEP recorded. Intraoperative VEP correlate with post op visual function. |
| Sasaki et al. (2010) |
16 red high luminosity LEDs (100 mCd) embedded in a soft round silicone disc |
100 |
ERG, 4cm above and lateral to inion |
TIVA |
1 for 20msec |
20-500 |
Yes |
93.5% reproducibility of the waveforms. 2 false negatives (no intraoperative VEP change with impaired postoperative visual function). All other intraoperative findings correlate with post op visual function. |
| Kamio et al. (2014) |
16 red high luminosity LEDs (100 mCd) embedded in a soft round silicone disc |
33 |
ERG, 4cm above and lateral to inion |
TIVA |
1 for 20msec |
20-500 |
Yes |
28/33 (84.8%) had stable intraoperative VEP recording. In 4/28 cases, VEP amplitude decreased transiently, and 1/28 cases VEP amplitude did not recover. |
| Luo et al. (2015) |
19 Red light emitting diodes with illuminance set to 20000 Lux |
46 |
A1, A2, O1, O2, Oz, Cz, Fz. A1 and A2 were linked and served as recording reference. |
TIVA |
For 1st 36 patients 1.1 Hz for 40 ms, and next 10, 1.1 Hz for 10 ms |
5-100 |
No |
In 62 eyes with normal pre-operative vision, VEP was recorded. Out of the 62 eyes, there were 3 false negatives and 2 false positives. |
| N:Number of patients. LED: Light Emitting Diode; ERG: Electroretinography; TIVA: Total Intravenous Anesthesia; LO: Left Occiput; RO: Right Occiput; Electrodes Oz, Fz, Cz, A1, A2 correspond to the International 10-20 system. |
Table 1: Summary of anesthesia, technical parameters and results of studies which used intraoperative flash visual evoked potential (VEP).
Initially, there were a few case reports [30-32], showing that flash VEPs can be reliably monitored. In these instances, the flash stimulus was transmitted through goggles placed over closed eyes. However, in 1987 Cedzich et al. [3] monitored intraoperative VEPs in 35 patients undergoing surgery under inhalational anesthesia, for tumors along the visual pathway and concluded that intraoperative flash VEPs were not a reliable indicator of postoperative visual function. Their results demonstrated 20 false positive and 2 false negative outcomes, diminishing the possibility of a meaningful correlation between intraoperative findings and postoperative visual function. In order to better understand the factors influencing intraoperative VEP monitoring, Cedzich et al. conducted another study [4], where they divided their patients into 3 groups. The first group had 25 patients with perisellar tumors and impairment of visual function; the second group had 10 patients with normal visual function undergoing craniotomy but surgery not close to the visual pathway and the third control group had 10 patients undergoing non-cranial surgery. The intraoperative VEP amplitude was significantly decreased in all groups along with a complete loss of potential in the first 2 groups (21/25 in group 1 and 3/10 patients in group 2), while no loss of potential was seen in the third (non-cranial surgery) group. The high variability of VEPs in the first group was deemed due to the combined effect of anesthesia, surgical maneuvers (trepanation, transnasal dissection) and preexisting compression of/damage to the visual pathway. Changes were observed in all groups and were too non-specific to provide further useful information to improve the methodology of recording VEP and its reliability. In 1990, Harding et al. [8] monitored the optic nerve under inhalational anesthesia in 57 patients undergoing intraorbital surgeries. They concluded that intraoperative flash VEPs is a reliable marker for postoperative visual function and that a loss of VEPs for more than 4 minutes resulted in a postoperative decrease in visual acuity. A few years later, Chacko et al. [33] monitored VEPs in 22 patients undergoing transphenoidal pituitary surgeries and 14 control patients undergoing surgery with no VEP monitoring. They used inhalational anesthesia and monitoring parameters (stimulus rate, bandpass frequency, and the type of recording electrode) similar to the Cedzich et al. [3] study. Despite encountering 12 false positive cases (intraoperative loss of VEP with no postoperative deficits), the postoperative visual field deficits were lesser in the monitored group compared to the group with no monitoring, which led them to suggest that it is beneficial to monitor VEPs intraoperatively.
Total intravenous anesthesia (TIVA) was used for intraoperative VEP monitoring several years later. Conflicting reports about the usefulness of VEPs led Wiedemayer et al. [5] to monitor VEPs under TIVA in 32 patients with normal vision and undergoing non cranial surgeries. They obtained reproducible flash VEPs preoperatively in all patients, albeit with high inter-individual variability of P100 latency and P100- N145 amplitude. However VEPs recorded intraoperatively showed marked attenuation in amplitude and in majority of patients, no reliable VEP recordings could be obtained. The same group in 2004 [6], used steady state VEP (the flash stimulus was projected at a frequency of 8.5 Hz) to monitor a group of 30 patients undergoing non cranial surgeries. They observed that the waveforms obtained through steady state stimulation were slightly more stable and required lesser acquisition time than transient stimulation, but still exhibited high inter-individual variability in latency and amplitude both in awake and anesthetized patients. In majority of patients (23/30), a recognizable steady state VEP was present in less than 75% of the intraoperative traces.
The apparent improvement in recording VEPs intraoperatively when switching from inhalational anesthesia to TIVA, led investigators to examine the role of other anesthetic agents. Among these, Dexmedetomidine as an adjunct to TIVA was studied by Rozet et al. in 2015 [34]. They determined that if baseline VEP can be obtained in a patient, then Dexmedetomidine does not interfere with the acquisition of intraoperative VEP. Over the years, it became clear that compared to inhalational anesthetics; TIVA improved the chances of recording intraoperative VEP reliably. Nevertheless, the low sensitivity, specificity and lack of a meaningful postoperative correlation with visual function [7], continued to preclude the routine use of intraoperative VEPs.
It was not until 2010, that two groups from Japan [9,10], reported obtaining reliable evoked potentials throughout surgery and being able to correlate their intraoperative findings with postoperative visual function.
Sasaki and his team [10] considered the possibility that intraoperatively the axis of the light stimulus falling on the retina deviated over time, especially following surgical maneuvers such as frontal scalp reflection. This was attributed to the inflexibility of the hard disc bearing the stimulating LEDs. To address these issues, they monitored VEPs in 100 patients under TIVA with the following improvements. Electroretinography (ERG) was used to ensure that the light stimulating device was indeed stimulating the retina. This helped them determine whether a loss of intraoperative VEPs was due to inadequate retinal stimulation. In addition, they used 16 high-luminosity red LEDs embedded in a soft, round silicone disc to avoid deviation of the light axis during frontal scalp-flap reflection. They stimulated at a frequency of 1 Hz for 20 msec and placed the recording electrodes 4 cm above and lateral to the inion. Their results were compelling because they obtained reproducible VEP waveforms in 93.5% (187/200 eyes) of the monitored patients. Of the 13 eyes (13/200) in which VEP could not be obtained, ERG was stable in 12, demonstrating that the light was falling on the retina. All these patients had severe preoperative visual deficits. In the remaining eye (1/13), ERG and VEP disappeared after frontal scalp deflection suggesting that the loss of VEP was not related to a deficit in the visual pathway but because light was not falling on the retina. Among the 187 eyes in which intraoperative VEP was reliably recorded, 16 developed postoperative visual deficits. 14 of them had a 50% decrease in the VEP amplitude. These changes were observed during surgical dissection of the optic nerve/optic tract, ischemia of the optic nerve, removal of temporal tumor or removal of occipital AVM’s. The amplitudes did not recover, despite halting the surgical maneuvers and these patients developed postoperative visual deficits. The other 2 cases (2/16) were false negative; i.e., postoperative visual deficits occurred despite obtaining reliable waveforms. Their visual deficits were mild (similar to quadrantanopia), compared to the 14 who had varying degrees of postoperative visual deficits. The remaining 171/187 eyes had no change or improved postoperative visual function.
The other team from Japan [9] monitored VEP in 53 patients who were undergoing intracranial surgeries under TIVA. They used thin curved goggles with 15 red LEDs embedded in them to stimulate the visual pathway at a frequency of 1 Hz (duration 40 msec). The intensity of light in the goggles could be adjusted from 0 to 175 mCd. For each patient, the minimal stimulation intensity that elicited maximal VEPs amplitude was determined initially and stimulation was stably maintained using these goggles during surgery. Reproducible VEPs waveforms were obtained in 97% (103/106 eyes) patients. In the 3 eyes with non-recordable VEP’s one had poor visual acuity and Sevoflurane was used for anesthesia in the other 2 eyes. Of the 103 eyes with recordable intraoperative VEPs, 93 with unchanged VEP amplitudes and 3 with a transient decrease in VEP amplitudes had no change in postoperative visual function, while 7 eyes with a decrease in VEP amplitude which was not restored, had postoperative visual deficits.
Using the same LED stimulating device and recording parameters as Sasaki and colleagues, Kamio et al. [35] recorded stable intraoperative VEP along with ERG in 28/33 patients undergoing transsphenoidal surgery, thus establishing the feasibility of intraoperative VEP monitoring in these cases. The patients in whom they were unable to record VEP had either a pre-operative visual deficit or a technical issue with intraoperative recording. While patients with transient decrease in intraoperative VEP amplitude retained normal visual function post-operatively, in the sole patient in whom VEP was lost, a post-operative visual deficit ensued.
In a retrospective analysis of 46 intracranial surgeries, Luo et al. [36] recently addressed the reliability of VEP recording and how well it predicts post-operative visual function. Using two types of stimulus delivery systems, one form Unique Medical Company, Ltd, Tokyo [9] and the other from Inomed (www.inomed.com), they were able to successfully record VEPs in all eyes with no pre-operative visual dysfunction (62/85 eyes). However, out of these 62 recordings, a false positive change, i.e., a transient decrease or loss of intraoperative VEP without a post-operative loss of visual function, was seen in 12 eyes (~19%), while a false negative change wherein the VEP remained stable intraoperatively but patients had post-operative visual deficits, was seen in 6 eyes (~10%).
Optimizing the stimulus delivery system seemed to address the problem only partly and more recently, several groups have started studying other factors. Sato et al. [37] decided to address how stimulus parameters – viz., the light emission time and the quantity of light, affect the reliability of VEP. He recorded intraoperative VEP from 26 patients undergoing brain surgery for conditions that were not expected to involve visual changes during surgery. None of the patients had preoperative visual dysfunction. A silicone stimulation device with an embedded diode for the light stimulus was used and the maximum amount of light was set at 20,000 Lx. The stimulus frequency was 1 Hz. Evoked potentials were recorded from seven occipital electrodes. They separated the evoked response into two – the “on” response (at the start of light emission) and the “off” response (response derived from the end of light emission). Following this, they systematically changed the light emission time and also its intensity separately to study the off response. The study concluded that the optimal parameters for effective monitoring were an intensity of 8000 LX with an emission time of 500 ms.
Houlden and colleagues [38] were the first to assess the effect of high amplitude EEG on the reproducibility of flash VEP. They recognized that most studies recording intraoperative VEPs used the same filter settings as used in clinical VEP recording. This allowed high amplitude EEG containing a predominant alpha frequency (8–12 Hz) that is seen during general anesthesia, to decrease the FVEP signal to noise ratio. This is especially true, because the noise created by EEG may be up to 120 μV while the FVEP amplitude is often less than 5 μV during surgery. In addition, they found that the amplification blocking seen after electrocautery contributed to further reducing the reproducibility of FVEP, as these flat sweeps were often included in the overall averages used to generate the FVEP response. Although increasing the lower cut off frequency seemed appealing (as they would get rid of EEG alpha), they found that finding an optimal low filter setting was difficult, as when the cut off was increased from 10 Hz to 30 Hz, the N1/P1 amplitude of the response decreased by about 40%. Hence a low cut off of 10-15 Hz was suggested.
Other intra-operative techniques
Cortical activity can be recorded at much higher spatial resolution and signal intensity using cortical recording electrodes than scalp electrodes. Ota et al. [39] used cortical electrodes for monitoring VEP in 17 patients undergoing posterior craniotomy for resection of epileptic foci. Reproducible waveforms were detected in 82% (14/17) of patients. While visual function did not change post-operatively in patients with stable intra-operative VEPs, two patients in whom VEPs were lost intraoperatively had post-operative hemianopia. The authors concluded that intraoperative changes in VEPs (decrease in amplitude) correlated with postoperative visual field impairment.
Albright and Sclabasssi [40] did a case study on two children undergoing surgery for chiasmal gliomas and used flashing strobe light to monitor VEP. They reported that VEP obtained from strobe light was more stable than from LED and that their intraoperative VEP findings correlated with the postoperative visual function. In two patients undergoing surgical resection of epileptic foci in the occipital lobe, Curatolo et al. [41] used flashing strobe light to record VEPs and photic driving using intracranial electrodes. The authors were able to successfully use a strobe light and record intraoperative photic responses in both patients, supporting the findings seen in the Albright and Sclabassi study.
Diffusion tensor imaging based tractography [42,43] of the optic radiations can be a valuable imaging tool when used in conjunction with intraoperative VEPs. Kamada et al. [44] monitored intraoperative VEPs in two patients undergoing surgery for intractable epilepsy and high grade gliomas respectively. In both, DTI-tractography of the optic radiations was performed and integrated with the neuronavigation system intraoperatively. In the second patient where the tumor was compressing the optic radiations, the VEPs were lost during resection and with the neuronavigation system they were able to confirm that the resection was close to the optic radiations potentially damaging it. The patient had a left hemianopia after surgery confirming that intraoperative VEP findings correlate with postoperative visual deficits. The first patient had stable VEPs intraoperatively and had no postoperative deficits. These findings are encouraging and prompt the regular use of neuronavigation along with intraoperative VEPs. However, DTI can only map the postthalamic optic radiations accurately. The optic pathway before the thalamus cannot be mapped due to EPI-related susceptibility artifact [43].
Direct electrical stimulation of cranial nerves like Trigeminal, Facial, Vestibulocochlear and peripheral nerves have been used for intraoperative monitoring, producing reliable results [45]. Kikuchi et al. [46] studied direct electrical stimulation of the optic nerve. They first performed an experimental study in dogs to investigate the origin of the optic nerve evoked potential (ONEP) and the effect of stepwise incremental transection of the optic nerve (ON). They then performed a clinical study and recorded ONEP in patients undergoing craniotomy for lesions near the ON. 20 mongrel dogs were used for the experimental study. Under TIVA, their ON was exposed. Two silver ball stimulating electrodes were placed on the ON adjacent to the apex of the orbit. Another silver ball recording electrode was placed on the ON near the chiasm. The distance between the stimulating and recording electrode was approximately 8 mm and a reference electrode was inserted at the C1 level. The stimulation intensity was increased from 0.1-10 mA, each stimulation lasting for 50 microseconds at a frequency of 2 Hz. Stimulation at 5-9mA elicited a supramaximal response. The obtained ONEP peaks were designated P1, N1 and P2. Stable and reproducible ONEPs were obtained in all dogs. The peak latencies were <1 msec. Since P1-N1 amplitudes fluctuated due to stimulus artifact, N1-P2 was measured and was found to be stable. A stepwise incremental transection of the ON resulted in a progressive increase in latency and decrease in amplitude of the ONEP.
In their clinical study, 15 patients with parasellar tumors and cerebral aneurysms were monitored. The setup was similar to that of the experimental study, but the stimulation amplitude was between 1-7mA. Both the stimulating and recording electrodes were pre-chiasmal. Triphasic evoked potentials were recorded as in the animal study and 14 out of 15 patients showed no significant changes intraoperatively. The remaining patient had preoperative visual impairment from a tuberculum sellae meningioma and the recording was only done after tumor removal. Postoperatively he had no vision in that eye. The limitation of their study was that they could not examine the correlation between the visual function and ONEPs. Also, only a limited segment of the ON was examined. In 2008, Bosnjak and Benedicic [47] electrically stimulated the ON and recorded VEP from the scalp in 4 patients. The ON was stimulated with a rectangular current pulse between 0.2-8mA intensity, and duration 0.1-0.8 msec. They were able to get two peaks N20 and N40 with N20 corresponding to the ON and N40 to subcortical and cortical generators of the visual pathway. In 3 out of 4 patients the waveforms were stable and reproducible, except one where N40 showed a variability of 20-25% before the tumor removal and 43% after. Although electrical stimulation of ON is a safe method of providing a stable signal and real- time information on nerve conduction during surgery, only one ON was monitored. Hence in 2011, the same group monitored bilateral ON in 11 patients with central skull base tumors [48]. They used the same recording parameters as before. Cortical potentials after electrical epidural stimulation consisted of P20, N30 and a smaller P40. In general, the amplitude of P20 and N30 were significantly lower when the tumor removal was associated with ON or chiasm manipulation. When the amplitudes dropped more than 30%, the neurosurgeon was alerted and the ON manipulation was temporarily stopped until the amplitudes returned to their near-baseline levels. P20 and N30 were recorded throughout the surgery in all patients and the amplitude changes were found to be related to the manipulation of ON or the chiasm during tumor removal. No immediate postoperative visual deficits were seen in any of the patients with reversible changes in the amplitudes.
Discussion
Brainstem auditory evoked potentials, somatosensory evoked potentials and motor evoked potentials are routinely used in intraoperative neuromonitoring while VEPs are not. The purpose of our review was to look at the evolution of the intraoperative use of VEPs and in that process try to understand why VEPs, although routinely used clinically, failed to achieve the status of a reliable evoked potential for intraoperative use. Below we summarize our findings and propose how certain improvements may enhance the reliability of this tool, in the intraoperative domain. Recording reliable VEPs depends on both physiological and technical (stimulus delivery, acquisition) factors.
Physiological factors include body temperature, blood pressure and heart rate. A fall in the body temperature from 35C can result in the prolongation of P2 latency [49]. Similarly, hypotension (systolic Blood pressure< 50 mmHg) can result in a complete loss of VEP [8].
Studies have shown that intraoperative VEPs may be attenuated or difficult to obtain in patients with poor preoperative visual acuity (VA) or visual field (VF) [10,33]. Most studies [3,4,7,9,10,33] include patients with impaired visual function and some patients with normal visual function. A good proportion of these studies have used pattern VEPs [3,4], Snellen’s chart or a Humphrey field analyzer [33] to assess preand post-operative visual function, while intraoperative recording of VEPs was typically done using a flash stimulus. Using two different types of visual stimuli - pattern and flash respectively, to induce pre- and intra-operative VEPs, calls into question what the potentials evoked by each type of stimulus really represent and whether their anatomic and physiologic underpinnings ultimately determine their sensitivity and specificity. The following arguments make these questions more relevant: 1). It is possible that flash and pattern stimuli involve different sets of neurons in the visual pathway to evoke visual potentials. 2). Debate exists as to whether each type of stimulus (flash versus pattern) specifically assesses visual field or visual acuity [50]. 3). Flash VEPs are known to be insensitive to detect partial visual field defects (quadrantanopia) intraoperatively [9,10]. Taken together, the above considerations could provide some answers as to why changes in intraoperative VEPs evoked by flash stimuli may not necessarily reflect post-operative functional deficits. However, it is also not clear whether recording VEPs using both flash and pattern stimuli pre- and post-operatively will resolve this issue. At the least, this will help us to better correlate intraoperative VEP changes to post-operative function.
Reliably recording a small amplitude evoked potential that is highly variable in nature, also requires that there be an optimal balance of other factors such as anesthesia that may alter the milieu for intraoperative recording of the potential. Earlier studies that used inhalational anesthesia had little luck in reliably recording VEPs (Table 1). Harding et al. [8] reported some correlation of intraoperative VEPs loss with postoperative outcome, despite using inhalational anesthesia. Of note, this group used stroboscopic stimulation on dilated eyes instead of LED, which was predominantly used by most studies until then. It is unclear whether stroboscopic stimulation is superior to LED, as none of these studies employed ERG to confirm reliable stimulation of the retina. Two other studies [40,41] also used strobe light and recorded reliable intraoperative VEP but used cortical recording electrodes.
Around the turn of the century, most studies started using TIVA. However for several years, most studies that employed TIVA also failed to reliably record intraoperative VEPs.
Along with the change in the type of anesthesia, authors also used different stimulus delivery and acquisition parameters. Red LED was used in most studies to deliver the stimulus and the flash frequency ranged from 1-1.9 Hz, except in the Wiedemayer et al. study [6] which recorded steady state VEPs (at a flash frequency of 8.5 Hz. Recording VEPs with a higher stimulus frequency of 8.5 Hz resulted in a slight improvement in the inter-individual variability, but failed to yield a stable recording. Recent studies that were more successful in recording intraoperative VEPs seem to have employed a longer duration of the flash stimulus (20-40 ms), compared to the older studies (< 3 ms). However, in light of other significant changes that some studies employed (mentioned below) it is doubtful whether stimulus duration is a crucial factor. The recording electrode montage was not different among studies and most conformed to the 10-20 system. Using the left and right occipital electrodes in addition to Oz, Fz and A1/A2 seem to have enhanced the reliability of recordings (See in Table 1 recent vs. earlier studies). Given the inter-individual topographic variability of the human striate cortex [16], we also believe that a montage including several recording scalp channels (e.g., Oz-Fz, O1-Fz, O2-Fz, Pz-Fz and even LO-Fz, and RO-Fz) is more informative. This may especially be valuable in intraoperative recordings during intracranial surgery, when brain shifts are a common occurrence [51,52].
The choice of the bandpass frequency for recording VEPs is interesting. Earlier studies have used a frequency cut off of 1-5 Hz for the high pass filter and 30-100 Hz for the low pass filter. Changing the bandpass within this range seemed to have little effect on the rate of false positive and false negative results. The two studies in 2010 from the Japanese groups [9,10] and Kamio et al. [35], reported reliable intraoperative recording used 20-500 and 10-1000 Hz, albeit with significantly improved stimulus delivery systems. The Houlden study [38] specifically showed that although suppressing alpha EEG improves the signal to noise ratio of flash VEP, increasing the low cut off above 15-20 Hz comes at a price.
Recording intraoperative VEP reliably seems to depend on, among other things: a) an improved stimulus delivery system that maintains continued retinal stimulation despite factors such as displacement of the stimulus delivery system due to surgical maneuvers and b) the use of ERG to confirm adequate retinal stimulation. This may involve the use of pliable material in which multiple LEDs can be embedded, the intensity of which can be changed to evoke optimal amplitude VEP. This material should ideally be closely approximated over closed eyes and provide continuous stimulation to the retina, withstanding small movements and/or displacement that may be encountered during surgery. Once appropriate retinal stimulation is ensured throughout surgery, one can be quite confident that any observed intraoperative change in VEPs may be directly related to surgical maneuvers or anesthetic changes. Without ERG, it will always be hard to tease out technical from surgical causes. A stimulus frequency of around 1 Hz seems to work fine. It is also imperative that once an appropriate stimulus delivery system is in place, ideal recording parameters are set. If previous studies offer any clues as to the recording parameter reliability, a broader bandpass filter is favorable, with the low cut off being 10-15 Hz. Recent studies have employed TIVA and in general, inhalational anesthesia is rarely if ever used during evoked potential monitoring. A summary of how technical changes in different studies affected the reliability of VEP recording is provided in Table 2.
| Technical modifications/Improvements |
Average % of patients on whom VEPs were reliably recorded [Reference] |
| Red LED + Inhalational Anesthesia |
44 [4,28,33] |
| Stroboscopic flash light |
98 [8,40*,41*] |
| Red LED + TIVA |
65 [5-7,36] |
| Red LED + TIVA + ERG |
92 [9,10,35] |
| Optic Nerve stimulation |
93 [46-48] |
| Diffusion tensor Imaging |
100 [44*] |
| Cortical recording electrodes |
82 [39] |
(TIVA: Total Intravenous Anesthesia; ERG: Electroretinography; LED: Light Emitting Diode).
* This technique was employed in only two patients in these studies. |
Table 2: Summary of how different techniques/technological advancements affected the reliability of intraoperative VEP recording over the years.
Conclusion
Historically, the use of Intraoperative Visual evoked potentials has been limited by the inability to record reliable and reproducible waveforms during surgery. However a better understanding of the factors that affect the signal intraoperatively and better techniques of stimulus delivery and acquisition, have improved the reliability of recording of VEPs. Our literature review reveals that the success of recording intraoperative VEPs starts outside the operating room with a proper evaluation of pre-operative visual deficits, helping us predict the group of patients who are less likely to have reliable VEPs. Intraoperatively, the following factors are important-1) maintaining normal intraoperative physiological/ hemodynamic parameters such as blood pressure, heart rate and temperature 2) the use of TIVA instead of inhalational Anesthesia 3) better stimulus delivery methods such as multiple red LEDs incorporated into a pliable material applied over the eye 4) recording intraoperative ERG to ensure good retinal stimulation and 5) employing optimal recording parameters including multiple montages and band pass filter settings. Meaningful use of intraoperative VEPs also requires that we define significant changes (amplitude, latency or morphology), which would indicate post-operative visual dysfunction. However, this begins with the ability to reliably record VEPs intraoperatively. Once this is achieved, studies involving a large number of patients with varying degrees of pre-operative visual dysfunction and pathology are needed, in order to correlate intraoperative changes with post-operative outcome.
Conflict of Interest
The authors have no financial support or conflict of interest to report.
Acknowledgement
This paper was conceived following discussions about the intraoperative use of VEP with Dr. Ann-Christine Duhaime, to whom we are very grateful. We thank J. DeJesus for his help with the figures.
9814
References
- Ropper AH, Brown RH (2005) Adams and Victor's principles of neurology. (8thedn). New York: McGraw-Hill Medical Pub. Division.
- Creel DJ (2014) Visual evoked potentials. Webvision. https://webvision.med.utah.edu/book/electrophysiology/visually-evoked-potentials/
- Cedzich C, Schramm A, Fahlbusch R (1987) Are flash - evoked visual potentials useful for intraoperative monitoring of visual pathway function? Neurosurgery 21: 709–715.
- Cedzich C, Schramm A, Mengedoht CF, Fahlbusch R (1988) Factors that limit the use of flash visual evoked potentials for surgical monitoring. ElectroenecphalogrClinNeurophysiol 71: 142-145.
- Wiedemayer H, Fauser B, Armbruster W, Gasser T, Stolke D (2003) Visual evoked potentials for intraoperative neurophysiologic monitoring using total intravenous anesthesia. J NeurosurgAnesthesiol 15: 19–24.
- Wiedemayer H, Fauser B, Sandalcioglu IE, Armbruster W, Stolke D (2004) Observation on intraoperative monitoring of visual pathways using steady-state visual evoked potentials. Eur J Anesthesiol 21: 429-433.
- Chung SB, Park CW, Seo DW, Kong DS, Park SW (2012) Intraoperative visual evoked potential has no association with postoperative visual outcomes in transphenoidal surgery. ActaNeurochir 154:1505-1510.
- Harding GF, Bland JD, Smith VH (1990) Visual evoked potential monitoring of optic nerve function during surgery. J NeurolNeurosurg Psychiatry 53: 890-895.
- Kodama K, Goto T, Sato A, Sakai K, Tanaka Y, et al.(2010)Standard and limitation of intraoperative monitoring of the visual evoked potential. ActaNeurochir (Wien) 152:643–648.
- Sasaki T, Itakura T, Suzuki K, Kasuya H, Munakata R, et al.(2010) Intraoperative monitoring of visual evoked potential: introduction of a clinically useful method. J Neurosurg 112: 273–284.
- Myers MA, Hamilton SR, Bogosian AJ, Smith CH, Wagner TA (1997) Visual loss as a complication of spine surgery. Spine 22: 1325-1329.
- Stevens WR, Glazer PA, Kelley SD, Lietman TM, Bradford DS (1997) Ophthalmic complications after spinal surgery. Spine 22: 1319-1324.
- Chang SH, Miller NR (2005) Incidence of vision loss due to perioperative ischemic optic neuropathy associated with spine surgery: The Johns Hopkins hospital experience. Spine 30: 1299-1302.
- Buono LM, Foroozan R (2005) Perioperative posterior ischemic optic neuropathy: Review of the literature. SurvOphthalmol 50:15-26.
- Lee LA, Roth S, Posner KL, Cheney FW, Caplan RA, et al.(2006) The American Society of Anesthesiologists Postoperative Visual Loss Registry-Analysis of 93 spine surgery cases with postoperative visual loss. Anesthesiology 105: 652-659.
- Chiappa KH (1997) Principles of evoked potentials. In: Chiappa KH, (ed). Evoked potentials in clinical medicine. Philadelphia: Lippincott-Raven Publishers pp: 1-31.
- Adrian ED, Mathews BHC (1934) The Berger rhythm: Potential changes from the occipital lobes in man. Brain 57:355-385.
- Dawson GD (1954) A summation technique for the detection of small of evoked potentials. ElectroencephalogrClinNeurophysiol 6: 65-84.
- Copenhaver RM, Beinhocker GD (1963) Evoked occipital potentials recorded from scalp electrodes in response to focal visual illumination. Invest Ophthalmol2: 393-406.
- Regan D, Heron JR (1969) Clinical investigation of lesions of the visual pathway: a new objective technique. J. NeurolNeurosurg Psychiatry32: 479-483.
- Harvey RA (2012) The visual system. In: Harvey RA, (ed). Lippincott’s Illustrated Review Neuroscience.Philadelphia,PA: Lippincott Williams & Wilkins pp: 289-310.
- Snell RS (2009) Clinical neuroanatomy, (7thedn). Baltimore: Lippincott Williams & Wilkins.
- Guidelines 9B (2008) Guidelines on visual evoked potentials. American Clinical Neurophysiology Societyhttps://www.acns.org/pdf/guidelines/Guideline-9B.pdf
- Slotnick SD, Klein SA, Carney T, Sutter E, Dastmalchi S (1999) Using multi-stimulus VEP source localization to obtain a retinotopic map of human primary visual cortex. ClinNeurophysiol 110: 1793-1800.
- Di Russo F, Martínez A, Sereno MI, Pitzalis S, Hillyard SA (2002) Cortical sources of the early components of the visual evoked potential. Hum Brain Mapp15: 95-111.
- Levy SR (1997)Visual evoked potentials in pediatrics. In: Chiappa KH (ed). Evoked potentials in clinical medicine. Philadelphia: Lippincott-Raven Publisherspp: 147-156.
- Cedzich C, Schramm A (1990) Monitoring of flash visual evoked potentials during neurosurgicaloperations. IntAnesthesiolClin28: 165-169.
- Thirumala PD, Habeych ME, Crammond DJ, Balzer JR (2011) Neurophysiologic intraoperative monitoring of olfactory and optic nerves. J ClinNeurophysiol 28: 538-542.
- Wright JE, Arden G, Jones BR (1973) Continuous monitoring of the visually evoked response during intra-orbital surgery. Trans OphthalmolSoc U K 93: 311-314.
- Feinsod M, Selhorst JB, Hoyt W, Wilson CB (1976) Monitoring optic nerve function during craniotomy. J Neurosurg 44: 29-31.
- Wilson WB, Kirsch WM, Neville H, Stears J, Feinsod M, et al.(1976) Monitoring of visual function during parasellar surgery. Surg. Neurol 5: 323-329.
- Chacko AG, Babu KS, Chandy KJ (1996). Value of visual evoked potential monitoring during trans-sphenoidal pituitary surgery. Br J Neurosurg 10: 275-278.
- Rozet I, Metzner J, Brown M, Treggiari MM, Slimp JC, et al.(2015) Dexmedetomidine does not affect evoked potentials during spine surgery. AnesthAnalg 121: 492-501.
- Kamio Y, Sakai N, Sameshima T, Takahashi G, Koizumi S, et al.(2014) Usefulness of intraoperative monitoring of visual evoked potentials in transspheniodal surgery. Neurol Med Chir (Tokyo) 54:606-611.
- Luo Y, Regli L, Bozinov O, Sarnthein J (2015) Clinical utility and limitations of intraoperative monitoring of visual evoked potentials. PLOS One 10:e0120525.
- Sato A (2016) Interpretation of the causes of instability of flash visual evoked potentials in intraoperative monitoring and proposal of a recording method for reliable functional monitoring of visual evoked potentials using a light-emitting device. J Neurosur 1-10.
- Houlden DA, Turgeon CA, Polis T, Sinclair J, Coupland S, et al.(2014) Intraoperative flash VEPs are reproducible in the presence of low amplitude EEG. J ClinMonitComput 28:275-285.
- Ota T, Kawai K, Kamada K, Kin T, Saito N (2010) Intraoperative monitoring of cortically recorded visual response for posterior visual pathway. J Neurosurg 112: 285–294.
- Albright AL, Sclabassi RJ (1985) Cavitron ultrasonic surgical aspirator and visual evoked potentialmonitoring for chiasmalgliomas in children. J Neurosurg 63: 138-140.
- Curatolo JM, Macdonell RAM, Berkovic SF, Fabinyi GCA (2000) Intraoperative monitoring to preserve central visual fields during occipital corticectomy for epilepsy. J ClinNeurosci 7: 234-237.
- Sundgren PC, Dong Q, Gomez HD, Mukherji SK, Maly P, et al.(2004) Diffusion tensor imaging of the brain: review of clinical applications. Neuroradiology 46: 339-350.
- Reinges MHT, Schoth F, Coenen VA, Krings T (2004) Imaging of post-thalamic visual fiber tracts by anisotropic diffusion weighted MRI and diffusion tensor imaging: principles and applications. European Journal of Radiology 49:91-104.
- Kamada K, Todo T, Morita A, Masutani Y, Aoki S, et al.(2005) Functional monitoring for visual pathway using real-time visual evoked potentials and optic-radiation tractography. Operative Neurosurgery 57:121-126
- Asaad WF, Simon MV, Eskander E (2010) Intraoperative neurophysiologic monitoring of the cranial nerves and brain stem. In: Simon MV (ed). Intraoperative neurophysiology: A comprehensive guide to monitoring and mapping. New York, NY. Demos Medical pp: 299-321.
- Kikuchi Y, Sasaki T, Matsumoto M, Oikawa T, Itakura T, et al.(2005)Optic nerve evoked potentials elicited by electrical stimulation – Experimental and clinical studies. Neurol Med Chir (Tokyo) 45: 349-355.
- Bosnjak R, Benedicic M (2008) Direct epidural electrical stimulation of the optic nerve: a new method for intraoperative assessment of function. J Neurosurg 109: 647-653.
- Benedicic M, Bosnjak R (2011) Intraoperative monitoring of the visual function using cortical potentials after electrical epidural stimulation of the optic nerve. ActaNeurochir 153: 1919-1927.
- Russ W, Krunholz W, Hempelmann G (1984) Visual evoked potentials (VEP) in anesthesia and intensive care. Anaesthetist 33: 154-160.
- Raudzens PA (1982) Intraoperative monitoring of evoked potentials. Ann NY AcadSci 388: 308-326.
- Reinges MH, Nguyen HH, Krings T, Hutter BO, Rohde V, et al.(2004) Course of brain shift during microsurgical resection of supratentorial cerebral lesions: limits of conventional neuronavigation. ActaNeurochi (Wien) 146: 369-377.
- Nimsky C, Ganslandt O, Hastreiter R, Wang R, Benner T, et al.(2005) Intraoperative diffusion tensor MR imaging: shifting of white matter tracts during neurosurgical procedures-initial experience. Radiology 234: 218-225.