Keywords
Dyslexia; Visual field; Doubling illusions; Reading difficulties; Magnocellular pathway
Introduction
Dyslexia is a condition characterized by specific reading difficulties that can be partially explained by some failures in basic visual processing [1,2]. It is a condition that affects boys and girls equally, is not intelligence- related, and is usually first noticed during childhood. Dyslexia has historically been considered and clinically treated as a linguistic defect and not a visual problem. Treatments not founded on a linguistic process remain controversial: some evidence suggests that reading failures are unlikely to precede visual deficits [3]. Dyslexia persists into adulthood; however, most children can be taught to read accurately even though they tend to read more slowly and not automatically [2]. To date, it remains controversial that dyslexics may have a visual processing deficit of the magnocellular (M) dominated dorsal pathway, and that they could be less sensitive to visual stimuli mediated by the dorsal stream [4].
There is no evidence that unambiguously identifies a precise neurological lesion site responsible for a phenomenon like dyslexia. Autopsies of dyslexic brains reveal a disorder in the M layers of the lateral geniculate nucleus (LGN) where the M system cells seem to be smaller than the control brain cells. The M pathway is specifically involved in analysis of visual motion. Axons originating from M layers of the ventral side of the LGN, bind with neurons of the visual cortex areas selective to orientation and direction of motion [5,6]. The spatial frequency doubling (FD) illusion is considered a measure of M activity. The FD illusion consists in coarse sinusoidal grating patterns, which, when modulated at high temporal and low spatial frequencies, create the illusion of a stable grating with sight perception of twice the actual spatial frequency of the component gratings: FD is determined when a 0.1 - 4 c/deg grating is made to flicker at more than 15 Hz [7-10].
Evidence indicates that the M pathway is isolated as a whole by FD stimuli: a measure of spatial non-linearity has been used to detect an M response in animal retina or LGN using counter phase-modulated sinusoidal gratings at various spatial frequencies [11-13]. Recently, FD illusions have been used to analyze the performance of the M system in dyslexics, demonstrating that dyslexic people (children and adults) are less sensitive in detecting the FD illusion than normal subjects [14]. The purpose of this present study was to demonstrate whether there is a lack of a specific visual field (VF) pattern in reading-disabled children, by exploring the spatial FD illusion responses that occur via the M visual pathway. The aim of this study was also to form new correlations between reading disabilities and visual-spatial performance: such a correlation could prove useful to better understand the etiological mechanisms of dyslexia, and create connections between its various clinical manifestations.
Patients and Methods
This study obtained the approval of the local ethics committee and was compliant with the tenets of the Declaration of Helsinki. From January 2011 to December 2012, eighteen dyslexic subjects and nine controls sent for ophthalmologic evaluation at the orthoptic center of the Ophthalmology Section, University Hospital of Parma, were identified and subsequently enrolled in the present study. All enrolled subjects underwent an automated VF examination based on frequency doubling illusions as visual stimuli. Use was made of a Frequency Doubling Technology (FDT) Visual Field Instrument (Welch Allyn Frequency Doubling Technology Zeiss Humphrey Systems perimeter version SW 3.00; Welch Allyn, Skaneateles, NY, and Carl Zeiss Meditec, Dublin, CA). For the right eye (RE) and left eye (LE), 19 VF locations were grouped by 7 topographic patterns, each consisting of 5 contiguous locations: central (CE), superior-temporal (ST), outer superior-nasal (OSN), inner superior-nasal (ISN), inner inferior-nasal (IIN), outer inferior-nasal (OIN), inferior-temporal (IT) (Figure 1).
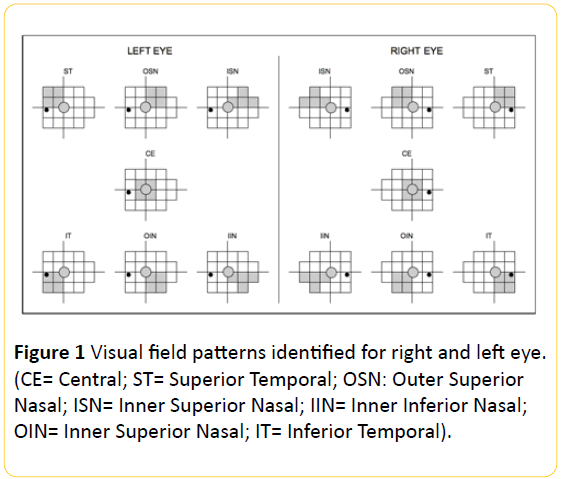
Figure 1: Visual field patterns identified for right and left eye. (CE= Central; ST= Superior Temporal; OSN: Outer Superior Nasal; ISN= Inner Superior Nasal; IIN= Inner Inferior Nasal; OIN= Inner Superior Nasal; IT= Inferior Temporal).
All the patients enrolled in the affected group were diagnosed with dyslexia by a neuropsychiatrist according to the diagnostic criteria for learning disabilities suggested in the Diagnostic and Statistical Manual of Mental Disorders, 5th edition (DSM-V)1. Dyslexics had no reading comprehension difficulties. The ability to read a text aloud was measured using an Italian standardized test for reading abilities, the MT reading test [15]. Scores for both speed and accuracy in reading were below a standardized clinical cut-off, since different versions of the same test were used depending on school grade. Ophthalmologic evaluation excluded a refractive defect no higher than +/-2 Diopters of spherical equivalent.
Best-corrected visual acuity (BVCA) was examined before treatment without psycho-stimulants based on speechlanguage therapy sustentation and domestic teaching support. A control group, consisting of children without dyslexia was also examined. None of the children enrolled had amblyopia or eye movement abnormalities, or any other ocular pathology as shown by a full ophthalmologic evaluation.
The default settings of the FDT instrument included measurements of both eyes at all 19 VF locations using a full threshold analysis program (N-30): in all cases each of the two eyes was studied separately, consecutively, and one immediately after the other. In all cases, VF assessment always began with the RE. Each stimulus trial was presented to one of 19 points throughout the central 30-degree radius of eccentricity. In FDT, visual stimulus consists of a vertical sinusoidal grating presented at each position in a low spatial frequency (0.25 c/deg), with a high temporal frequency (flicker counter-phase of 25 Hz) and with a backlight average of 100 cd/m2. The stimulus contrast varied for each position. The visual stimuli were square areas measuring 10 × 10 degrees at all locations except for the center (5 × 5 degrees). On presentation of the stimulus (which lasted up to 720 msec), contrast was gradually increased up to the selected level, remained at that level for a period of time between presentations of up to 500 msec, and then gradually decreased to zero, in order to avoid a rhythmic patient response.
A push on the button performed from 100 msec to 1 second after the presentation indicated a perceptual response to visual stimulus at a given level of contrast for that position. A threshold level of 0dB (~100%) corresponded to a maximum contrast (lowest sensitivity) and 56dB (~0%) to a minimum contrast (maximum sensitivity).
Statistical Analysis
Statistical analysis was performed using Spreadsheet OOodev 3.4.0 software. For all comparisons performed on the analyzed characteristics of the two groups, analysis of variance (ANOVA) was used. The data were presented as means and standard deviations. A P value less than 0.05 was used to indicate statistical significance.
Results
Of the 27 subjects enrolled in this study, 15 were dyslexic males, 3 dyslexic females, 4 control males, and 5 control females. The overall mean age was 8.4 ± 1.4 [range, 7-13 years]. The mean age for the dyslexic group was 8.7 ± 1.4 [range, 7-13 years] and for the control group 7.8 ± 1.1 [range, 7-10 years]. There were no statistically significant differences concerning the age of the two groups (Table 1).
| |
Overall (n=27) |
Controls (n=9) |
Dyslexics (n=18) |
P Value |
| Age (yrs) |
Mean ± SD |
8.4 ± 1.4 |
7.8 ± 1.1 8.7 |
8.7 ± 1.4 |
0.5* |
| Min-Max |
7 – 13 |
7 – 10 |
7 – 13 |
|
| Gender (n) |
Male |
19 |
4 |
15 |
|
| Female |
8 |
5 |
3 |
|
| *ANOVA |
Table 1: Demographic characteristics.
For each eye, the thresholds of the contiguous 5 points clusters forming each indicated pattern of the VF were averaged: the 7 threshold averages obtained were compared for each eye between the control group and the dyslexic group (Table 2).
| |
|
RE |
LE |
| Pattern name |
Group |
Mean |
Min |
Max |
SD |
P Value* |
Mean |
Min |
Max |
SD |
P Value* |
| CE |
Control |
27.42 |
23.4 |
33.2 |
2.86 |
0.17 |
29.37 |
26.8 |
32.2 |
1.97 |
0.038 |
| Dyslexic |
28.66 |
23.4 |
42.8 |
4.61 |
27.9 |
17.6 |
35 |
4.14 |
| ST |
Control |
26.62 |
20.8 |
30.8 |
3.24 |
0.45 |
27 |
23.2 |
30.2 |
2.42 |
0.14 |
| Dyslexic |
26.38 |
21.2 |
31.4 |
2.64 |
24.73 |
12.8 |
31.6 |
4.06 |
| OSN |
Control |
27.44 |
24.4 |
33.6 |
2.83 |
0.96 |
28.8 |
24 |
32.8 |
2.9 |
0.23 |
| Dyslexic |
27.02 |
21.6 |
31.8 |
2.94 |
26.55 |
12 |
31.6 |
4.4 |
| ISN |
Control |
27.48 |
24.4 |
33 |
2.57 |
0.55 |
28.97 |
23.8 |
33.8 |
3.35 |
0.38 |
| Dyslexic |
26.51 |
20.4 |
32 |
3.17 |
26.73 |
11.6 |
32 |
4.54 |
| IIN |
Control |
27.02 |
21.4 |
34 |
3.86 |
0.75 |
28.75 |
26.2 |
33.4 |
2.24 |
0.04 |
| Dyslexic |
27.1 |
18.6 |
33 |
3.59 |
26.72 |
14.4 |
34.8 |
4.6 |
| OIN |
Control |
27.02 |
20.4 |
33.6 |
3.95 |
0.11 |
28.04 |
24.2 |
31.8 |
2.57 |
0.1 |
| Dyslexic |
27.56 |
22.4 |
32.2 |
2.53 |
27.45 |
13.6 |
34.4 |
4.57 |
| IT |
Control |
27.22 |
22.6 |
34.6 |
3.68 |
0.34 |
27.82 |
25 |
32 |
2.38 |
0.02 |
| Dyslexic |
26.88 |
22 |
31.2 |
2.83 |
25.75 |
8.6 |
32.2 |
5.31 |
| Note: SD= Standard Deviation; CE= Central ; ST= Superior Temporal ; OSN : Outer Superior Nasal ; ISN= Inner Superior Nasal ; IIN= Inner Inferior Nasal ; OIN= Inner Superior Nasal ; IT= Inferior Temporal |
Table 2: Comparison between threshold means (dB) of each determined visual field pattern area of Control and Dyslexic Group in RE and LE.
For each group, we also compared the threshold averages of the same 7 patterns for both eyes (Table 3).
| |
|
Controls |
Dyslexics |
| Pattern name |
Eye |
Mean |
Min |
Max |
SD |
P Value* |
Mean |
Min |
Max |
SD |
P Value* |
| CE |
RE |
27.42 |
23.4 |
33.2 |
2.86 |
0.31 |
28.66 |
23.4 |
42.8 |
4.61 |
0.03 |
| LE |
29.37 |
26.8 |
32.2 |
1.97 |
27.91 |
17.6 |
35 |
4.14 |
| ST |
RE |
26.62 |
20.8 |
30.8 |
3.24 |
0.42 |
26.38 |
21.2 |
31.4 |
2.64 |
0.08 |
| LE |
27 |
23.2 |
30.2 |
2.42 |
24.73 |
12.8 |
31.6 |
4.06 |
| OSN |
RE |
27.44 |
24.4 |
33.6 |
2.83 |
0.95 |
27.02 |
21.6 |
31.8 |
2.94 |
0.1 |
| LE |
28.8 |
24 |
32.8 |
2.9 |
26.5 |
12 |
31.6 |
4.4 |
| ISN |
RE |
27.48 |
24.4 |
33 |
2.57 |
0.47 |
26.51 |
20.4 |
32 |
3.17 |
0.15 |
| LE |
28.97 |
23.8 |
33.8 |
3.35 |
26.73 |
11.6 |
32 |
4.54 |
| IN |
RE |
27.02 |
21.4 |
34 |
3.86 |
0.14 |
27.1 |
18.6 |
33 |
3.59 |
0.31 |
| LE |
28.75 |
26.2 |
33.4 |
2.24 |
26.72 |
14.4 |
34.8 |
4.6 |
| OIN |
RE |
27.02 |
20.4 |
33.6 |
3.95 |
0.24 |
27.56 |
22.4 |
32.2 |
2.53 |
0.01 |
| LE |
28.04 |
24.2 |
31.8 |
2.57 |
27.45 |
13.6 |
34.4 |
4.57 |
| IT |
RE |
27.22 |
22.6 |
34.6 |
3.68 |
0.34 |
26.88 |
22 |
31.2 |
2.83 |
0.01 |
| LE |
26.88 |
22 |
31.2 |
2.83 |
25.75 |
8.6 |
32.2 |
5.31 |
| Note: SD= Standard Deviation; CE= Central; ST= Superior Temporal; OSN= Outer Superior Nasal; ISN= Inner Superior Nasal; IIN=Inner Inferior Nasal; OIN= Outer Inferior Nasal; IT= Inferior Temporal |
Table 3: Comparison between mean of thresholds (dB) of each determinated visual field pattern area of RE and LE for Control and Dyslexic group.
The threshold averages of each pattern compared between control and dyslexic groups (Figure 2) showed a statistically significant difference in the left eye (LE) for the patterns CE (P=0.038), IIN (P= 0.045) and IT (P=0.026).
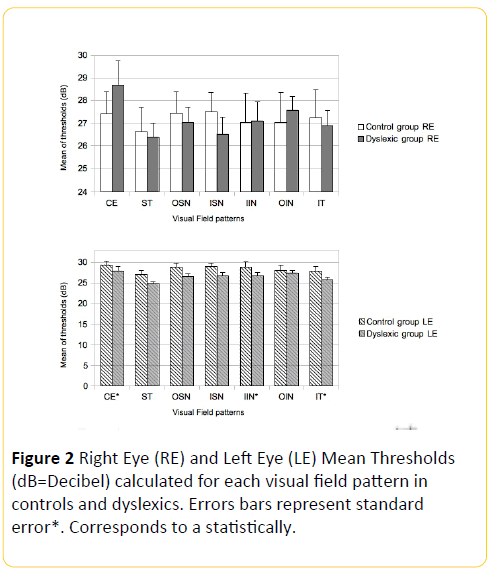
Figure 2: Right Eye (RE) and Left Eye (LE) Mean Thresholds (dB=Decibel) calculated for each visual field pattern in controls and dyslexics. Errors bars represent standard error*. Corresponds to a statistically.
For the RE and the remaining LE patterns, the results indicate a non-statistically significant difference between the control and dyslexic groups (Figure 2). The 7 VF pattern thresholds for the RE were compared with those of the LE for each group: a statistically significant difference was found only in the patterns CE (P<0.05), OIN (P<0.05) and IT (P<0.05) of the dyslexic group (Figure 2).
We also analyzed the mean deviation index (MD) of overall visual fields (Tables 4A and 4B).
| Group |
Eye |
Mean |
Min |
Max |
SD |
P Value* |
| Control |
RE |
-3.1 |
-6.52 |
3.73 |
3.27 |
0.02 |
| LE |
-3.64 |
-5.08 |
-1.57 |
1.41 |
| Dyslexic |
RE |
-4.25 |
-6.68 |
-0.95 |
1.73 |
0.01 |
| LE |
-4.74 |
-15.5 |
-0.93 |
3.32 |
| SD = standard deviation |
Table 4A: Comparison between mean defects (MD) of RE and LE for each group.
| Eye |
Group |
Mean |
Min |
Max |
SD |
P Value* |
| RE |
Control |
-3.1 |
-6.52 |
3.73 |
3.27 |
0.02 |
| Dyslexic |
-4.25 |
-6.68 |
-0.95 |
1.73 |
| LE |
Control |
-3.64 |
-5.08 |
-1.57 |
-1.41 |
0.01 |
| Dyslexic |
-3.64 |
-15.5 |
-0.93 |
3.32 |
| SD = Standard Deviation |
Table 4B: Comparison between mean defects (MD) of each group for RE and LE.
For the RE, the mean MD values of the control group were -3.1+/-3.27, while the mean MD values of the dyslexic group were -4.25+/-1.73. For the LE, the mean MD values of the control group were -3.64+/-1.41, and the mean MD values of the dyslexic group were -4.74+/-3.32.
On comparing the FDT mean deviation index (MD) of the control and dyslexic groups we found a statistical difference for both RE (P=0.026) and LE (P=0.018). A comparison of RE and LE MD values also showed a significant difference in both the control group (P=0.028) and the dyslexic group (P=0.010).
Discussion
There are many similarities between the visual performance of patients with acquired dyslexia and those with developmental dyslexia: these include abnormal eye movements, left neglect, failure to distinguish between rotated letters, crowding effect, and of course, reading problems. Typical aspects of dyslexia include visual-spatial neglect deriving from a loss of function of the parietal cortex, which in most cases leads to reading problems [16]. The relationship between dyslexia and parietal cortical damage has been suggested by some studies in animals. Monkeys with lesions of the parietal cortex are able to discriminate between visual stimuli of a different shape such as a square and a triangle, but are unable to distinguish between a reversal from left to right, or variations in the same stimuli (e.g. < and > symbols, or rotated characters – b and d); important skills for successful reading in human beings.
Our data indicate that a dyslexic reader's left eye presents less sensitivity to FD illusions in almost all inferior retinal hemifield.
This evidence seems to be confirmed by a combined analysis of LE and RE, which demonstrates a parallelism between all pattern thresholds in the control group VF, but a divergence in inferior pattern thresholds in the dyslexic group VF.
In support of our observations, some abnormalities have recently been described in the neuronal structure of the cerebral cortex of dyslexic children, such as a significant reduction in left planum temporale asymmetry in MRI studies, and an abnormal ectopy and microgyria throughout the cerebral cortex, especially in the temporal-parietal association areas [17]. Assurance and timeliness in performing an action, or speed in making progress on a learning curve, depend on how fast and efficient the processing of visual information through the M path is. The limit in the efficiency of this system comes from the fact that at any given time only a fraction of the information from the visual scene reproduced on the two retinas can be processed, while other information will be lost or discarded [18]. Through visual attention, a selective filtering of visual information is then generated [19]. The different performance between the two eyes can be explained by a different processing speed of visual stimuli through each eye: i.e., the brain chooses not to see something in an eye’s VF [20].
We grouped the individual 19 VF locations in 5-point clusters to simplify analysis of the different VF sectors, and to avoid ignoring an inevitable overlap of the wide M system receptive fields, in order to minimize its effects.
When deciding on how to group the 19 VF locations in order to form each pattern, we included a central location in each contiguous 5-point cluster in order to enlarge the influence of central retinal sensitivity to all patterns in calculating the threshold means. In fact, the cortical representation of the central VF location is noteworthy because of the high cellularity in the fovea and its wide cortical synaptic distribution ratio.
An important function of the M system is to help the eye control movements, and its alteration in dyslexics may destabilize binocular fixation: this instability in the dynamic manifestation of letters might create visual clutter. It has been found that binocular control in dyslexics is often poor; their eyes quiver in an attempt to visualize lowercase letters and the consequent instability generates visual reading errors. Indeed, they demonstrate fewer mistakes of this type in front of larger print. In addition, dyslexics make fewer errors in reading if they read with one eye by occluding the contralateral in that monocular occlusion lessens the confusion caused by two independent moving images. Many dyslexics complain that the words and letters move, blur and merge into each other. These subjects are not able to inhibit the products of each fixing in reading during saccadic eye movements. This leads first to an overlapping of successive images, followed by severe visual clutter. Dyslexics show a slight reduction in meta-contrastinduced visual backward masking, a phenomenon of perceptual suppression of a stimulus that does not spatially overlap a subsequent stimulus.
The MD parameter of the VF measures how the retinal sensitivity values registered deviate from those of normal subjects of the same age. A positive value correlates with normality, while a negative number suggests a loss of sensitivity compared to a subject of the same age. In the dyslexic group, both eyes presented an overall reduction in retinal sensitivity measured with sinusoidal grating stimuli, while the LE presented a loss of retinal sensitivity greater than the corresponding eye in the control group.
Again in the control group, the difference registered between the two eyes - with an overall loss of retinal sensitivity in the LE greater than in the RE - can be explained by a taxing effect during child performance considering that the LE was always the second eye examined.
Conclusion
Our results confirm that since we always analyzed monocular VF in each case by first examining the RE and then the LE in immediate succession, respect to control group dyslexics group presents for both eyes and between the two eyes losses in retinal sensitivity thresholds of some specific VF patterns: a particular reduction of the retinal sensitivity thresholds of lower hemifield of LE has been found.
Loss of fixation, false positive error, and false negative error are parameters that express the degree of reliability of a VF examination. In our study, the absence of statistical difference in these parameters made us consider the comparisons performed between the VF of the studied groups credible.
Attention is clearly sensitive to the nature of visual stimuli, and dyslexics present alterations in the execution of a series of tasks (that depend on the attentive function of the parietal cortex) such as Posner's paradigm, involving visual searching tasks, the phenomena of perceptual grouping, and inhibition of peripheral stimuli [21]. Also in our study, the dyslexics seemed to present a lateralized sensibility failure of specific perimetric areas when analyzed with FD illusions compared to normal subjects when comparing the two eyes within each group of patients. The asymmetric visual deficiencies observed in the absence of any hemyanoptic alterations, results in a different processing speed of the visual stimuli used in this study by each eye: this is related to a fast and efficient processing of visual motor information in the M pathway. These topographic findings may help to confirm that a deficit in the M visual pathway is correlated to reading difficulties. M impairments in dyslexics are very typical and can be demonstrated using uncommon visual conditions that are not found during normal reading. However, looking at the wide variety of dyslexia symptoms, it is difficult to imagine that one single explanation may underlie the different clinical manifestations of this neuropsychiatric condition. It is accepted that an early diagnosis of dyslexia followed by appropriate remedial intervention is the only scientifically proven therapy: starting from our suggestions, in the future new care procedures might be established by considering this condition as a particular visual disturbance.
17723
References
- American Psychiatric Association (2013) Diagnostic and Statistical Manual of Mental Disorders. (5thedn). Arlington, VA: American Psychiatric Publishing.
- Handler SM, Fierson WM (2011) American Academy of Ophthalmology, American Association for Pediatric Ophthalmology and Strabismus, American Association of Certified Orthoptists: Learning Disabilities, Dyslexia, and Vision. Pediatrics 127: 818-856.
- Stein J (2001) The magnocellular theory of developmental dyslexia. Dyslexia. 7: 12-36.
- Stuart GW, McAnally Kl, Castles A (2001) Can contrast sensitivity functions in dyslexia be explained by inattention rather than a magnocellular deficit? Vision Res 41: 3205-3211.
- Curcio CA, Allen KA (1990) Topography of ganglion cells in human retina. J Comp Neurol 300: 5-25.
- Hubel DH (1995) Eye, brain, and vision. (2ndedn.) Scientific American Library No 22. New York: WH Freeman, pp: 86-92.
- White AJR, Sun H, Swanson WH, Lee BB (2002) An examination of physiological mechanisms underlying the frequency-Doubling Illusion. Invest Ophthalmol Vis Sci 43: 3590-3599.
- Vallam K, Metha AB (2007) Spatial structure of the frequency doubling illusion. Vision Res 47: 1732-1744.
- Zeppieri M, Demirel S, Kent K, Johnson CA (2008) Perceived spatial frequency of sinusoidal gratings. Optom Vis Sci 85: 318-329.
- Previc FH (1987) Origins and implications of frequency doubling in the visual evoked potential. Am J Optom Physiol Opt 64: 664-673.
- Swanson WH, Sun H, Lee BB, Cao D (2011) Responses of primate retinal ganglion cells to perimetric stimuli. Invest Ophthalmol Vis Sci 52: 764-771.
- Ibbotson MR, Maddess T (1994) The effects of adaptation to visual stimuli on the velocity of subsequent ocular following responses. Exp Brain Res 99:148-154.
- Maddess T, Ibbotson MR (1992) Human ocular following responses are plastic: evidence for control by temporal frequency-dependent cortical adaptation. Exp Brain Res 91: 525-538.
- Pammer K, Wheatley C (2001) Isolating the M(y)-cell response in dyslexia using the spatial frequency doubling illusion. Vision Res 41: 2139-2147.
- Cornoldi C, Colpo G (2011) MT reading test. Florence, Italy: O.S. Organizzazioni Speciali.
- Aziz-Zadeh L, Koski L, Zaidel E, Mazziotta J, Iacoboni M (2006) Lateralization of the Human Mirror Neuron System. J. Neurosci 26: 2964-2970.
- Best M, Demb JB (1999) Normal planum temporale asymmetry in dyslexics with a magnocellular pathway deficit. Neuroreport 10: 607-612.
- Davis AR, Sloper JJ, Neveu MM, Hogg CR, Morgan MJ, et al. (2006) Differential changes of magnocellular and parvocellular visual function in early- and late-onset strabismic amblyopia. Invest Ophthalmol Vis Sci 47: 4836-4841.
- King B, Wood C, Faulkner D (2008) Sensitivity to visual and auditory stimuli in children with developmental dyslexia. Dyslexia 14: 116-141.
- Craighero L, Carta A, Fadiga L (2001) Peripheral oculomotor palsy affects orienting of visuospatial attention. Neuroreport 12: 3283-3286.
- Facoetti A, Paganoni P, Lorusso ML (2000) The spatial distribution of visual attention in developmental dyslexia. Exp Brain Res 132: 531-538.