Keywords
Transcatheter aortic valve implantation; Non-invasive whole body electrical bio-impedance measurements; NICaS®; In-hospital hemodynamic outcomes
Abbreviations
AS: Aortic Valve Stenosis; ANOVA: Analysis of Variance; BI: Basal Impedance; BP: Blood Pressure; CI: Cardiac Index; CO: cardiac output; CPI: Cardiac Power Index; GGI: Granov Goor Index; HR: Heart Rate; ICU: Intensive Care Unit; LOS: Length Of Stay; LG-AS: Low Gradient Aortic Valve Stenosis; LVEF: Left Ventricular Ejection Fraction; NLG-AS: Non Low Gradient Aortic Valve Stenosis; MPG: Mean Pressure Gradient; RAAS: Renin Angiotensin Aldosterone System; RR: Respiration Rate; SI: Stroke Volume Index; STI: Systolic Time Intervals; STS: Society of Thoracic Surgeons; SV: Stroke Volume; TAVI: Transcatheter Aortic Valve Implantation; TPR: Total Peripheral Resistance; TPRI: Total Peripheral Resistance Index.
Introduction
Percutaneous, Transcatheter Aortic Valve Implantation (TAVI) is particularly appealing to Aortic Stenosis (AS) patients with advanced age and comorbidities whose outcome depends on less invasive surgical access and concomitant need of mechanical ventilation cardioplegia and heart-lung-machine [1,2]. Since the landmark PARTNER-trials, this less-invasive method has become an established alternative to conventional surgery in individuals at high surgical risk [3,4]. Meanwhile, several controlled trials and registries confirmed non-inferiority for TAVI in patients at intermediate and low risk as well [5,6].
Whereas beneficial outcome is proven for transfemoral TAVI, little is known about immediate and post-procedural hemodynamic changes compared to patients´ baseline status. This depends on the need of predominantly invasive measurement tools such as Swan-Ganz®- or PICCO® catheterisation systems. Information regarding baseline hemodynamics and changes after procedure may provide important information on TAVI scheduling and outcomes. Moreover, these parameters may offer an accurate tool for tailored peri- and post-procedural management and may influence outcomes of subgroups like patients with Low-Gradient (LG) and Non-Low-Gradient (NLG) AS in a different manner [7,8].
The NICaS® whole body electrical bio-impedance monitoring system provides an accurate and approved method to obtain hemodynamic parameters in an easy non-invasive manner and that can be used bedside at any time for repeated measurements [9-13].
Recently, we could demonstrate an improvement of hemodynamics in an unselected TAVI patients´ collective using the NICaS® system [14]. Nevertheless, this observation was not designed to discriminate changes within different subgroups with aortic valve stenosis.
Since there is proven accuracy for illustration of hemodynamic changes in patients measured with the NICaS®, the present prospective series aims to report on the ability to discriminate short-term hemodynamic outcomes in TAVI patients for subgroups with LG- and NLG-AS.
Materials and Methods
Patients
Over a period of 21 months, 100 unselected patients with severe symptomatic AS were scheduled to TAVI procedure after heartteam decision. Endovascular TAVI was applied in local anaesthesia and analgosedation without mechanical ventilation in all patients using the Medtronic Evolut R® (n=48), Edwards Sapien 3® (n=47) or Boston Scientific SYMETIS ACURATE neo™ TF® (n=4) system.
All comers were measured with the NICaS® system at baseline at the day before TAVI. Measurements were repeated after six to eight hours at the same day of TAVI procedure at the cardiology Intensive Care Unit (ICU) when patients were free of inotropics vasopressors or sedatives. A second in-hospital follow-up was performed at the day of discharge [mean hospital Length of Stay (LOS) 6.4 ± 1.2 days].
One patient died before onset of TAVI procedure due to lowoutput heart failure and was excluded from analysis. Thus, 99 patients left to be analysed for hemodynamic outcomes at the day of procedure and before discharge.
Additionally, the last 48 of the 99 included all-comers were assessed for baseline quality of life (QoL) using the EQ-5D-5L questioner [14,15]. Patients were called by phone to report on clinical outcomes after 3 months.
Ethics committee approval
The analysis was approved by the local Ethics Committee complying with the Declaration of Helsinki. All patients gave written informed consent for participation and anonymized data publication. Trial Registration Number 105/18, date of ethical approval 1st of November 2018.
NICaS® device and procedure
The NICaS® whole body electrical bio-impedance monitoring system (NIMedical, Israel Advanced Technology Industries, Hertzliya Pituach 4676672, Israel) is a FDA and European CE-sign approved non-invasive hemodynamic monitoring tool. Using a combination of pulse contour analysis and the Granov-Goor Index (GGI) based on the Systolic Time Intervals (STI) which similarly to Left Ventricular Ejection Fraction (LVEF)-can assess cardiac function and provide information on several circulatory parameters and volume status.
NICaS®-measurement procedure and validation studies compared to Swan-Ganz- and PICCO®- catheterisation techniques were reported recently [9-13].
In all of the 99 patients at least four consecutive measurements were carried out to achieve valuable results for each time point (mean number of consecutive measurements for baseline 4.8 ± 0.12 after procedure 5.1 ± 0.9 and before discharge 4.5 ± 1.6). Outliers within the consecutive measurements >20% were eliminated to achieve accurate means (3.9% of all measurements).
Study objectives
The purpose of this investigation was to prospectively validate in-hospital hemodynamic improvement after TAVI by repeated bedside non-invasive monitoring and to illustrate possible differences in subgroups of LG-AS and NLG-AS patients [7,8]. Primary goal was to discriminate post-procedural adaptive mechanisms for the two subgroups. Investigators obtaining NICaS® measurements were blinded to baseline TTE parameters while echo-cardiographers operators and ICU physicians were blinded to NICaS® results. Thus, NICaS® results did not influence TAVI scheduling or post-procedural management up to discharge illustrating hemodynamics only based on usual care principals.
Independently, we aimed to prospectively analyse mid-term clinical outcomes in TAVI procedure survivors after 3 month based on the EQ-5D-5L- Score [15,16].
Statistical analysis
Categorical variables are presented as counts and percentages. Continuous variables following a normal distribution are presented as mean+standard deviation. Variables were assessed for normal distribution with the Anderson-Darling test.
Primary endpoint was defined as the baseline-adjusted effect of between-group comparisons (LG-AS vs. NLG-AS) for changes in Cardiac Index (CI) at discharge. Sample size was calculated for an independent t-test of the means post-therapy with α=0.05. All tests were performed two-sided and p values <0.05 were considered as statistically significant. Data were analysed by Friedman´s ANOVA for comparison across multiple groups processing the data by the SPSS (version 15, SPSS Inc., Chicago, IL, USA) software package.
With a sample size of 46 per group, a relative effect of 80% of the standard deviation is detectable with a power of 80%. Thus, with an a priori estimated standard deviation of 0.1 L/min/m2, a difference 0.3 L/min/m2 is detectable for the primary endpoint change in CI which we consider as clinically relevant.
Results
Clinical characteristics
Patients’ baseline characteristics with regard to age, gender, bodymass- index clinical symptoms and baseline echocardiographic parameters are summarized in Table 1.
| Parameters |
All patients scheduled to TAVI procedure |
Patients with NLG-AS |
Patients with LG-AS |
| Subjects (n) |
99 (100 %) |
53 (53.5/100%) |
46 (46.5/100%) |
| Male/female |
54 (54.5%)/45 (45.5%) |
28 (52.8%)/25 (47.2%) |
29 (63%)/17 (37%) |
| Age |
82.4 ± 4.7 |
80.1 ± 2.9 |
83.2 ± 3.8 |
| Body mass index (kg/m2) |
27.8 ± 5.3 |
26.6 ± 5.5 |
28.1 ± 5.2 |
| Functional NYHA Class |
| NYHA Class I |
3(3.03%) |
2 (3.77%) |
1 (2.17%) |
| NYHA Class II |
27(27.3%) |
15 (28.3%) |
12 (26.1%) |
| NYHA Class III |
60(60.6%) |
33 (62.3%) |
27 (58.7%) |
| NYHA Class IV |
9 (9.09%) |
3 (5.66%) |
6 (13.0%) |
| Angina |
32(32.3%) |
20 (37.7%) |
12 (26.1%) |
| Syncope |
11(11.1%) |
3 (5.66%) |
8 (17.4%) |
| Baseline echocardiographic values |
| LVEF (%) |
48.6 ± 9.4 |
49.6 ± 8.7 |
39.6 ± 9.1 |
| AV velocity max (cm/sec) |
376.4 ± 62.2 |
396.4 ± 41.7 |
283.4 ± 33.5 |
| AV gradient max (mmHg) |
69.3 ± 18.7 |
72.9 ± 19.8 |
61.2 ± 11.6 |
| AV gradient mean (mmHg) |
37.9 ± 13.4 |
46.9 ± 5.2 |
29.2 ± 7.5 |
| AV opening area (cm2) |
0.80 ± 0.16 |
0.73 ± 0.13 |
0.84 ± 0.15 |
Table 1 Characteristics of study subjects.
Baseline Transthoracic Echocardiography (TTE) revealed a mean AV pressure gradient (MPG) <40 mmHg in 46 patients (46.6%) corresponding to a LG-AS [1]. On average, LG-AS patients were older and had a higher BMI.
Mean ICU-LOS was 2.6 ± 0.9 days and mean hospital LOS was 6.4 ± 1.2 days without difference for the two subgroups.
TTE was performed on all patients before discharge despite of cardiac symptoms. In no patient, more than of first degree residual prosthesis regurgitation was detectable while mild regurgitation (I°) was observed only in 21 of the 99 patients (21.2%).
Results of all NICaS® measurements for the overall TAVI population are presented in Table 2 while the two subgroups are reported in Table 3 (LG-AS) and Table 4 (NLG-AS).
| Parameters |
Measurement changes compared to baseline |
| Baseline |
6-8 h after TAVI |
P value |
Before discharge (6.4 ± 1.2 days) |
P value |
Resting Heart Rate
(HR); (bpm) |
76.27 ± 16,98 |
77.81 ± 16,51 |
0.31863 |
75.88 ± 17,30 |
0.85089 |
| Resting Respiration Rate (RR); (min) |
18.31 ± 4,54 |
18.91 ± 4,69 |
0,23601 |
18.52 ± 4.87 |
0.75026 |
Stroke Volume
(SV); (mL) |
71.16 ± 23,45 |
63.86 ± 21.73 |
0.00026 |
76.15 ± 24.83 |
0.05104 |
Stroke Index
(SI); (mL/m2) |
36.75 ± 12.31 |
33.87 ± 12.34 |
0.00784 |
40.41 ± 13.41 |
0.01535 |
Cardiac Output
(CO); (L/min) |
5.06 ± 1.86 |
4.84 ± 1.84 |
0.25187 |
5.77 ± 1.57 |
0.00078 |
Cardiac Index
(CI); (L/min/m2) |
2.64 ± 0.89 |
2.58 ± 0.94 |
0.58371 |
3.25 ± 1.05 |
0.000009 |
| Cardiac Power Index (CPI); (w/m2) |
0.53 ± 0.19 |
0.46 ± 0.19 |
0.00107 |
0.64 ± 0.22 |
0.000013 |
| Garnov-Goor-index (GGI); (LVSF) |
11.68 ± 4.19 |
10.48 ± 3.38 |
0.00230 |
13.02 ± 4.22 |
0.00799 |
Total Peripheral Resistance
(TPR); (dn*s/cm5) |
1521.42 ± 546.69 |
1568.27 ± 615.35 |
0.46251 |
1290.33 ± 466.13 |
0.000665 |
Total Peripheral Resistance Index
(TPRI); (dn*s/cm5*m2) |
2821.16 ± 965.68 |
2923.70 ± 1149.9 |
0.39492 |
2403.17 ± 878.98 |
0.001002 |
Systolic Arterial BP;
(mmHg) |
125.69 ± 22.34 |
129.39 ± 22.60 |
0.15477 |
131.77 ± 19.98 |
0.008283 |
diastolic arterial BP;
(mmHg) |
68.68 ± 14.96 |
60.03 ± 12.83 |
0.0000007 |
66.42 ± 12.43 |
0.085448 |
mean arterial BP;
(mmHg) |
87.68 ± 10.01 |
85.75 ± 13.65 |
0.06123 |
87.58 ± 11.90 |
0.35324 |
Basal Impedance
(BI); (ohm) |
361.69 ± 69.68 |
370.14 ± 70.56 |
0.19625 |
348.57 ± 62.09 |
0.021672 |
Significant P values for changes at the two time points after TAVI are outlined in cursive characters.
Table 2: Parameter changes due to early impact after TAVI (6 to 8 hours) and at discharge (6.4 ± 1.2 days) as compared to baseline in the overall patient population.
| Parameters |
Measurement changes compared to baseline |
| baseline |
6-8 h after TAVI |
P value |
before discharge (6.4 ± 1.2 days) |
P value |
Resting heart rate
(HR); (bpm) |
77.33 ± 16.94 |
80.18 ± 17.40 |
0.26663 |
74.59 ± 18.65 |
0.42806 |
| Resting respiration rate (RR); (/min) |
18.65 ± 4.70 |
19.76 ± 5.20 |
0.13605 |
17.87 ± 5.07 |
0.47490 |
Stroke volume
(SV); (mL) |
69.15 ± 23.38 |
63.14 ± 20.55 |
0.01390 |
76.17 ± 23.96 |
0.06725 |
Stroke index
(SI); (mL/m2) |
34.70 ± 12.83 |
32.03 ± 11.44 |
0.06020 |
40.23 ± 13.01 |
0.01779 |
Cardiac output
(CO); (L/min) |
4.98 ± 1.68 |
4.76 ± 1.47 |
0.34177 |
5.82 ± 1.37 |
0.00594 |
Cardiac index
(CI); (L/min/m2) |
2.56 ± 0.75 |
2.52 ± 0.69 |
0.54744 |
3.45 ± 1.15 |
0.00014 |
| Cardiac Power Index (CPI); (w/m) |
0.50 ± 0.18 |
0.44 ± 0.17 |
0.02542 |
0.67 ± 0.24 |
0.00016 |
| Garnov-Goor-Index (GGI); (LVSF) |
10.85 ± 4.11 |
10.26 ± 3.26 |
0.27003 |
13.11 ± 4.70 |
0.00969 |
Total Peripheral Resistance
(TPR); (dn*s/cm5) |
1495.76 ± 437.75 |
1615.42 ± 617.97 |
0.19659 |
1250.39 ± 431.70 |
0.00782 |
Total Peripheral Resistance index
(TPRI); (dn*s/cm5*m2) |
2850 ± 839.31 |
3030.33 ± 1180.19 |
0.32325 |
2378.70 ± 863.48 |
0.00949 |
Systolic arterial BP;
(mmHg) |
125.87 ± 23.70 |
129.27 ± 22.27 |
0.48555 |
131.37 ± 20.87 |
0.09206 |
Diastolic arterial BP;
(mmHg) |
68.59 ± 11.74 |
59.04 ± 12.74 |
0.000031 |
67.98 ± 11.17 |
0.72638 |
Mean arterial BP;
(mmHg) |
87.66 ± 15.73 |
82.45 ± 15.89 |
0.05147 |
89.11 ± 16.91 |
0.53427 |
Basal impedance
(BI); (ohm) |
362.83 ± 58.10 |
375.48 ± 63.66 |
0.23149 |
348.98 ± 60.66 |
0.06036 |
Significant P values for changes at the two time points after TAVI are outlined in cursive characters.
Table 3: Parameter changes due to early impact after TAVI (6 to 8 hours) and at discharge (6.4 ± 1.2 days) as compared to baseline in patients with LG-AS.
| Parameters |
Measurement changes compared to baseline |
| baseline |
6-8 h after TAVI |
P value |
before discharge (6.4 ± 1.2 days) |
P value |
Resting Heart Rate
(HR); (bpm) |
75.36 ± 17.16 |
75.75 ± 15.56 |
0.83089 |
77 ± 16.14 |
0.5192 |
| Resting Respiration Rate (RR); (/min) |
18.02 ± 4.42 |
18.17 ± 4.09 |
0.82669 |
18.34 ± 4.63 |
0.6030 |
Stroke Volume
(SV); (ml) |
72.91 ± 23.59 |
64.49 ± 22.89 |
0.00660 |
76.13 ± 25.79 |
0.3519 |
Stroke Index
(SI); (mL/m2) |
38.53 ± 11.66 |
35.13 ± 13.13 |
0.00784 |
40.57 ± 13.87 |
0.3038 |
Cardiac Output
(CO); (L/min) |
5.12 ± 2.01 |
4.92 ± 2.13 |
0.47314 |
5.73 ± 1.74 |
0.0431 |
Cardiac Index
(CI); (L/min/m2) |
2.70 ± 0.97 |
2.64 ± 1.13 |
0.68184 |
3.08 ± 0.94 |
0.0198 |
| Cardiac Power Index (CPI); (w/m) |
0.55 ± 0.20 |
0.48 ± 0.20 |
0.01853 |
0.62 ± 0.20 |
0.0220 |
| Garnov-Goor-Index (GGI); (LVSF) |
12.40 ± 4.17 |
10.66 ± 3.50 |
0.00249 |
12.94 ± 3.79 |
0.3375 |
Total Peripheral Resistance
(TPR); (dn*s/cm5) |
1543.70 ± 629.56 |
1527.34 ± 616.01 |
0.85352 |
1325 ± 495.56 |
0.0280 |
Total Peripheral Resistance Index
(TPRI); (dn*s/cm5*m2) |
2796.13 ± 1070.74 |
2831.15 ± 1126.16 |
0.82897 |
2424.42 ± 899.92 |
0.0385 |
Systolic Arterial BP;
(mmHg) |
125.57 ± 21.31 |
129.49 ± 23.06 |
0.19501 |
132.11 ± 19.38 |
0.0446 |
Diastolic Arterial BP;
(mmHg) |
68.77 ± 10.97 |
60.89 ± 12.97 |
0.00061 |
65.08 ± 13.40 |
0.0631 |
Mean Arterial BP;
(mmHg) |
87.70 ± 17.09 |
83.75 ± 18.69 |
0.09832 |
87.42 ± 15.57 |
0.5534 |
Basal Impedance
(BI); (ohm) |
360.70 ± 78.91 |
365.51 ± 76.36 |
0.55729 |
348.21 ± 63.88 |
0.1484 |
Table 4: Parameter changes due to early impact after TAVI (6 to 8 hours) and at discharge (6.4 ± 1.2 days) as compared to baseline in patients with NLG-AS.
Impact of TAVI procedure on hemodynamic parameters in the overall population
In the overall population, there was no significant change in resting Heart Rate (HR) resting Respiration Rate (RR) Stroke Volume (SV) diastolic and mean arterial blood pressure (BP) at discharge as compared to baseline. Significant increase was observed for cardiac output (CO), CI, cardiac power index (CPI) and Systolic Arterial Blood Pressure (sBP) as well as reduction of Total Peripheral Resistance (TPR) and Total Peripheral Resistance Index (TPRI) prospectively confirming the results of our recently reported TAVI series. Additionally, the increase of Stroke Index (SI) and Garnov-Goor-index (GGI) and reduction of Basal Impedance (BI) reached statistical significance.
Significant decrease of SV, SI, GGI and diastolic arterial BP (dBP) was obtained 6 to 8 hours after TAVI, when patients were free of inotropics and vasopressors. All of these parameters recovered up to discharge (Table 2).
Impact on change in CI in the LG- and NLG-AS subgroups (primary endpoint)
When comparing discharge to baseline, there was an increase in CI detectable for both TAVI subgroups. CI increased from 2.52 ± 0.75 to 3.45 ± 1.15 L/min/m2 (P=0.00014) in the LG-AS group and form 2.70 ± 0.97 to 3.08 ± 0.94 L/min/m2 (P=0.0198) in the NLG-AS group (Tables 3 and 4, Figure 1). The effect was more pronounced in the LG-AS group than in patients with NLG-AS showing a significant difference between the two groups of 0.52 ± 0.32 L/min/m2 (P = 0.041 for baseline-adjusted between-group comparison at discharge) for the primary endpoint (Figure 2).
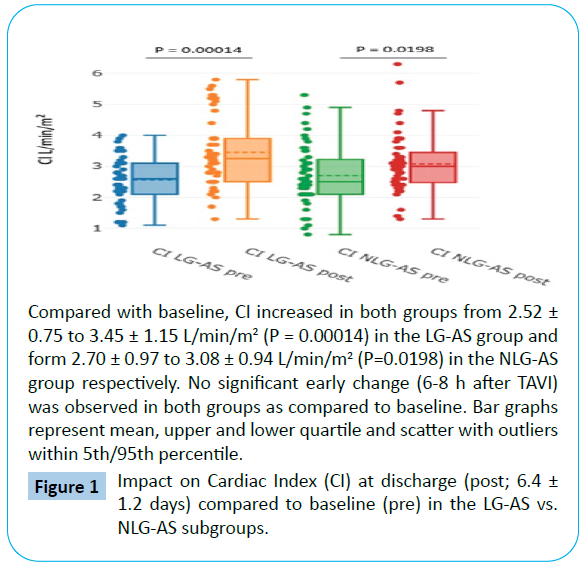
Figure 1: Impact on Cardiac Index (CI) at discharge (post; 6.4 ± 1.2 days) compared to baseline (pre) in the LG-AS vs. NLG-AS subgroups.
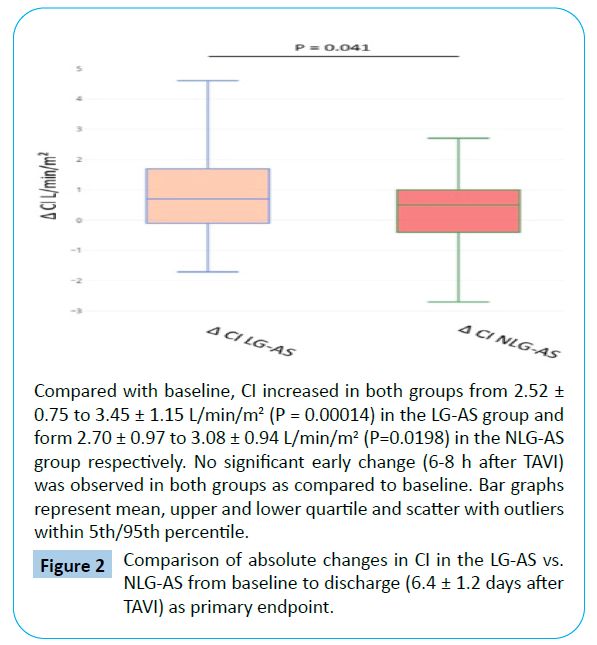
Figure 2: Comparison of absolute changes in CI in the LG-AS vs. NLG-AS from baseline to discharge (6.4 ± 1.2 days after TAVI) as primary endpoint.
Subgroup impact on CO, CPI and GGI
When comparing discharge to baseline, there was a more pronounced increase in CO from 4.98 ± 1.68 to 5.82 ± 1.37 L/ min (P=0.0059) and in CPI from 0.50 ± 0.18 to 0.67 ± 0.24 w/ m2 (P=0.00016) in the LG-AS group with P = 0.037 for CO and P=0.001 for CPI for baseline-adjusted between-group comparison at discharge (Tables 3 and 4, Figures 3 and 4). Interestingly, no significant changes of GGI could be observed in the NLG-AS group and the overall significant effect was mainly driven by an increase in the LG-AS group (10.85 ± 4.11 to 13.11 ± 4.70; P=0.0097) (Figure 5).
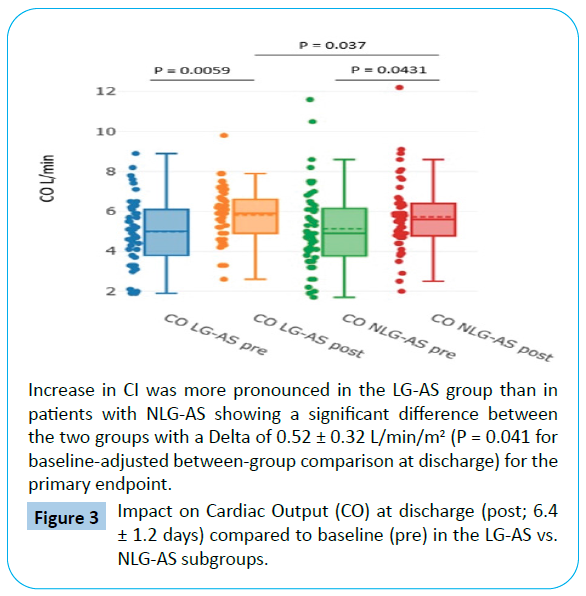
Figure 3: Impact on Cardiac Output (CO) at discharge (post; 6.4 ± 1.2 days) compared to baseline (pre) in the LG-AS vs. NLG-AS subgroups.
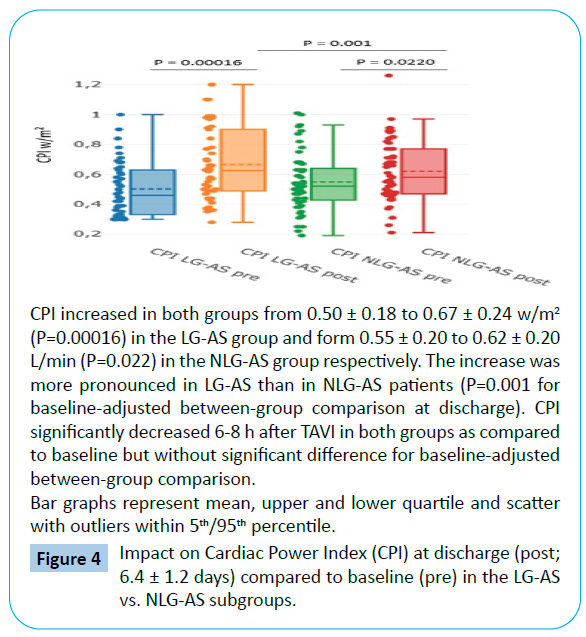
Figure 4: Impact on Cardiac Power Index (CPI) at discharge (post; 6.4 ± 1.2 days) compared to baseline (pre) in the LG-AS vs. NLG-AS subgroups.
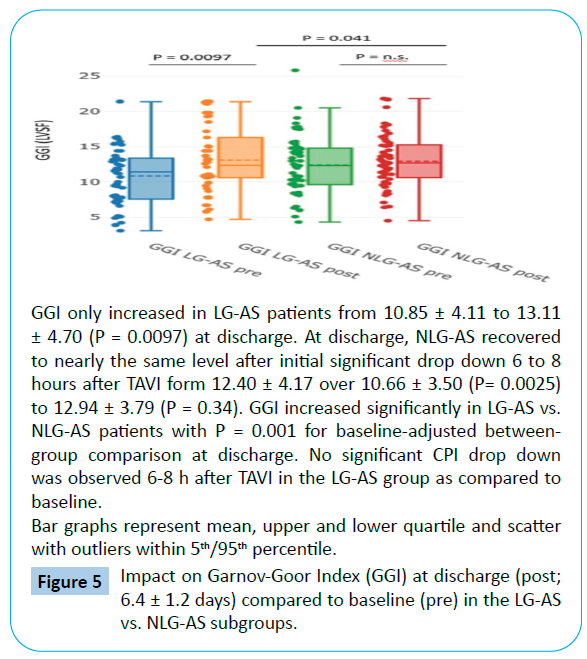
Figure 5: Impact on Garnov-Goor Index (GGI) at discharge (post; 6.4 ± 1.2 days) compared to baseline (pre) in the LG-AS vs. NLG-AS subgroups.
Whereas CO did not change immediately after TAVI (6-8 hours), there was a decrease of CPI in both groups as compared to baseline (P=0.025 for LG-AS and P=0.019 for NLG-AS) but without significant difference for baseline-adjusted between-group comparison.
Early significant decrease in GGI was observed in the NLG-AS group only (P=0.0025) (Tables 3 and 4).
Subgroup impact on TPR and TPRI
TPR and TPRI significantly decrease in both LG-AS and NLG-AS patients when compared to baseline (Tables 3 and 4). This effect was more pronounced in the LG-AS with a TPR decrease from 1495.76 ± 437.75 to 1250.39 ± 431.70 dynes*s/cm5 (P=0.0078) corresponding to a total peripheral resistance index TPRI decrease from 2850 ± 839.31 to 2378.70 ± 863.48 dynes*s/cm5/ m2 (P=0.0095) at discharge compared to baseline with P = 0.014 for TPR and P=0.019 for TPRI for baseline-adjusted betweengroup comparison at discharge (Figures 6 and 7).
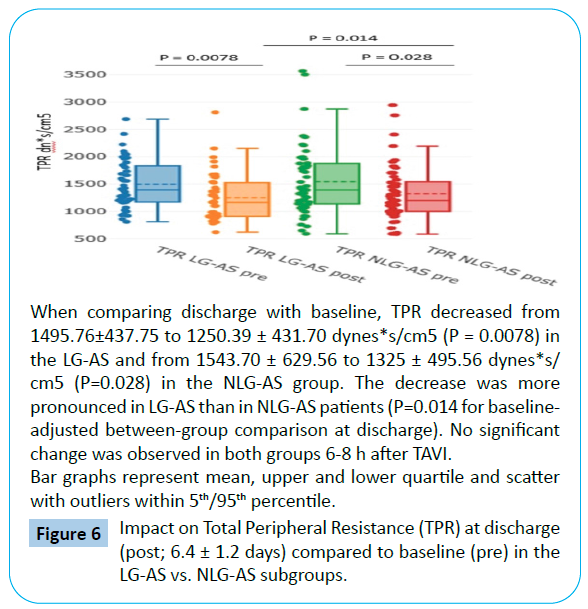
Figure 6: Impact on Total Peripheral Resistance (TPR) at discharge (post; 6.4 ± 1.2 days) compared to baseline (pre) in the LG-AS vs. NLG-AS subgroups.
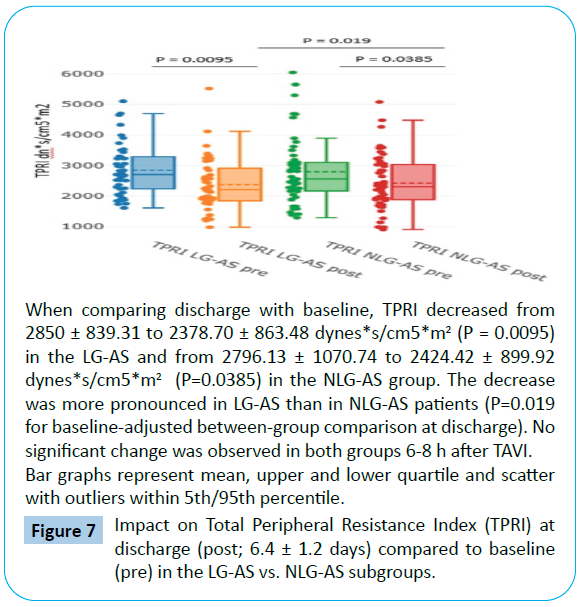
Figure 7: Impact on Total Peripheral Resistance Index (TPRI) at discharge (post; 6.4 ± 1.2 days) compared to baseline (pre) in the LG-AS vs. NLG-AS subgroups.
No early changes were detectable for same day after TAVI (6-8 hours) results in both subgroups (Tables 2-4).
Subgroup impact on SV and SI
SI did significantly improve in LG-AS patients at discharge as compared to baseline (34.70 ± 12.83 to 40.23 ± 13.01 mL/m2; P=0.018) with only a numerical increase of SV. In NLG-AS, SV and SI only recovered to nearly the same level.
Immediately after TAVI (6-8 hours), significant decrease in SV and SVI was observed in the NLG-AS group, while impact on these parameters was not so pronounced (SV) or insignificant (SVI) in the LG-AS group (Tables 3 and Table 4).
Impact on BP
In the overall population, there was only significant changes of sBP on non-invasive BP readings detectable at discharge compared to baseline with an increase of systolic values from 125.69 ± 22.34 to 131.77 ± 19.98 (P=0.008) (Table 2). This effect was mainly driven by the increase in the NLG-AS group (125.57 ± 21.31 to 132.11 ± 19.38; P=0.045).
While changes in dBP were not significantly different in both groups from baseline to discharge, dBP decreased in both groups immediately after TAVI procedure (Tables 3 and 4).
Changes in left ventricular ejection fraction
Left ventricular ejection fraction (LVEF) results obtained with the Simpson´s method were available from TTE in all patients at baseline and at discharge. While overall baseline LVEF was 46.3 ± 9.4%, LG-AS patients had significant lower LVEF than NLG-AS patients (38.3 ± 5.1% vs. 54.2 ± 8.7%, P=0.013). When comparing discharge to baseline, there was no significant change in the LVEF for the two subgroups with a not mentionable numerical decrease in the NLG-AS group and a slight numerical increase in the LG-AS group (Table 5).
| Parameters |
All patients scheduled to TAVI procedure |
Patients with NLG-AS |
Patients with LG-AS |
P value NLG/LG |
| Subjects (n) |
99 (100 %) |
53 (53.5%) |
46 (46.5%) |
|
| LVEF (%)baseline |
46.3 ± 9.4 |
54.2 ± 8.7 |
38.3 ± 5.1 |
0.013 |
| LVEF (%) at discharge (6.4 ± 1.2 days) |
47.6 ± 10.2 |
52.8 ± 9.4 |
42.6 ± 6.5 |
0.026 |
| P value pre/post |
0.673 |
0.231 |
0.096 |
|
Table 5: Changes of Left Ventricular Ejection Fraction (LVEF) after TAVI at discharge (6.4 ± 1.2 days) as compared to baseline in the overall patient’s population and for the two subgroups (NLG- and LG-AS).
Impact on QoL in a subgroup of the overall patients´ collective (n= 41) at 3 months follow-up
41 of 48 patients (85.42%) completed the EQ-5D-5L questioner for baseline and at 3 months follow-up. Three patients died within the 3 months follow-up and four patients refused to provide phone call based information.
Baseline EQ-5D-5L Score was 53.05 ± 17.87 with an overall increase to 60.61 ± 16.29 (P=0.0046) at 3 months. (Figure 8a) Increase in EQ-5D-5L Score of ≥ 5 point was documented in 27 of the 41 obtained reports at 3 months. Only four patients reported deterioration of ≥ 5 points while 10 remained unchanged (0 to + 4 points) (Figure 8b). However, the seven patients should be considered for analysis as non-survivors (n=3) and by assuming deterioration for those refused to report on QoL (n=4).
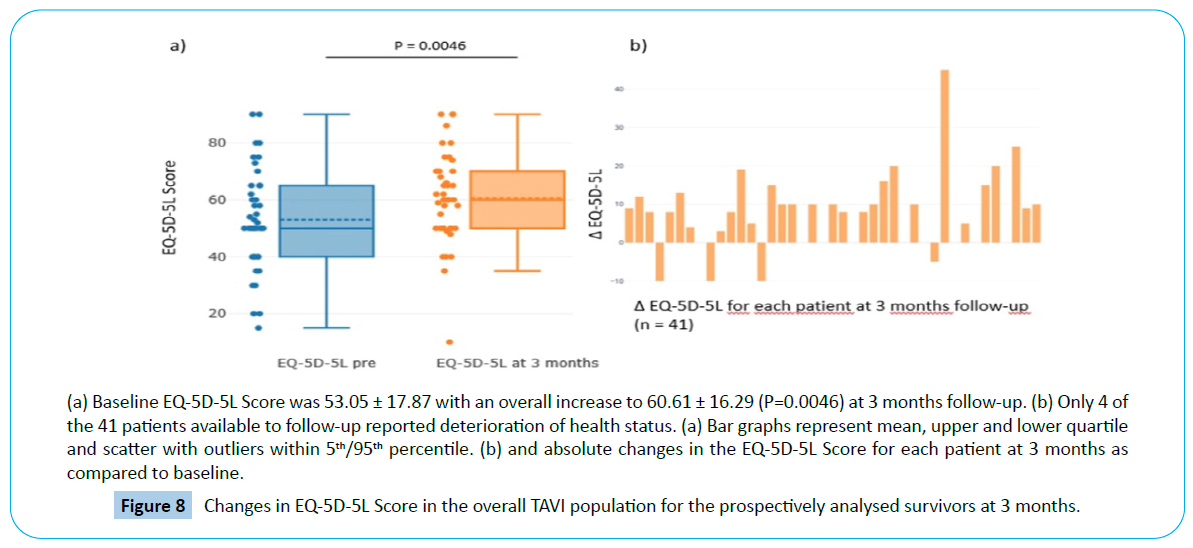
Figure 8: Changes in EQ-5D-5L Score in the overall TAVI population for the prospectively analysed survivors at 3 months.
We do not report on subgroup analysis for LG- and NLG-patients due to less than half of the overall patients available to baseline and 3 months follow-up reports. Nevertheless, two of the four deteriorated patients had an LG-AS (MPG 32 and 30 mmHg) and the other two NLG-AS (MPG 46 and 49 mmHg). This was also the case for the four patients refusing to provide information on phone call (n=2, MPG 30 and 36 mmHg; n=2, MPG 48 and 58 mmHg). Two of the three non-survivors belonged to the LGAS group (MPG 35 and 30 mmHg) and one to the NLG-AS-group (MPG 52 mmHg).
Discussion
Although beneficial TAVI outcomes are reported throughout the whole spectre of heterogeneous groups summarized under the term “severe symptomatic AS”, little is known about their baseline circulatory characteristics or post-procedural and long term hemodynamic treatment response [7,8]. Several investigations reported on impact of either LG or Low Flow (LF) parameters as well as impaired LVEF on outcomes after TAVI. Nevertheless, outcome data remain partly inconsistent when based on TTE measurements alone or when taking only one of such subgroup-defining criteria into account [17-20]. Thus, providing individualized information on various hemodynamic parameters in AS might give additional information for patients´ selection and post-procedural management thereby defining subgroups that might benefit most.
The present series was designed to prospectively illustrate the impact on various haemodynamic parameters immediately after treatment and before discharge compared to patients’ baseline status and to discriminate possible differences in LG-AS and NLGAS with primary focus on changes in CI as primary endpoint.
The present results revealed an increase in CO, CI and CPI and reduction in TPR and TPRI as a positive hemodynamic response in the overall TAVI population. Additionally, there was an increase in Stroke Index (SI) and Garnov-Goor-index (GGI) - as a correlate for LV systolic function.
By defining the LG-AS group based on a MPG cut-of-consensus of <40 mmHg at baseline TTE, significant increase in CI was observed in both TAVI subgroups at discharge. The effect was more pronounced in the LG-AS group with a significant difference between the groups of 0.52 ± 0.32 L/min/m2 (P=0.041 for baseline-adjusted between-group comparison at discharge) for the primary endpoint.
At discharge, LG-AS patients showed correspondingly higher increase in CO, CPI and a more pronounced decrease of Total Peripheral Resistance (TPR) and Total Peripheral Resistance Index (TPRI) as secondary parameters. Moreover, SVI and GGI did only significantly improve in LG-AS patients at discharge as compared to baseline, while in NLG-AS patients both parameters recovered to nearly the same level. Immediately after TAVI at a time when patients were at stabile conditions not requiring inotropic or vasopressor support, significant decrease in SV SVI CPI and GGI was observed in NLG-AS, while impact on these parameters was not so pronounced (SV, CPI) or insignificant (SVI, GGI) in LG-AS.
Causal increase in myocardial function and pro-adaptive haemodynamic changes are expectable in TAVI but difficult to be representatively illustrated. On the other hand, periprocedural stressors, filling status and temporary periprosthetic regurgitation may negatively affect contractility and early postprocedural circulatory response in a different manner. Thus, such subgroup-specific characteristics of baseline status and - more important - different post-procedural circulatory adaptation may contribute to different outcomes. Eleid and co-workers focused on prognostic impact of stroke volume, gradient, and ejection fraction as individual baseline parameters in a large Meta-analysis of 16 TAVI studies [7]. In conclusion, low SI, LG, and low LVEF at baseline were each associated with higher 1-year mortality after TAVI. Although not representative, two of three of our non-survivers at 3 month QoL follow-up matched such baseline criteria with both LG and low LVEF as well as low SI.
Nevertheless, there is little insight, how parameters like SI CI or TPRI change after TAVI and whether and how changes may affect outcomes. Our data analysis revealed such different circulatory impact for LG- and NLG-AS patients after TAVI while both groups did not show early LVEF changes. Interestingly, LG-AS patients showed more pronounced circulatory recovery at discharge and blander early negative impact of peri-procedural stressors. It suggests that relief of flow resistance and pressure overload might be more important to early readjust circulation in LG-AS independently of changes in LVEF. Hence, increase in SI CPI and GGI might better reflect mobilisation of myocardial contractile reserve eventually resulting in down regulation of maladaptively activated intrinsic catecholamines and Renin-Angiotensin- Aldosterone-System (RAAS) corresponding to an increase in CI and decrease in TPRI.
Taking into account that all of our non-survivors and deteriorated patients at 3 months QoL follow-up did not improve due to CI SI CPI and TPRI, further investigations should be designed to focus on possible importance of such criteria for early post-procedural management, tailored medication, discharge planning and long term ambulatory outcomes.
Conclusion
NICaS® monitoring represents an accurate non-invasive bedsidetool for discriminating adaptive circulatory changes in subgroups of unselected patients subjected to TAVI. LG-AS patients seem to show more effective early hemodynamic recovery after procedure. Whether a measurement-guided approach might be used for tailored peri-procedural management and could have long-term prognostic influence remains to be elucidated.
Study Limitations
Even though our observation is consistent with expectable results in TAVI patients, one of our limitations is the observational design in a small cohort of patients. Therefore, larger trials are warranted to confirm our findings and to show whether there is prognostic relevance for long term outcomes of the different subgroups. There were few changes in baseline oral cardiovascular medication during in-hospital stay and 9 patients required application of intravenous diuretics after TAVI procedure (Table 6). Nevertheless, our observation was designed to describe subgroup changes based on established in-hospital periprocedural patients management, not guided and influenced by the NICaS® measurements.
| Changes in oral medication |
Newly prescribed oral medication |
| Beta-blockers |
n= 8 (8.08%) |
| Bisoprolol |
6 (6.06%) |
| Metoprolol |
2 (2.02%) |
| Angiontensin converting enzyme antagonists |
n= 6 (6.06%) |
| Ramipril |
5 (5.05%) |
| Perindopril |
1 (1.01%) |
| Angiotensin receptor blockers |
n= 4 (4.04%) |
| Candesartan |
3 (3.03%) |
| Valsartan |
1 (1.01%) |
| Diuretics |
n= 9 (9.09%) |
| Torasemide |
6 (6.06%) |
| Hydrochlorothiacide |
3 (3.03%) |
| Mineralocorticoid-receptor antagonists |
n= 5 (5.05%) |
| Spironolactone |
3 (3.03%) |
| Eplerenone |
2 (2.02%) |
| Sacubitril/Valsartan |
n = 2 (2.02%) |
| |
Discontinued oral medication |
| Beta-blockers |
n= 6 (6.06%) |
| Bisoprolol |
3 (3.03%) |
| Nebivolol |
1 (1.01%) |
| Metoprolol |
2 (2.02%) |
| Angiontensin converting enzyme antagonists |
n= 4 (4.04%) |
| Ramipril |
3 (3.03%) |
| Lisinopril |
1 (1.01%) |
| Calcium channel blockers |
n= 2 (2.02%) |
| Amlodipine |
2 (2.02%) |
| |
Dose modification |
| Beta blockers |
n= 8 (8.08%) |
| Bisoprolol up-titration |
2 (2.02%) |
| Bisoprolol down-titration |
2 (2.02%) |
| Nebivolol up-titration |
1 (1.01%) |
| Metoprolol down-titration |
3 (3.03%) |
| Calcium channel blockers |
n= 6 (6.06%) |
| Amlodipine down-titration |
4 (4.04%) |
| Lercanidipine up-titration |
2 (2.02%) |
| Transient use of intravenous diuretics after TAVI |
| Furosemide |
n=9 (9.09%) |
(for a maximum of 3 days after TAVI) |
Table 6: Changes in cardiovascular medication during in hospital stay (n= 99 patients; 100%).
Acknowledgements
Not Applicable.
39611
References
- Baumgartner H, Falk V, Bax JJ, De Bonis M, Hamm CH, et al. (2017) ESC/EACTS Guidelines for the Management of Valvular Heart Disease. Eur Heart J 38: 2739-2791.
- Nishimura RA, Otto CM, Bonow RO, Carabello BA, Erwin JP, et al. (2017) AHA/ACC Focused Update of the 2014 AHA/ACC Guideline for the Management of Patients With valvular Heart Disease: A Report of the American College of Cardiology/American Heart Association Task Force on Clinical Practice Guidelines.. Circulation 135: e1159-95.
- Smith CR, Leon MB, Mack MJ, Miller DC, Moses JW, et al. (2011) Transcatheter versus surgical aortic-valve replacement in high-risk patients. N Engl J Med 364: 2187-2198.
- Leon MB, Smith CR, Mack M, Miller DC, Moses JW, et al. (2010) Transcatheter aortic-valve implantation for aortic stenosis in patients who cannot undergo surgery. NEJM 363: 1597-1607.
- Vendrik J, Van Kesteren F, Van Mourik MS, Piek JJ, Tijssen JG, et al. (2018) Procedural Outcome and Midterm Survival of Lower Risk Transfemoral Transcatheter Aortic Valve Implantation Patients Treated With the SAPIEN XT or SAPIEN 3 Device. Am J Cardiol 121: 856-861.
- Waksman R, Rogers T, Torguson R, Gordon R, Ehsan A, et al. (2018) Transcatheter Aortic Valve Replacement in Low-Risk Patients with Symptomatic Severe Aortic Stenosis. J Am Coll Cardiol 72: 2095-2105.
- Eleid MF, Goel K, Murad MH, Erwin PJ, Suri RM, et al. (2015) Meta-analysis of the prognostic impact of stroke volume, gradient, and ejection fraction after transcatheter aortic valve implantation. Am J Cardiol 116: 989-994.
- O'Sullivan CJ, Stortecky S, Heg D, Pilgrim T, Hosek N, et al. (2013) Clinical outcomes of patients with low-flow, low-gradient, severe aortic stenosis and either preserved or reduced ejection fraction undergoing transcatheter aortic valve implantation. Eur Heart J 34: 3437-3450.
- Cotter G, Moshkovitz Y, Kaluski E, Cohen AJ, Miller H, et al. (2004) Accurate, noninvasive continuous monitoring of cardiac output by whole-body electrical bioimpedance. Chest 125: 1431-1440.
- Torre-Amione G, Milo O, Kaluski E, Cohen AJ, Miller H, et al. (2004) Whole-body electrical bio-impendance is accurate in non-invasive determination of cardiac output: A thermodilution controlled, prospective, double blind evaluation. J Card Fail 10: S38-S39.
- Paredes OL, Shite J, Shinke T, Watanabe S, Otake H, et al. (2006) Impedance cardiography for cardiac output estimation: reliability of wrist-to-ankle electrode configuration. Circ J 70: 1164-1168.
- Tanino Y, Shite J, Paredes OL, Shinke T, Ogasawara D, et al. (2009) Whole body bioimpedance monitoring for outpatient chronic heart failure follow up. Circ J 73: 1074-1079.
- Taniguchi Y, Emoto N, Miyagawa K, Nakayama K, Kinutani H, et al. (2013) Noninvasive and simple assessment of cardiac output and pulmonary vascular resistance with whole-body impedance cardiography is useful for monitoring patients with pulmonary hypertension. Circ J 77: 2383-2389.
- Markus B, Karatolios K, Wulle C, Pethig D, Rastan A, et al. (2019) Periprocedural noninvasive hemodynamic monitoring in TAVI patients. Potential impact on patient selection and outcome prediction. Arch Med 11: 298
- Balestroni G, Bertolotti G (2012) [EuroQol-5D (EQ-5D): an instrument for measuring quality of life]. Monaldi Arch Chest Dis 78: 155-159.
- Ludwig K, Graf Von der Schulenburg JM, Greiner W (2018) German Value Set for the EQ-5D-5L. Pharmacoeconomics 36: 663-674.
- Ewe SH, Ajmone MN, Pepi M, Delgado V, Tamborini G, et al. (2010) Impact of left ventricular systolic function on clinical and echocardiographic outcomes following transcatheter aortic valve implantation for severe aortic stenosis. Am Heart J 160: 1113-1120.
- Gotzmann M, Rahlmann P, Hehnen T, Müller P, Lindstaedt M, et al. (2012) Heart failure in severe aortic valve stenosis: Prognostic impact of left ventricular ejection fraction and mean gradient on outcome after transcatheter aortic valve implantation. Eur J Heart Fail 14: 1155-1162.
- Elhmidi Y, Piazza N, Krane M, Deutsch MA, Mazzitelli D, et al. (2014) Clinical presentation and outcomes after transcatheter aortic valve implantation in patients with low flow/low gradient severe aortic stenosis. Catheter Cardiovasc Interv 84: 283-290.
- Barbash IM, Minha S, Ben-Dor I, Dvir D, Magalhaes MA, et al. (2014) Relation of preprocedural assessment of myocardial contractility reserve on outcomes of aortic stenosis patients with impaired left ventricular function undergoing transcatheter aortic valve implantation. Am J Cardiol 113: 1536-1542.