Keywords
Electrospinogram; Autonomic nervous system; Hepatotoxicity; Signal recording; Non-invasive method; CCl4; Liver stimulation
Introduction
The autonomic nervous system is a group of afferent (sensory) and efferent (motor) neurons that link the CNS (Central nervous system) with visceral effectors. The two efferent branches of the autonomic nervous system are the sympathetic and parasympathetic branch. They consist of parallel and differentially regulated pathways made up of cholinergic neurons (preganglionic neurons). The cholinergic neurons set within the CNS that innervate ganglia (for example, para- or pre-vertebral sympathetic ganglia), glands (adrenal glands) or neural networks of varying complexity (enteric or cardiac ganglionic networks) located outside the CNS [1,2]. These peripheral ganglia and networks contain the motor neurons (ganglionic neurons) that control smooth muscles and other visceral targets. The sympathetic ganglionic neurons that control cardiovascular targets are primarily noradrenergic [3].
The connection between the autonomic nervous system and gastrointestinal (GI) tract and the role of the autonomic nervous in the liver function has been described before [4]. The liver is affected by both the sympathetic and the parasympathetic nerve systems. These nerve systems modulate information regarding hepatic osmolality, glucose concentrations, and lipid concentrations from the brain through the afferent neurons, and the liver receives varieties of signals including blood flow, bile secretion, and metabolism through the efferent neurons [4-9].
In case of disorder in liver activity, there is different signal transduction into and to the brain to make a different action to prevent disease occurrence and reduce symptoms by supplying the deficiency in liver functions [10,11].
Liver tissue has high regenerative capacity in response to damaging stimuli such as viral infections, chemicals and alcohol intoxication. Recent researches use carbon tetrachloride CCl4 as a hepatotoxicity drug leads to an acute and reversible liver damage [12,13].
The classic toxicity of carbon tetrachloride (CCl4) is to induce liver lesion and liver fibrosis. Liver fibrosis is the excessive accumulation of extracellular matrix proteins including collagen wasn’t normally excised and it makes the hepatocytes function reduced that occurs in most types of chronic liver diseases, which can progress into liver cirrhosis even hepatocarcinoma (liver cancer). We identify the liver activity and the stage of liver injury by measure a quantity of specific components in blood like Aspartate transaminase (AST), Alanine transaminase (ALT) and total Albumin protein level, this done by a specific test described in material and method section.
Classification of central nervous system signals recorded using different techniques, such as electrospinogram, electroencephalography or magneto encephalography per different signal produced from the nervous system parts, is a job present in many biomedical situations, like, for example, brain– computer interface design [14-17].
The electrospinogram is a device used to record the electrical signal from the spinal cord my measuring the potential difference between two points and we use it to diagnose the autonomic disorder by comparing the different signals produced in normal and diseased one [18].
The electrical signal produced from spinal cord is not only specific for autonomic activity, it’s a group of information from the brain to different body organs and muscles to control movement. So, to get the autonomic signal only we must block somatic signals by using anesthesia mixed drug (Ketamine xylazine mix) [19,20].
Materials and Methods
Animals and animal treatment. 12 male Wister albino rats were fed with pellets of standard diet and water was provided Ad libitum with weight 100-120 g divided into four groups 3 rats for each group. Group 1 (control injected intraperitoneal “I.P.” for 2 weeks daily by olive oil 3 ml/Kg), group 2 (control injected I.P. for 4 weeks daily by olive oil 3 ml/Kg), group 3 (injected I.P. for 2 weeks daily by CCl4 and olive oil with ratio 1:1 3 ml/Kg) and group 4 (injected I.P. for 4 weeks daily by CCl4 and olive oil with ratio 1:1 3 ml/Kg).
Animal Anesthesia. Administration of ketamine (100 mg/kg)/ xylazine (10 mg/kg) anesthesia (KX) by I.P. injection in five minutes before recording. The animals remained anesthetized throughout the entire duration of the study, typically from 45 to 60 minutes per animal weight.
Signal recording. After anesthesia, the animal was held and cleaned its back to keep the electrode in contact to the skin. Then the potential difference between the ends of specific segment was recorded, which responsible for liver innervation (T7-T12), with respect to ground electrode as shown in Figure 1. Connect the electrodes with PS-2111 sensor which used to detect the potential difference variation as electrical signal pattern, then record it by using GLX 2002 interface, the signal pattern was a relation between potential difference in mV with time.
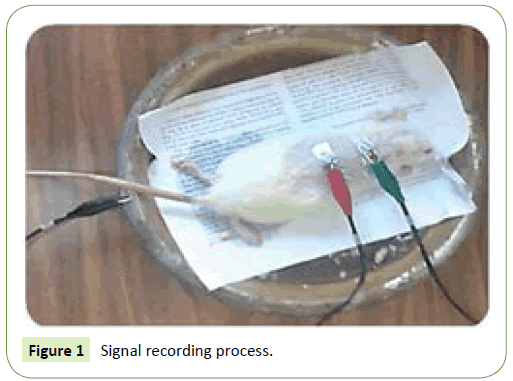
Figure 1: Signal recording process.
Blood collection. A blood collected from Lateral Tail Vein by Attach a butterfly catheter to the syringe and inject the sharp tip and get a blood sample (Figure 2), then put it into tube contain heparin solution to prevent the clot formation [21].
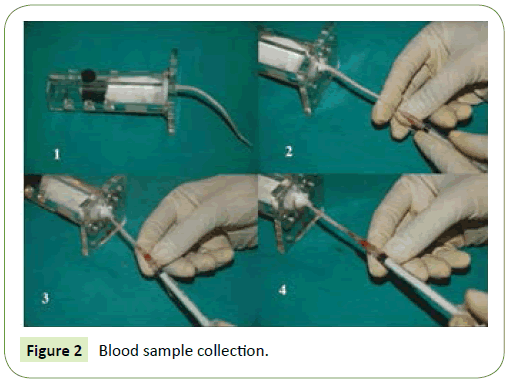
Figure 2: Blood sample collection.
Measurement of liver function. After blood sample collection, the liver activates of critical enzymes were measured as Aspartate transaminase (AST) and Alanine transaminase (ALT), and total protein albumin level to identify the stage of liver injury. The amount of AST enzyme determined by using diagnostic kit “Sigma-MAK052” and the amount of ALT enzyme by using “Sigma-MAK055” in spectrophotometric technique, the total protein albumin level was determined by using “Sigma-MAK124” kit by the same technique. This experiment was done for each group and then we tabulate the results to describe the variations done.
Results and Discussion
The liver function tests for the four groups described in Table 1. The liver tests were done by measuring the quantity of specific enzymes and proteins which used to show the liver activity then to specify the stage of liver injury.
| Test |
Group 1 |
Group 2 |
Group 3 |
Group 4 |
unit |
| AST |
56 ± 3 |
125 ± 2 |
268 ± 4 |
333 ± 5 |
U/l |
| ALT |
48 ± 2 |
47 ± 2 |
80 ± 2 |
108 ± 2 |
U/l |
| Albumin |
3.1 ± .1 |
3.4 ± .2 |
3.2 ± .2 |
2.5 ± .1 |
g/dl |
| AST/ALT |
1.17 |
2.66 |
3.35 |
3.1 |
Unit less |
Table 1: Liver Function tests for the four groups
The measurement of (AST), (ALT) and Albumin level quantity are used to describe the liver activity and the stage of hepatocytes injury. In case of normal liver function, the ratio between AST/ ALT is within the range from 1 to 3 and in disfunction case, the ratio of AST to ALT are increased. But there are no changes in albumin level in blood in case of control groups (group 1, 2) and treated groups (group 3, 4). Table 1 shows that, the group 1 (2 weeks daily injection by olive oil 3 ml/Kg) had a normal level of AST and ALT. AST/ALT ratio is less than 2, this means that the group 1 animals have a healthy liver with a high performance. Group 2 (4 weeks daily injection by olive oil 3 ml/Kg) had a little raising in AST and ALT levels. AST/ALT ratio is less than 3, this indicates a cholesterol deposition on liver tissue because of the lepidic effect of Olive oil on liver tissue. This ratio still within the range of the normal but with less performance. Group 3 (2 weeks daily injection by CCl4 and olive oil with ratio 1:1, 3 ml/Kg) had a high level of ALT and AST, and the AST/ALT ratio is more than 3. This indicates high effect of CCl4 with olive oil on liver tissue resulting a liver fibrosis. For group 4 (4 weeks daily injection by CCl4 and olive oil with ratio 1:1, 3 ml/Kg), the level of AST and ALT increases, and the small reduction in AST/ALT ratio indicates the human body starts to regenerate a liver tissue again but it is not enough to recover the liver damage. So, CCl4 has a high effect on liver tissue function and this produces liver injury with high rate.
After verification of liver function variations for each group, the electrospinograph is measured for the four groups showing the major features of repetitive signal with duration time 0.1 sec, as shown in Figure 3. The electrospinograph is a spectrum of electrical signal (the potential difference with time) recorded from the spinal cord of each group, which had some changes between each group.
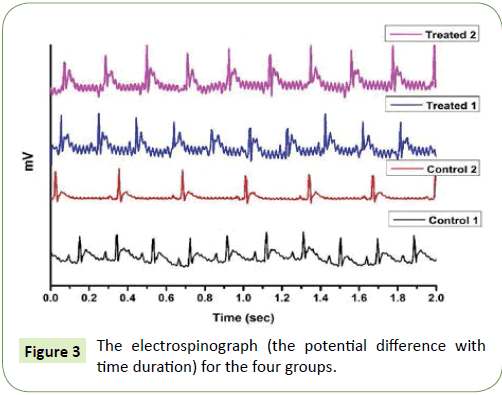
Figure 3: The electrospinograph (the potential difference with time duration) for the four groups.
Figure 4 illustrates the electrospinograph of group 1 (control 1) with the characteristic peaks for the signal. The signal showed the shape of the three peaks A, B and C, which are very smooth and the periodic time of each signal is 0.1 sec. This indicates the electrospinograph of normal liver tissue function and there is no injury effect on liver tissue as such. In Figure 5, the electrospinograph of group 2 (control 2) showed small change on peak A of the signal comparing to the electrospinograph of group 1 (control 1). This signal variation in peak A is due to the effect of olive oil which makes the lipidimic liver stage and it is very earlier stage of liver fibrousis.
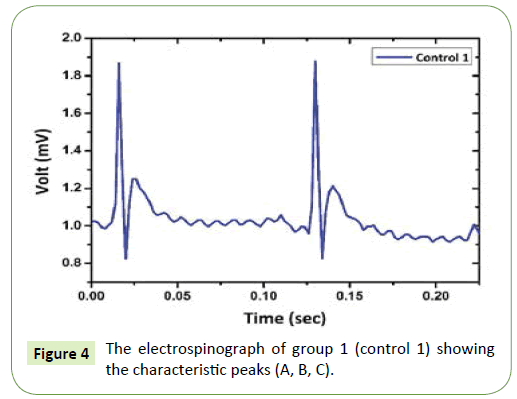
Figure 4: The electrospinograph of group 1 (control 1) showing the characteristic peaks (A, B, C).
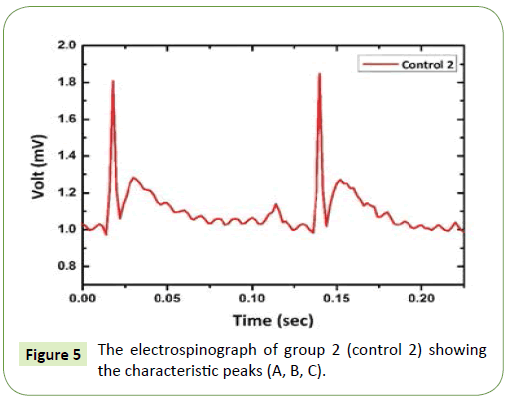
Figure 5: The electrospinograph of group 2 (control 2) showing the characteristic peaks (A, B, C).
The electrospinograph of group 3 (treated 1) were shown in Figure 6. The periodic time was not changed (0.1 sec), but there is a splitting in peak A and a small reduction in peak B. This indicate that the effect of CCl4 with olive oil on liver tissue function can be detected by made these variations in the characteristic peaks. This relation between the electrical signal from the spinal cord with the liver function can show the liver fibrosis stage and be detected by just naked eye. The spliting in peak A shows the accumulation of collagen in liver tissue and produce a fibroblasts in liver tissue. This cell type (fibroblasts) has a different signal communication with the brain from the hepatocytes. The fibroblast maturates into fibrocytes which will need more collagen formation and accumulation and this makes a high effect on albumin or glycogen formation level which finally leads to a liver fibrosis.
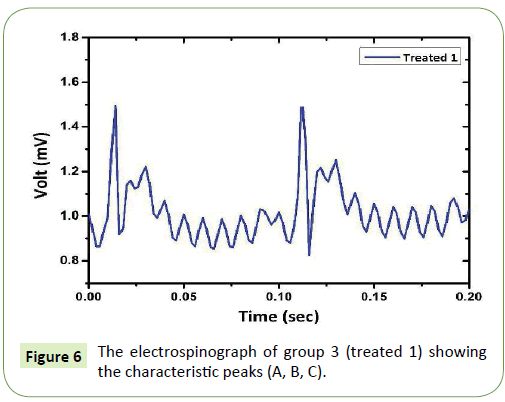
Figure 6: The electrospinograph of group 3 (treated 1) showing the characteristic peaks (A, B, C).
Figure 7, shows the electrospinograph of group 4 (treated 2), which injected for 4 weeks. The periodic time mainly was the same 0.1 sec for each signal peak. The splitting in peak A exists which came from the effect of CCl4 and olive oil on liver tissue. In addition to that, a small reduction in peak C. This changes mainly came from reduction in normal protein sensation and production which result a high fibrocyte formation and destruction of hepatocytes.
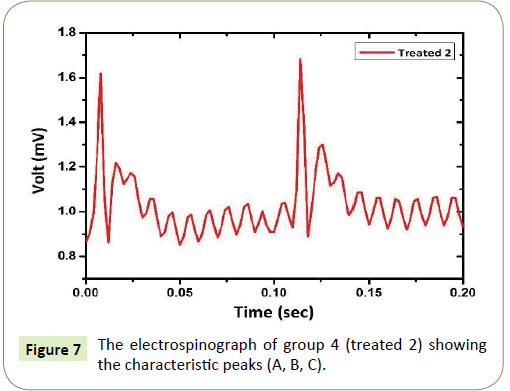
Figure 7: The electrospinograph of group 4 (treated 2) showing the characteristic peaks (A, B, C).
Conclusion
The results of this study demonstrate that there is a relation between the electrical signal recorded by non-invasive method like electrospinography. This method detects this signal from the skin surface of vertebral column and the autonomic organ activity, like the liver, and diagnoses it fast with earlier stage of disease. The electrical signal results from liver disfunction indicates the critical relation between CNS and gastrointestinal organs. The future work will aim to diagnose all gastrointestinal organs diseases by using the Electrospinography. Then finding a way to treat some internal diseases by making small modifications on the sensory or motor electrical signal of the brain resulting in returning the organ function into normal case.
Acknowledgment
The authors need to thank the academy of scientific research and technology for funding this work.
20767
References
- Blessing W (1997) The lower brainstem and bodily homeostasis. Oxford Univ. Press, New York, USA.
- Loewy AD, Spyer KM (1990) Central regulation of autonomic functions. Oxford Univ Press New York, USA.
- Guyenet PG (2006) The sympathetic control of blood pressure. Nature Reviews Neuroscience 7: 335-346.
- Greenwood-Van Meerveld B, Prusator DK, Johnson AC (2015) Animal models of gastrointestinal and liver diseases. Animal models of visceral pain: Pathophysiology, translational relevance, and challenges. Am J Physiol Gastrointest Liver Physiol 308: 885-903.
- Saha JK, Xia J, Grondin JM, Engle SK, Jakubowski JA (2005) Acute hyperglycemia Induced by ketamine/xylazine anesthesia in rats: Mechanisms and implications for preclinical models. J Biosci Biotechnol Discov 230: 777-784.
- Fausto N (2004) Liver regeneration and repair: Hepatocytes, progenitor cells, and stem cells. J Hepatol. pp: 1477-1487.
- Shafritz DA, Dabeva MD (2002) Liver stem cells and model systems for liver repopulation. J Hepatol 36: 552-564.
- Serini G, Gabbiani G (1999) Mechanisms of myofibroblast activity and phenotypic modulation. Exp Cell Res 250: 273-283.
- Jensen KJ, Alpini G, Glaser S (2013) Hepatic nervous system and neurobiology of the liver. Compr Physiol 3: 655-665.
- Yi CX, La Fleur SE, Fliers E, Kalsbeek A (2010) The role of the autonomic nervous liver innervation in the control of energy metabolism. Biochim Biophys Acta 1802: 416-431.
- Mizuno K, Ueno Y (2017) Autonomic nervous system and the liver. Hepatol Res 47: 160-165.
- Bernacchi AS, De Castro CR, De Ferreyra EC, Villarruel MC, Fernández G, et al. (1983) Carbon tetrachloride-induced liver injury in the rabbit. Br J Exp Path 64: 261-267.
- Weber LW, Boll M, Stampf A (2003) Hepatotoxicity and mechanism of action of haloalkanes: Carbon tetrachloride as a toxicological model. Crit Rev Toxicol 33: 105-136.
- Vidaurre D, Rodríguez EE, Bielza C, Larrañaga P, Rudomin P (2012) A new feature extraction method for signal classification applied to cord dorsum potential detection. J Neural Eng pp: 1-11.
- Dong S, Hu Y, Du W, Tao W, Zhang X, et al. (2012) Changes in spontaneous dorsal horn potentials after dorsal root entry zone lesioning in patients with pain after brachial plexus avulsion. J Int Med Res 40: 1499-1506.
- Madden KS Sympathetic neural-immune interactions regulate hematopoiesis, thermoregulation and inflammation in mammals. Dev Comp Immunol 66: 92-97.
- Vidaurre D, Rodríguez EE, Bielza C, Larrañaga P, Rudomin P (2012) A new feature extraction method for signal classification applied to cord dorsum potential detection. J Neural Eng pp: 9.
- Qin L, Ding L, He B (2004) Motor imagery classification by means of source analysis for brain–computer interface applications. J Neural Eng 1: 135-141.
- Lotte F, Congedo M, L´ecuyer A, Lamarche F, Arnaldi B (2007) A review of classification algorithms for EEG-based brain–computer interfaces. J Neural Eng pp: 4.
- Ten Cate J (1950) Spontaneous electrical activity of the spinal cord. Clin Neurophysiol 2: 445-451.
- Parasuraman S, Raveendran R, Kesavan R (2010) Blood sample collection in small laboratory animals. J Pharmacol Pharmacother 1: 87-93.
