Keywords
Melamine; Magnetic molecularly imprinted polymer; Fe3O4@ SiO2; Recognition character; HPLC
Introduction
Melamine (2,4,6-Triamino-s-triazine, MEL) is an important chemical widely used in the production of melamine resins, which are used in laminates, glues, adhesives, and plastics [1]. Because of its wide dispersive use and toxic properties [2,3], monitoring of melamine (MEL) has been giving rise to international concern. In 2008, MEL caused the death of certain infants in China, who had drunk milk containing this compound. However, milk being a very complex substrate, for the analysis of complex samples, sample preparation is a crucial and important step in the whole analytical procedure. Numerous analytical approaches for sample preparation and simultaneous determination of MEL have also been published, including high-performance liquid chromatography (HPLC) [4-6], liquid chromatography-mass spectrometry (LC-MS) [7,8], capillary electrophoresis (CE) [9], and gas chromatography-mass spectroscopy (GS-MS) [10,11]. Most of these methods rely on time-consuming, laborious sample pretreatment procedures and the cost is higher.
The molecular imprinting technique had been already achieved rapid developments in the separation field due to its high selectivity, stability, and preparation with ease. In researches reported, most Molecularly imprinted polymers (MIPs) for MEL were prepared by bulk polymerization or precipitation polymerization [12,13].
These kinds of MIPs exhibit high selectivity but low rebinding capacity, poor site accessibility to target species and leakage of template molecules [14-16], because the imprinted polymer matrices are usually thick, and the template molecules are embedded in the matrices too deeply to be fully eluted. In order to overcome these draw backs effectively, the surface molecular imprinting technique has been developed. With this technique, the disadvantages of traditional MIPs have been avoided to some extent. However, little attention has been paid to synthesize MIPs for MEL by the surface molecular imprinting technique. In recent years, magnetic separation technology has received considerable attention, for they can easily be separated from extraction system by the application of an external magnetic field. Chen et al. [17] and Wang et al. [18] had synthesized the MMIPs, which can be directly added into the samples and separated from the extraction system easily without additional centrifugation and filtration, simplifying the pretreatment procedures. Wang et al. [19] had synthesized the magnetic molecularly imprinted polymers (MMIPs) for the extraction of MEL from milk. But in their method, tedious solvent extraction and centrifugation were still needed, which had not taken full advantage of the magnetic materials. He et al. [20] reported a method for determination of MEL from milk using Fe3O4 magnetite as magnetic component. Fe3O4 was easily oxidation and aggregation as we known it. Therefore, Fabrication of nano-scale MMIPs with functionalized magnetic nanoparticles materials is necessary. But, as far as we know, the application of MMIPs technology to extract the MEL from milk samples with Fe3O4@ SiO2 as the support, carrying out the extraction and separated procedures in one step, has not been reported yet.
In this paper, a simple method was developed to improve and optimize the analysis of MEL in milk. The new kind of MMIPs was synthesized by using MEL as template molecule, and was successfully applied for the extraction of MEL from milk samples. The proposed method could achieve the extraction and enrichment steps simply by blending and stirring the MMIPs and the milk sample which was diluted with water. The method is more effective and less time-consuming. Meanwhile, high extraction recovery and the high sensitivity of this method showed great advantage than the classic method.
Experimental
Materials
Melamine (MEL), Cyanuric acid (CYA), Cyromanize (CYR), Tetraethyl orthosilicate (TEOS), methacrylic acid (MAA) Ethylene glycol dimethacrylate (EDMA) and 2,2'-Azobis(2-methylpropionitrile) (AIBN) were obtained from Aladdin Reagent (Shanghai, China). 3-methacryloylpropyl trimethoxysilane (MPS) was obtained from Shanghai Chemical Reagent Plant (Shanghai, China). Oleic acid, Ammonium acetate, Ethanol absolute, Acetic acid, Iron chloride, methanol and acetonitrile were purchased from the Tianjin chemical reagent company (Tianjin, China). All other reagents were of analytical grade. Milk samples were purchased from a local supermarket. MAA was purified prior to use via the general distillation method in vacuum under nitrogen protection to remove the polymerization inhibitor. Double distilled water was used throughout the experimental procedures. HPLC grade acetonitrile was obtained from Sigma (St. Louis, MO, USA), All solutions used for HPLC were filtered through a nylon 0.45 μm filter before use.
Instruments
All chromatographic tests were performed using an LC-20AT chromatographic system (Shimadzu, Japan), including two pumps and a multiple-wavelength detector. Samples were injected through a Rheodyne 7725 valve. Thermo-gravimetric analyses (TGA) were carried out simultaneously using a ZRY- 2P instrument (Shimadzu, Japan). TU-1810-type ultraviolet spectrophotometer (Beijing general instrument co., Ltd., China). The FourierTransform Infrared (FT-IR) spectroscopy (Shimadzu, Japan), Magnetic properties were determined with a 7410 vibrating sample magnetometer (VSM, Lake Shore, Cryotronics Inc., USA), Dmax2200pc type X-Ray Diffraction(XRD)(Rigaku co., Japan) and JSM-7500F type Scanning electron microscope (JEOL co., Japan) were used in this experiment.
Preparation of the magnetic molecularly imprinted polymer
Preparation of the magnetic molecularly imprinted polymer was essentially using the procedure reported by Men [21] with modifications. The preparation method of MMIPs beads is schematically illustrated in Figure 1.
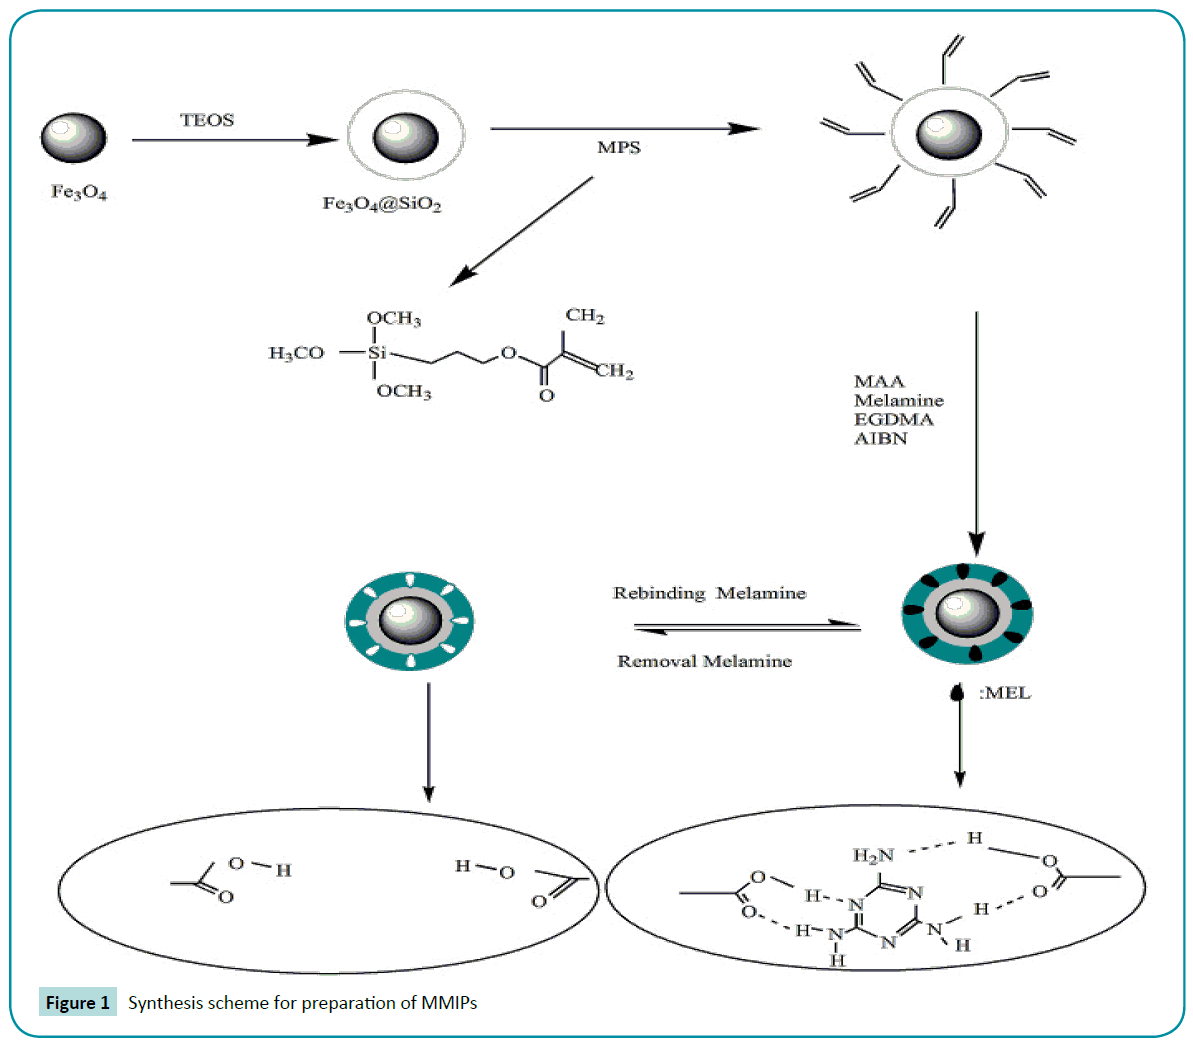
Figure 1: Synthesis scheme for preparation of MMIPs
FeCl3.6H2O (0.05 mol/L) was dissolved in 60 mL ethanol aqueous solution and heated to 50°C. Added hydroxylamine hydrochloride (0.0511 g) after 5 min ammonia to make pH>9 then oleic acid was slowly added, After 1 h, the obtained Fe3O4 nanoparticles were washed with distilled water and ethanol until it was neutral. The oleic acid-coated magnetic nanoparticles particles were dried under vacuum at 50°C.
Fe3O4@ SiO2 microspheres were prepared according to the solgel method. Typically, Fe3O4 (0.1 g) was dispersed in ethanol (60 ml) and ultrapure water(10 ml) by sonication for 15 min, followed by the addition of ammonium hydroxide (1 mL) and TEOS (2 mL) sequentially. The mixture solution reacted for 24 h at the room temperature under a continuous stirring. The synthesized product was separated by a magnet and washed with ethanol and deionized water several times, and dried under vacuum at 60°C.
To prepare the Fe3O4@ SiO2 particles modified with 3-methacryloxypropyl trimethoxysilane (MPS), 1.0 g Fe3O4@ SiO2 activation microspheres were dispersed in 100 mL of mixed solvent of ethanol-water (1:1,v/v), followed by the addition of 1.5 ml of 3-methacryloxypropyl trimethoxysilane (MPS). Then, the mixture was incubated at 60°C for 24 h under nitrogen protection. The Fe3O4@ SiO2 microspheres modified by MPS (Fe3O4@SiO2-MPS) was obtained by magnetic separation and rinsed with ethanol several times.
Then MMIPs films were synthesized as follows process. The template (melamine, 1 mmol) and functional monomer
(MAA, 4 mmol) were dispersed in ethanol-water (4:1, v/v) (20 mL) by sonication, and the mixture has been shaken for overnight.
Then, the Fe3O4@ SiO2-MPS particles (0.2 g), the cross-linking monomer (EDMA, 8 mmol), and the initiator (AIBN, 0.06 g) were added to the mixture, respectively. Subsequently, the solution was deoxygenated by purging with nitrogen for 30 min, sealed and shaken at 60°C for 24 h. Upon completion, template molecule of the resulting product were removed with a mixture solvent of methanol and acetic acid (9:1, v/v) by soxhlet extraction until the eluent was free from melamine through detected by UV spectrophotometer. Finally, the MMIPs obtained were washed with methanol to remove the remaining acetic acid and dried in the vacuum.
As a reference, magnetic non-imprinted polymer (MNIPs) were also prepared using the same procedures but without adding melamine templates.
Static adsorption test
To measure the adsorption capacity of the polymer, 20 mg of MMIPs or MNIPs sorbent added to 10 mL of 20~120 mg/L MEL mixed solution of ethanol-water (4:1,v/v) was shaken for 6 h. The resulting supernatant was measured for unbound MEL by UV spectrometry. The adsorption capacity is calculated according to the equation as follows.
 (1)
(1)
Where Q (mg/g) was the mass of MEL adsorbed per gram of polymers, Ci (mg/L) and Cf (mg/L) are the initial and final concentrations of MEL in solution, respectively, V (L) is the total volume of the solution, and m (g) is the mass of polymers.
The saturation binding data were further processed to generate a Scatchard equation to estimate the binding properties of MMIPs and MNIPs. The Scatchard equation was as follows:
 (2)
(2)
Where Q was the amount of MEL bound to polymers at equilibrium, Qmax was the apparent maximum adsorption capacity, Cfree was the free MEL concentration at equilibrium and Kd was the dissociation constant. The values of Kd and Qmax could be calculated from the slope and intercept of the linear curve plotted at Q/Cfree versus Q.
Selective binding experiments
Adsorption and competitive recognition studies were performed with MEL, cyanuric acid (CYA), cyromanize (CYR) (Figure 2). The MMIPs (20 mg) was added to a flask containing 10 mL of 90 mg L-1 MEL,CYA and CYR, respectively, shaken at room temperature for set times, and then separated centrifugally.

Figure 2: The structure of MEL, CYA and CYR
Milk sample treatment
A portion of 10 mL milk was mixed with melamine standard solutions and was homogenized. First, protein was removed from the matrix by adding acetonitrile (20 mL) to 10 mL milk. The spiked samples were extracted by ultrasonic assisted extraction at room temperature for 30 min; the mixed sample was transferred to two 20 mL centrifuge tubes. Supernatant extract was isolated after centrifugation for 10 min at speed of 4000 rpm. The supernatant was collected to reserve.
10 mL extract into 25 mL conical flask and then 20 mg MMIPs were added. The complex was shaken for set times at room temperature. The MMIPs were obtained by magnetic separation, and then moderate amount of methanol and acetic acid (9:1, v/v) was used as the eluted reagent to extract the analytes in MMIPs. The supernatant was obtained and dried under a N2 stream. Finally, the residues were redissolved in 1 mL of mobile phase for further HPLC analysis. The spiking concentrations for each MEL were set with three levels of 200.0, 300.0, and 500.0 μg/L, respectively.
HPLC analysis
Column chromatography conditions: Luna HILIC (250 mm × 4.6 mm, 5 microns, Phenomenex companies in the US), mobile phase: acetonitrile-10 mmol/L ammonium acetate (9:1,v/v), detection wavelength: 210 nm, injection volume:20 μL.
Results and Discussion
MEL and MAA combining with mechanism analysis
Interactions between functional monomer and the template molecule directly affect the MMIPs recognition and adsorption performance. The molecular imprinted polymer (MIPs) which have a high selectivity and recognition to template is mainly by the interactions between the mode and intensity. The interaction between template molecule and functional monomer are stronger, MIPs is stronger affinity ability of template molecule. Therefore, the interaction between template and functional monomer molecules were studied before the preparation of MMIPs it was necessary. Figure 3a of the molar ratio of template molecule and functional monomer for a 1:0, 1:0.5, 1:1, 1:2, 1:3, 1:4, 1:5, 1:6, 1:7 and 1:8, respectively. On the ultraviolet spectrophotometer measured the absorption curve of 10 kinds of mixture and curve plotting the differential ultraviolet absorption spectrum.
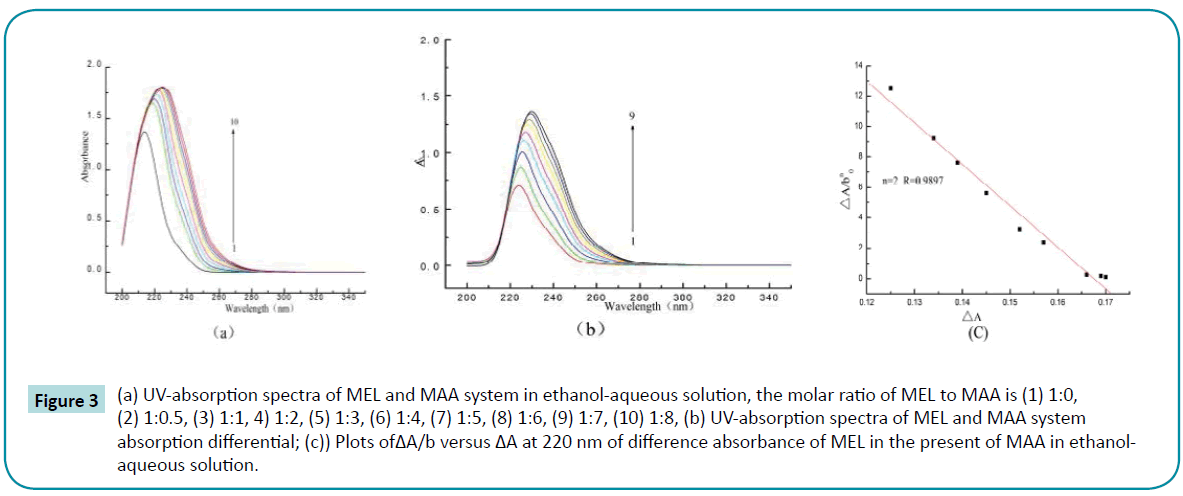
Figure 3: (a) UV-absorption spectra of MEL and MAA system in ethanol-aqueous solution, the molar ratio of MEL to MAA is (1) 1:0, (2) 1:0.5, (3) 1:1, 4) 1:2, (5) 1:3, (6) 1:4, (7) 1:5, (8) 1:6, (9) 1:7, (10) 1:8, (b) UV-absorption spectra of MEL and MAA system absorption differential; (c)) Plots ofΔA/b versus ΔA at 220 nm of difference absorbance of MEL in the present of MAA in ethanolaqueous solution.
In theory, template molecule and functional monomer to form polymer, according to the following equations:
 (3)
(3)
Where K was constant, ξc was the absorbance coefficient of template molecule and functional monomer compounds, ΔA for functional monomer and the template molecules in ethanolaqueous solution absorbance difference before and after effect, b0 was the concentration of functional monomer, a0 was the concentration of template molecules, l was the absorption thickness of cell.
To ΔA/b0n and ΔA drawing can deduce the value of n, thus learned that the action mode of template molecule and functional monomer, that is to say around template molecule has several functional monomer and its effect, so as to reveal the mechanism of molecular imprinting (Figure 3b).
Can be seen from the Figure 3c when n=2, ΔA/b2 and ΔA mapping was a straight line, it showed that template and functional monomer within the scope of the concentration the main form for one MEL interact with two MAA form host-guest complexes. The melamine molecular was symmetric structure contains three functional group (NH2), but there are only two interact with monomer which could be the influence of the space steric effect. Presumably, melamine molecularly imprinted polymer synthesis route:

FT-IR spectra
The FT-IR spectra of Fe3O4@ SiO2 (a), Fe3O4@ SiO2-MPS (b) and MMIPs (c) were given in Figure 4. The characteristic absorption band of Fe-O situated at 467.7 cm-1 and 580.6 cm−1 in each curves. The strong peak at 1,096.6 cm−1 was attributed to the asymmetry stretching vibration of Si-O-Si bonds. Other absorption bands, such as the Si-O bending vibration peak at 808.6 cm−1 and the Si–O–H vibration peak at around 954.2 cm−1 were appeared in the Fe3O4@ SiO2 sample (Figure 4). Such results confirmed that SiO2 was indeed coated onto the surface of Fe3O4 nanoparticles. The typical peak of 1,730.2 cm−1 represents the stretching vibration of carbonyl groups of the MPS in Figure 4. Upon comparing MMIPs to Fe3O4@ SiO2-MPS, a bond absorption band at 2,970.3 cm−1 of the MMIPs corresponded to the C-H aromatic stretching vibration of EDMA. Then, the peak of C-H at 1,390.1 cm−1 symmetric bending vibration from methyl groups and C=O bond at 1,731.6 cm−1 stretching vibration increase observably. The appearances of these bands were confirmed that the polymerization was successful.
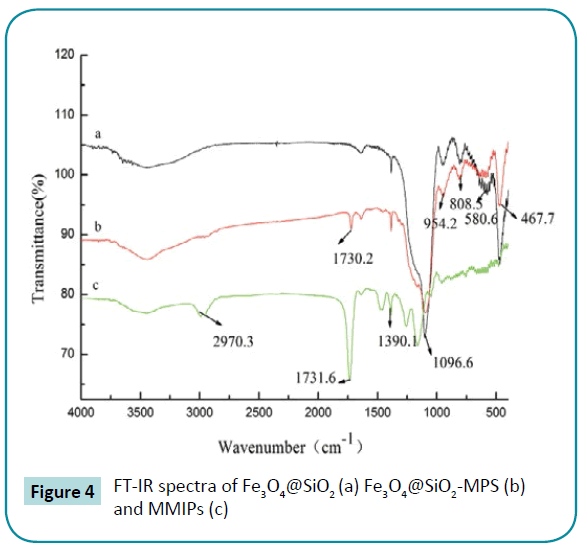
Figure 4: FT-IR spectra of Fe3O4@SiO2 (a) Fe3O4@SiO2-MPS (b) and MMIPs (c)
Thermal stability analysis
Figure 5 depicted the thermogravimetric curves (TGA) of the Fe3O4 (a), Fe3O4@ SiO2 (b), Fe3O4@ SiO2-MPS (c), and MMIPs (d). As shown in Figure 5a illustrated that the Fe3O4 (a), Fe3O4@ SiO2 (b), and Fe3O4@ SiO2-MPS (c) microspheres have good thermal stability. From room temperature to 800°C, there is only little lost for about 8%. In details, the rate of weight loss for Fe3O4 (a), Fe3O4@ SiO2 (b) and Fe3O4@ SiO2-MPS (c) owed to remnant ethanol the dehydration in the layer of samples under below 150?. When the temperature was changed from 400°C to 600°C, the decreased weight might be due to decomposition of organic matter in Fe3O4@ SiO2 (b) and Fe3O4@ SiO2-MPS (c). Especially the weight loss rate of Fe3O4@ SiO2-MPS (c) was much higher than the Fe3O4@ SiO2 (b) at nearby 500°C, which demonstrated existence of MPS. From Figure 5d, it is obvious that MMIPs had a rapid weight loss rate from 300°C to 500°C, and the decreased weight of MMIPs was approximately 80.4%. The weight loss should be the decomposition of MMIPs.
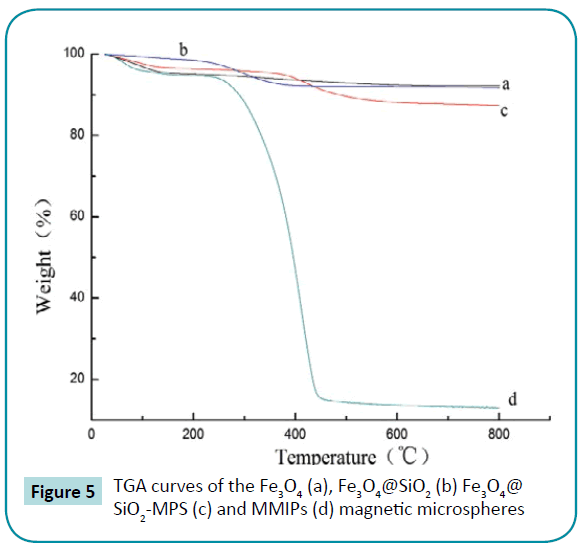
Figure 5: TGA curves of the Fe3O4 (a), Fe3O4@SiO2 (b) Fe3O4@ SiO2-MPS (c) and MMIPs (d) magnetic microspheres
Magnetic properties
The magnetic properties of the Fe3O4 nanoparticles (a), Fe3O4@ SiO2 (b), Fe3O4@ SiO2-MPS (c) and MMIPs (d) were characterized by VSM at room temperature and the results are shown in Figure 6. The values of saturation magnetization for the Fe3O4(a), Fe3O4@ SiO2 (b), Fe3O4@ SiO2-MPS (c) and MMIPs (d)were 60.67 emu/g, 27.10 emu/g, 21.76 emu/g and 3.86 emu/g, respectively. The saturation magnetization value of Fe3O4 was similar to that from the literature [22]. And this value was smaller than that of the theoretical specific saturation magnetization of bulk magnetite (92 emu/g [23]). The value of saturation magnetization was decreased due to the small particle surface effect. The saturation magnetization value of the Fe3O4@ SiO2 was far less than that of the pure Fe3O4 nanoparticles. The decrease in magnetization value is most likely attributed to the existence of silica shells on the surface of Fe3O4 nanoparticles, leading to a weakening of the magnetic moment. The Fe3O4@ SiO2 exhibited slightly weak magnetic properties after modified by MPS. The magnetic hysteresis loop of the MMIPs is illustrated in Figure 6b. The values of saturation magnetization for the MMIPs were 3.86 emug-1. The saturation magnetization value of the MMIPs is smaller compared with the pure Fe3O4 nanoparticles. So the agminate MMIPs can renewably disperse rapidly after the magnetic field is removed. Figure 6 (inset) shows the photographs of the separation process of MMIPs beads. In the absence of an external magnetic field, a yellow homogeneous dispersion exists. When an external magnetic field was applied, the black particles were attracted to the wall of vial and the dispersion became clear and transparent in a short time. As a result, the MMIPs particles could be easily and quickly separated from a suspension.
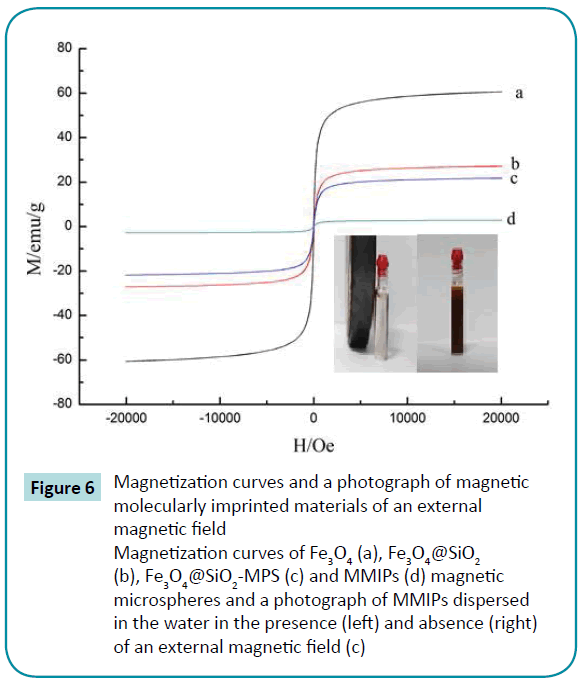
Figure 6: Magnetization curves and a photograph of magnetic molecularly imprinted materials of an external magnetic field
Magnetization curves of Fe3O4 (a), Fe3O4@SiO2 (b), Fe3O4@SiO2-MPS (c) and MMIPs (d) magnetic microspheres and a photograph of MMIPs dispersed in the water in the presence (left) and absence (right)
of an external magnetic field (c)
X-ray diffraction patterns
The structural properties of Fe3O4 nanoparticles (a), Fe3O4@ SiO2 (b), Fe3O4@ SiO2-MPS (c) and MMIPs (d) were analysized by XRD. As shown in Figure 7, the discernible six characteristic peaks for Fe3O4 (2θ=30.2°, 35.6°, 43.3°, 53.5°, 57.2°, and 62.8°) were observed for all the samples, and the peak positions could be indexed to (220), (311), (400), (422), (511) and (440), respectively, which match well with the database of magnetite in the JCPDSInternational Center (JCPDS Card: 19-0629). The peak positions were unchanged during the synthesized process, which indicating that the crystalline structure of the magnetite was essentially maintained. The diffraction peak with 2θ=22°can be assigned to the amorphous SiO2 for Fe3O4@ SiO2, Fe3O4@ SiO2-MPS and MMIPs.
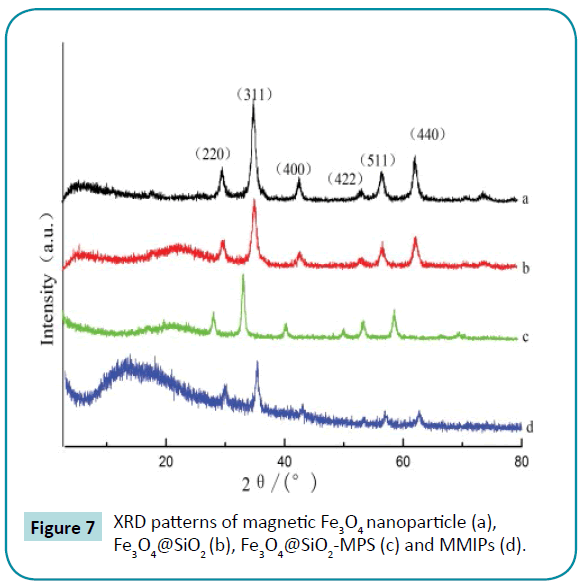
Figure 7: XRD patterns of magnetic Fe3O4 nanoparticle (a), Fe3O4@SiO2 (b), Fe3O4@SiO2-MPS (c) and MMIPs (d).
Characterized by scanning electron microscopy
The microscopic features of MMIPs was changed before and after adsorption MEL were shown in Figure 8. The images of left for fresh before adsorption MMIPs surface was porous, rough and had a large number of mesopores on their surface which were suitable for rebinding or releasing the target molecules from the MMIPs particles. The observations also confirmed that the magnetic polymeric microspheres had been successfully prepared, the right for the saturated adsorption MMIPs, it can be seen that the magnetic material surface is relatively smooth, crisscross lamination reduction, after adsorption MEL surface of magnetic material obvious changed, indicate that the MMIPs has good adsorption (Figure 8).
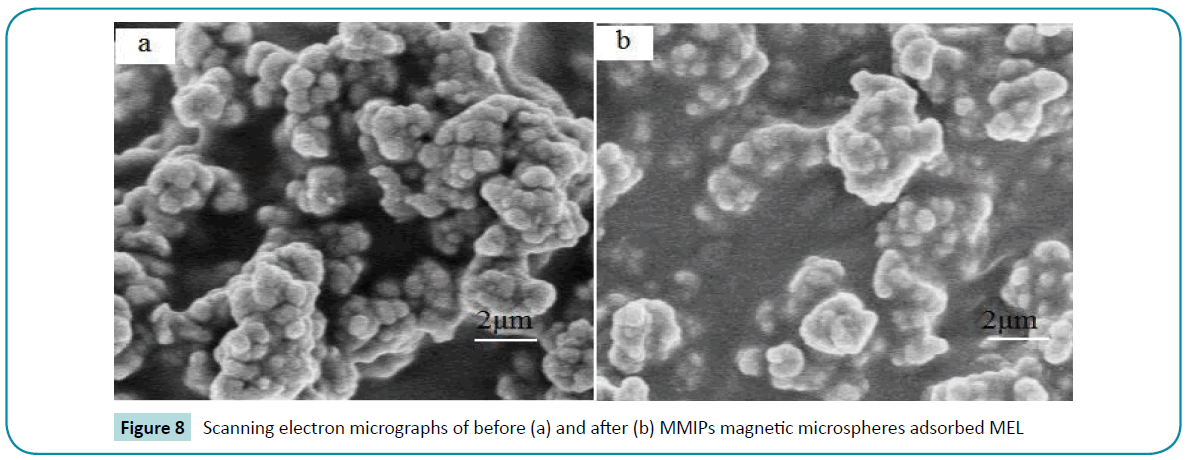
Figure 8: Scanning electron micrographs of before (a) and after (b) MMIPs magnetic microspheres adsorbed MEL
Adsorption capacity
Static adsorption tests were performed on the MMIPs and MNIPs, MMIPs and MNIPs with different initial concentrations of MEL (Figure 9). The MMIPs and MNIPs particles were put in the concentrations of MEL solutions ranging from 20 to 120 mg/L, when the concentration of MEL reached 90 mg/L and more, the bound amounts achieved a saturated plateau for MMIPs and MNIPs. The static adsorption capacities of the MMIPs and MNIPs for MEL were 8.74 mg/g and 3.48 mg/g, respectively, which displayed better steric matching with the imprinted molecule MEL, indicating that the MMIPs had a higher affinity than the MNIPs for the template molecule. The calculated maximum adsorption capacities of the MMIPs exhibited better than the literature value [20]. In general, MMIPs possesses both specific and nonspecific binding sites, while MNIPs only has nonspecific binding sites, which enable MMIPs to take up more MEL than MNIPs. The difference in adsorption capacity between MMIPs and MNIPs is equivalent to the contribution from the specific binding sites on MMIPs.
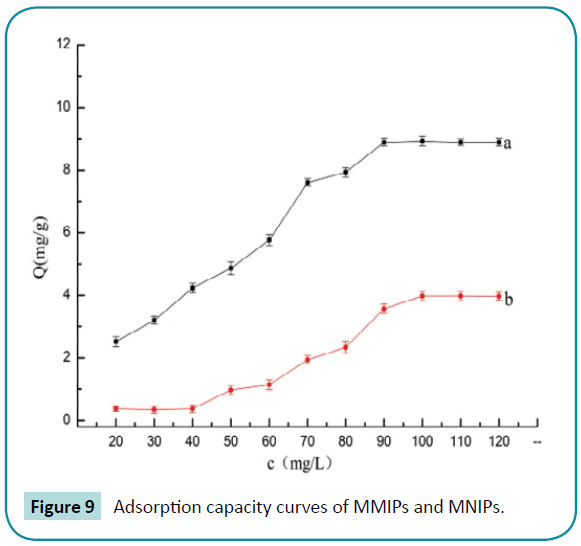
Figure 9: Adsorption capacity curves of MMIPs and MNIPs.
In order to further study the binding properties of the MMIPs beads, Scatchard analysis was performed by using the saturation binding data. As can be seen from Figure 10, the Scatchard plot for MMIPs was not a single linear curve, but rather consisted of two linear parts with different slopes, which suggested that there were two different types of binding sites for MMIPs towards linearity MEL molecular. The Kd and Qmax values can be calculated according to the slopes and intercepts of the two linear portions of the Scatchard plot. The results are shown in Table 1.
| Binding sites |
Linearity |
Kd (g/L) |
Qmax(mg/g) |
| Lower affinity sites |
Q/Ct=-0.62006*10-5x+0.19883 (R2=0.8639) |
161.27 |
32.07 |
| Higher affinity sites |
Q/Ct=-0.00272x+0.20908 (R2=0.9236) |
0.3676 |
0.07687 |
Table 1 The results of the scatchard analysis.
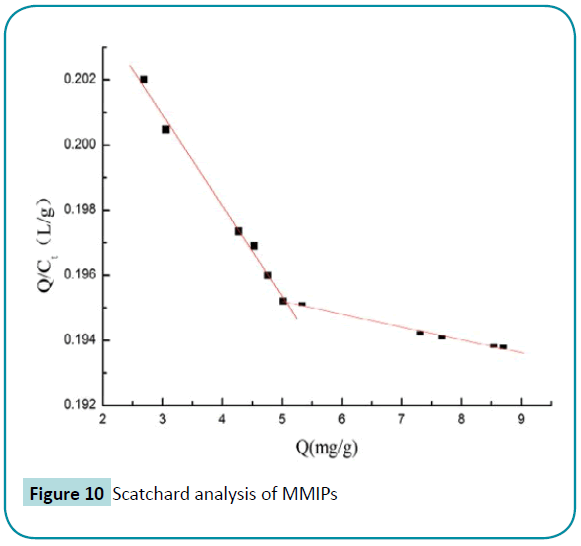
Figure 10: Scatchard analysis of MMIPs
Adsorption kinetics
Figure 11 presents the adsorption kinetics of MEL solution on the MMIPs. Adsorption equilibrium of MMIPs nanoparticles in MEL solution was determined at different adsorption times. The initial concentration of MEL was kept constantly at 90 mg/L. In 10~60 min, the binding amount of MEL increased rapidly and reached an equilibrium after 30 min, the adsorption capacity rapidly increase at the initial stage, and then slow down to reach the adsorption equilibrium.
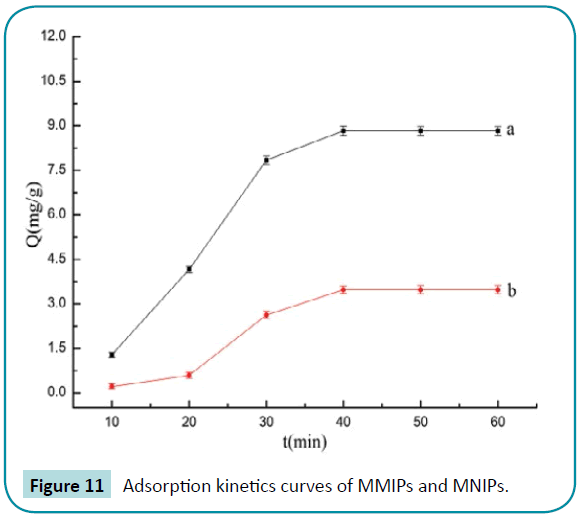
Figure 11: Adsorption kinetics curves of MMIPs and MNIPs.
Selectivity
The adsorption selectivity is an indispensable factor for appreciating the capacities of an adsorbent. To evaluate the selectivity of the MIPs, analogue of cyanuric acid and cyanazine were selected. The initial concentrations of MEL, CYA and CYR used were 90 mg/L .The experimental results were plotted in Figure 12, the bound amount of MEL for MMIPs was much higher than that of the other two competitive analogs. Although the structures of cyanuric acid and cyanazine are very similar with template MEL, the MMIPs could still specifically recognize MEL based on the imprinted sites.
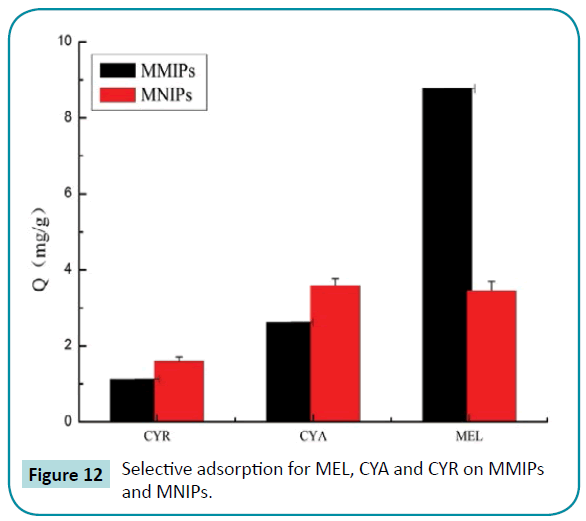
Figure 12: Selective adsorption for MEL, CYA and CYR on MMIPs and MNIPs.
The application in milk samples analysis
It was further applied to analyze melamine in milk for demonstrate the applicability of the method. The milk was added by spiking melamine solution at three levels (200.0, 300.0, and 500.0 μg/L). The molecularly imprinted materials can be repeatedly used 6 times, the recoveries of MEL in the spiked samples were 85.6% to 104.2%. Detection limits for MEL were within the range of 0.15- 3.00 μg/mL, which could meet the analysis of trace melamine in milk. The limit of detection (LOD) (S/N=3) of this new method was 15 μg/L. Simultaneously, the recovery of melamine by the MMIP is high than that of the MNIPs, the resulted demonstrated that the good selection of adsorption of the MMIPs for melamine in the milk (Figure 13 and Table 2).
| |
imprint |
nonimprint |
| Samples |
Adding level?μg/L? |
Recovery?%? |
RSD% |
Recovery?%? |
RSD% |
| MEL |
200 |
85.6 |
2.8 |
72.6 |
3.7 |
| 300 |
92.1 |
3.2 |
81.7 |
3.3 |
| 500 |
104.2 |
8.3 |
96.3 |
9.3 |
Table 2 Recovery results of spiked melamine in milk (n=3).
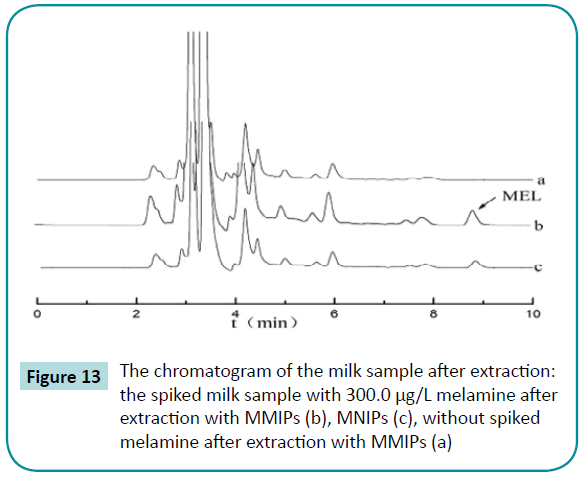
Figure 13: The chromatogram of the milk sample after extraction: the spiked milk sample with 300.0 μg/L melamine after extraction with MMIPs (b), MNIPs (c), without spiked melamine after extraction with MMIPs (a)
Conclusions
In the study, the MMIPs using melamine as a template were prepared based on surface modification of the Fe3O4@ SiO2 nanoparticles by using molecularly imprinting technique. The obtained magnetic microspheres were characterized by FTIR, TGA, VSM, SEM and XRD. In the rebinding experiment, high adsorption capacity and good selectivity for melamine were demonstrated by the MMIPs beads. Furthermore, the MMIPs were successfully applied to selective enrichment coupled with HPLC analysis for melamine in spiked samples. In conclusion, the MMIPs not only provided a convenient separation with the magnetic nanoparticles, but it also overcame problems of low selectivity with MMIPs. So a novel method combining MMIPs with HPLC analysis was established to determine the melamine.
Funding
This work was sponsored by the National Natural Science Foundation of China (No.31271868 and No. 21565001).
9099
References
- Frösch D, Westphal C (1989) Melamine resins and their application in electron microscopy. Electron Microsc Rev 2: 231-255.
- Yang Y, XiongGJ, Yu DF, Cao J, Wang LP, et al. (2012) Acute low-dose melamine affects hippocampal synaptic plasticity and behavior in rats. ToxicolLett 214: 63-68.
- Gamboa da Costa G, Jacob CC, Von TungelnLS, Hasbrouck NR, Olson GR, et al. (2012) Dose-response assessment of nephrotoxicity from a twenty-eight-day combined-exposure to melamine and cyanuric acid in F344 rats. ToxicolApplPharmacol 262: 99-106.
- Cabras P, Meloni M, Spanedda L (1990) High-performance liquid chromatographic separation of cyromazine and its metabolite melamine. J Chromatogr 505: 413-416.
- Sun H, Qin X, Ge X, Wang L (2011) Effective separation and sensitive determination of cyanuric acid, melamine and cyromazine in environmental water by reversed phase high-performance liquid chromatography. Environmental Technology 32: 317-323.
- Sun H, Wang L, Liu N, Qiao F, Liang S (2009)SPE then RP-LC for Simultaneous Analysis of Cyromazine and its Metabolite Melamine in Liquid Milk and Egg. Chromatographia 70: 1685-1689.
- Xia K, Atkins J, Foster C, Armbrust K (2010) Analysis of cyromazine in poultry feed using the QuEChERS method coupled with LC-MS/MS. J Agric Food Chem 58: 5945-5949.
- Sancho J, Ibanez M, Grimalt S, PozoOJ, HernandeZF(2005)Residue determination of cyromazine and its metabolite melamine in chard samples by ion-pair liquid chromatography coupled to electrospray tandem mass spectrometry. AnalyticaChimicaActa 530: 237-243.
- Xia J, Zhou N, Liu Y, Chen B, Wu Y, et al.(2010)Simultaneous determination of melamine and related compounds by capillary zone electrophoresis. Food Control 21:912-918.
- Zhu X, Wang S, Liu Q, Xu Q, Xu S, et al. (2009) Determination of residues of cyromazine and its metabolite, melamine, in animal-derived food by gas chromatography-mass spectrometry with derivatization. J Agric Food Chem 57: 11075-11080.
- Yokley RA, Mayer LC, Rezaaiyan R, Manuli ME, Cheung MW (2000) Analytical method for the determination of cyromazine and melamine residues in soil using LC-UV and GC-MSD. J Agric Food Chem 48: 3352-3358.
- Wang B, Wang YZ, Yang H, Wang JQ, Deng AP.(2011)Preparation and characterization of molecularly imprinted microspheres for selective extraction of trace melamine from milk samples. Microchimicaacta 174:191-199.
- Curcio M, Puoci F, Cirillo G, Iemma F, SpizzirriUG, et al. (2010) Selective determination of melamine in aqueous medium by molecularly imprinted solid phase extraction. J Agric Food Chem 58: 11883-11887.
- Pichon V, Chapuis-Hugon F (2008) Role of molecularly imprinted polymers for selective determination of environmental pollutants--a review. Anal ChimActa 622: 48-61.
- Pichon V (2007) Selective sample treatment using molecularly imprinted polymers. J Chromatogr A 1152: 41-53.
- He L, Su Y, Shen X, Zheng Y, Guo H, et al.(2009)Solid-phase extraction of melamine from aqueous samples using water-compatible molecularly imprinted polymers. Journal of Separation Science32: 3310-3318.
- Chen L, Liu J, Zeng Q, Wang H, Yu A, et al.( 2009)Preparation of magnetic molecularly imprinted polymer for the separation of tetracycline antibiotics from egg and tissue samples. Journal of Chromatography A1216: 3710-3719.
- Wang S, Li Y, Ding M, Wu X, Xu J,et al.(2011)Self-assembly molecularly imprinted polymers of 17ß-estradiol on the surface of magnetic nanoparticles for selective separation and detection of estrogenic hormones in feeds. Journal of Chromatography B 879: 2595-2600.
- Wang M, She Y, Du X, Huang Y, Shi X, et al.(2013)Determination of melamine using magnetic molecular imprinted polymers and high performance liquid chromatography. Analytical Letters 46:120-130.
- He D, Zhang X, Gao B, Wang L, Zhao Q, et al.(2014)Preparation of magnetic molecularly imprinted polymer for the extraction of melamine from milk followed by liquid chromatography-tandem mass spectrometry. Food Control36: 36-41.
- Men H, Liu H, Zhang Z, Huang J, Zhang J, et al.(2012)Synthesis, properties and application research of [email protected] magnetic molecularly imprinted polymer. Environmental Science and Pollution Research 19:2271-2280.
- Chen L, Liu J, Zeng Q, Wang H, Yu A, et al. (2009) Preparation of magnetic molecularly imprinted polymer for the separation of tetracycline antibiotics from egg and tissue samples. J Chromatogr A 1216: 3710-3719.
- Wang S, Li Y, Ding M, Wu X, Xu J, et al. (2011) Self-assembly molecularly imprinted polymers of 17Î-estradiol on the surface of magnetic nanoparticles for selective separation and detection of estrogenic hormones in feeds. J Chromatogr B AnalytTechnol Biomed Life Sci 879: 2595-2600.



 (1)
(1) (2)
(2)

 (3)
(3)


