Research Article - (2022) Volume 16, Issue 11
QUALITY OF LIFE AMONG END STAGE RENAL DISEASE PATIENTS WITH HEMODIALYSIS, AT ARAR, KINGDOM OF SAUDIARABIA
Dr .Hayat Al Zahrani1*,
Dr.Sobha Saseendrababu2 and
Mrs. Ajitha Thankarajan Rejennal3
1Medical Laboratory Technology Department, Saudi Arabia
2Department of Intensive Care Nursing, Saudi Arabia
3Medical Surgical Nursing Department Northern Border University, Arar, Kingdom of Saudi Arabia, Saudi Arabia
*Correspondence:
Dr .Hayat Al Zahrani, Medical Laboratory Technology Department,
Saudi Arabia,
Tel: 0553680712,
Email:
Received: 18-Oct-2022, Manuscript No. Iphsj-22-13123;
Editor assigned: 21-Oct-2022, Pre QC No. Iphsj-22-13123 (PQ);
Reviewed: 04-Nov-2022, QC No. Iphsj-22-13123;
Revised: 09-Nov-2022, Manuscript No. Iphsj-22-13123(R);
Published:
16-Nov-2022, DOI: 10.36648/1791- 809X.16.11.983
Abstract
End-stage renal disease (ESRD) affects the lives of a disproportionate amount of people around the world today. It is estimated that there is 35% increase in the number of dialysis patients worldwide (Oxford Journals, February 2014). According to Ji.Cheng Lv and Lu-Xia-Zhang,2019) Chronic kidney disease (CKD) has been recognized as a leading public health problem worldwide. The global estimated prevalence of CKD is 13.4% (11.7-15.1%), and patients with end-stage kidney disease (ESKD) needing renal replacement therapy is estimated between 4.902 and 7.083 million. Through its effect on cardiovascular risk and ESKD, CKD directly affects the global burden of morbidity and mortality worldwide. The global increase in this disease is mainly driven by the increase in the prevalence of diabetes mellitus, hypertension, obesity, and aging.
Keywords
ESRD Patients; Hemodialysis; Renal Disease
INTRODUCTION
End-stage renal disease (ESRD) affects the lives of a disproportionate amount of people around the world today. It is estimated that there is 35% increase in the number of dialysis patients worldwide [1]. According to Ji.Cheng Lv and Lu-Xia- Zhang, 2019) Chronic kidney disease (CKD) has been recognized as a leading public health problem worldwide. The global estimated prevalence of CKD is 13.4% (11.7-15.1%), and patients with end-stage kidney disease (ESKD) needing renal replacement therapy is estimated between 4.902 and 7.083 million. Through its effect on cardiovascular risk and ESKD, CKD directly affects the global burden of morbidity and mortality worldwide. The global increase in this disease is mainly driven by the increase in the prevalence of diabetes mellitus, hypertension, obesity, and aging [2].
A comprehensive survey in Hail region, Kingdom of Saudi Arabia shows that the prevalence [95% confidence interval (CI)] of all stages Chronic Kidney Disease (CKD) was 9.4%. The Glomerular Filtration Rate (GFR) estimation was available for 2,946 individuals, among whom, 278/2946 (9.4%) were found with impaired kidney function). Of the 278 persons with CKD, 11/2946(0.4%), 16/2946(0.5%), 229/2946(7.8%) and 22/2946 (0.6%) were estimated for GFR rates of stage V, Stage IV, stage III and stage IV, respectively [3].
In 2012, more than 2.35 million patients received renal replacement therapy in the form of dialysis, under the two broad categories of haemodialysis or HD (over 2.10 million) and peritoneal dialysis or PD (over 250 000). This is a rather steep increase from 2008 (1.75 million total, 1.55 million HD and 197 000 PD) [2].
A study carried out in Saudi Arabia shows statistical evidence that in 2014, the dialysis population became doubled over 15 years and is expected to increase two-fold by 2020. (Mohammed Al- Homrany, King Khalid University, 2014). It has been identified that on an average of 30-40 ESRD patients with different stages are undergoing haemodialysis per day in Artificial Kidney Unit (AKU), Central Hospital, and Arar.
Several studies have shown that patients on haemodialysis (HD) are less physically active and have low exercise capacity and poor physical functioning than sedentary persons with normal kidney function. This is mainly due to muscle atrophy and mitochondrial abnormalities. End stage renal disease is a chronic disease that exerts a great negative impact on patient’s health related quality of life (QOL) mainly due to the accompanied impairment or imposed limitations in almost all domains of their daily lives. Hemodialysis consists a complex procedure for patients that require frequent hospital or dialysis centers visits, mainly three times a week, thus implying substantial changes in the normal way of patients’ living [4].
Need and Background of the Study
End stage renal disease (ESRD) is one such chronic disease causing a high level of disability in different domains of the patients’ lives, leading to impaired QOL. It is well documented that the general dialysis population has significant reduction in strength and markedly impaired exercise capacity, yet clinicians often attribute these functional impairments to inadequate dialysis, anemia, or cardiopulmonary disease. Despite the evidence that exercise is safe and beneficial in patients with CKD, dialysis patients remain inactive and exercise assessment, counselling and training is not widely offered to patients with CKD. Approximately 3.2 million people die each year due to lack of physical activity.
Assessment of health-related quality of life is a predictive indicator of the outcome of the disease as well as a valuable research tool in assessing the effectiveness of therapeutic intervention, patients’ survival and hospitalizations. Long-term dialysis therapy itself often results in a loss of freedom, dependence on caregivers, disruption of marital, family, and social life, and reduced or loss of financial income. Due to these reasons, the physical, psychological, socioeconomic, and environmental aspects of life are negatively affected, leading to compromised QOL [5-7].
Abdelbasit Mohamad Abdelhadi Ayoub (2012) conducted a descriptive comparative survey design in UAE to study the QOL of 161 dialysis patients and 350 participants from the community. The overall QOL for dialysis patients was rated lower when selfassessed using the SF-36 compared with the community sample (58.92 vs. 75.02, p = <0.0001). Furthermore, the overall QOL for dialysis patients was rated almost the same when self-assessed using the QOL Index compared with the community sample (77.2 vs. 78.6, p = 0.421).
Kobra. P et al. (2012), by using a descriptive and correlational design, a study was conducted on 245 haemodialysis patients in which their quality of sleep was measured by the Pittsburgh Sleep Quality Index (PSQI), and the quality of life for patients was measured by the Kidney Disease Quality Of Life questionnaire (KDQOL-SF). It was shown that 83.3% of haemodialysis patients had poor quality of sleep. Poor quality of life was significantly associated with poor quality of sleep (p< 0.005). There was a significant negative correlation between global PSQI and important aspects of quality of life. Hence, the low quality of sleep in haemodialysis patients has an effect on the deterioration of their quality of life.
The investigators have come across with various studies regarding physical function and quality of life in different parts of the world. But a few studies have seen in the Kingdom of Saudi Arabia to analyse the quality of life among haemodialysis patients. So, the investigators feel motivated to conduct such type of study in a hospital setting in order to assess the variables and to use the findings for suggesting measures to improve the quality of life among haemodialysis patients [8-10].
Purpose of the Study
The main purpose of the study is to analyse the quality of life with reference to symptom, function, well- being, interpersonal and transcendent dimensions; among ESRD patients who are undergoing haemodialysis mostly 2 to 3 times per week and to compare the different aspects of quality of life among them.
Studies Related To Quality Of Life among
Hemodialysis Patients
Zaynab. H (2012) identified the relationship between depression and quality of life among ninety-five men and 76 women (171 totally) receiving haemodialysis treatment in the year 2011; Chi-square test showed a significant relationship between depression and quality of life of these patients (P < 0.05) and the results showed that none of the studied patients had appropriate quality of life.
B. S. Sathvik & G. Parthsarathi (2010) did a comparison of the QOL scores of haemodialysis patients with those of asthma patients did not yield any significant differences (P > 0.05) in physical health, psychological health, and social relationships. Asthma patients reported a significantly (P < 0.05) higher QOL in the environmental domain than did the haemodialysis patients [11, 12].
Nor Baizura Md. Yusop et al. (2013) published their crosssectional study aimed to determine the relationship between medical history, haemodialysis treatment and nutritional status with the mental and physical components of quality of life in 90 haemodialysis patients from Hospital Kuala Lumpur and dialysis centres of the National Kidney Foundation of Malaysia; in which the mental and physical quality of life were measured using the Mental Composite Summary (MCS) and Physical Composite Summary (PCS) of the Short-Form Health Survey 36-items and it is evident that the majority of respondents did not meet the energy (n=72, 80%) and protein (n=68,75%) recommendations. The total score of SF-36 was 54.1±19.2, while the score for the mental and physical components were 45.0±8.6 and 39.6±8.6, respectively [13- 15].
Statement of Problem
Quality of life among End Stage Renal Disease (ESRD) patients with haemodialysis at Central Hospital, Arar, Kingdom of Saudi Arabia.
Objective
1. To analyse the quality of life (QOL) among ESRD patients with haemodialysis as measured by Modified Missoula- Vitas Quality of Life Index
Hypotheses
H1: - There is compromised Quality of life of End Stage Renal Disease patients with hemodialysis as measured by Modified Missoula- Vitas Quality of Life Index.
Operational Definitions
1. QUALITY OF LIFE: The degree of measurement of well – being with multiple dimensions such as symptoms, functioning, interpersonal relationships, well-being and transcendent among selected ESRD patients with haemodialysis, which will be measured by Missoula- Vitas Quality of Life Index.
2. ESRD PATIENTS WITH HEMODIALYSIS: Patients with End Stage Renal Disease and undergoing haemodialysis, admitted in Artificial Kidney Unit, Central Hospital, Arar.
3. SELECTED VARIABLES: The associated factors such as age, sex, marital status, occupation, duration of illness, other co- morbid conditions, medications, prescribed diet and frequency of performing sala; which might have an effect on the physical function and quality of life measures.
Inclusion Criteria
1. ESRD Patients undergoing haemodialysis in AKU, Central Arar Hospital.
2. Age group is between 20 – 60 years.
3. Patients who speak or read Arabic.
4. Both males and females are included.
Exclusion Criteria
1. Patients who develop other complications like hypoglycaemia, hypotension during haemodialysis therapy.
2. Patients who are seriously ill.
3. Patients who not willing to participate in the study.
4. Patients with other infectious diseases such as hepatitis, HIV etc.
5. Patients with dementia or cognitive impairment
Research Methodology
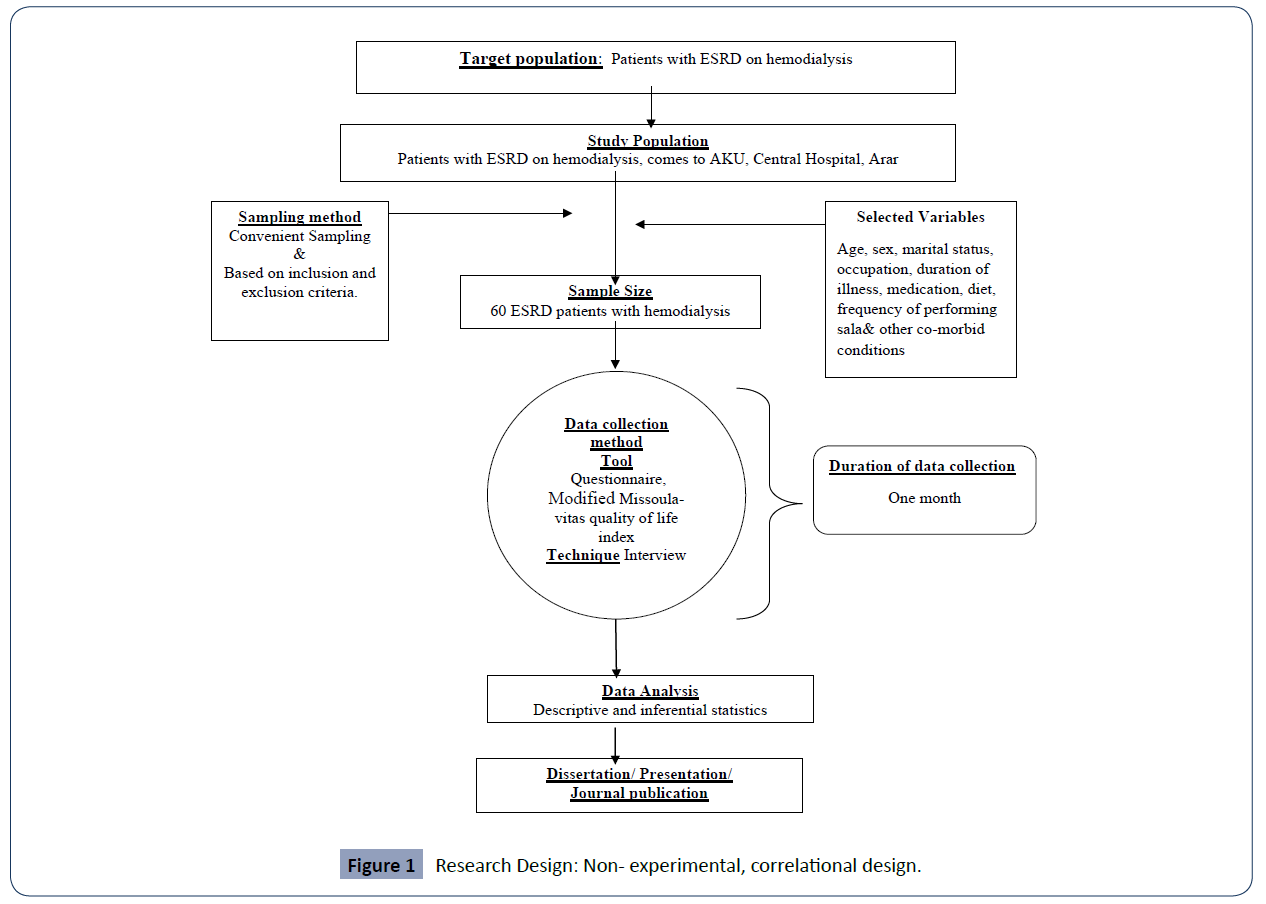
(Figure 1)
Figure 1 Research Design: Non- experimental, correlational design.
Data Collection Procedure
The subjects were selected through convenient sampling technique and informed consent is obtained to include them as study participants. A semi- structured tool which has been translated to Arabic language, was used to assess the physical function and quality of life among ESRD patients with haemodialysis, through an interview (read only) technique by two Arabic speaking nursing personnel for 20-30 minutes per subject. Duration of data collection 60 days from September- October 2020 [16].
Description of Tool
The tool used in this study includes
Section A: Questionnaire (for selected variables)
Section B: Modified Missoula- Vitas Quality of Life Index (Mvqol) scale is a 15-item questionnaire which has been classified under 5 dimensions such as symptoms, function, interpersonal, wellbeing and transcendent. In each area, three types of information were collected in:
(a) Assessment (subjective measurement of the actual situation or state)
(b) Satisfaction (degree of acceptance or knowledge of the actual state)
(c) Importance (the degree to which a given dimension has an impact on the overall quality of life).
Scoring Criteria
(ASSESSMENT + SATISFACTION) X IMPORTANCE = QUALITY OF LIFE (QOL)
The MVQOLI items are scored as follows: Assessment -2 to +2 Satisfaction -4 to +4 Importance 1 to 5 (Assessment + Satisfaction) X Importance = QOL in each dimension
Validity of the Tool
Both English and Arabic version of the tool is reviewed by five health related professionals.
1. 2 doctors specialized in nephrology and dialysis
2. 1 Physiotherapist
3. 1 Medical surgical nursing specialist
4. 1 dialysis nurse
Thus, content and construct validity of the tool is obtained.
Reliability of the Tool
A pilot study was conducted among 6 patients with End Stage Renal Disease who undergone haemodialysis in Central Hospital, Arar. The period of pilot study was 2 days. Analysis of the pilot study helped the investigators to check the reliability of the tool which was used [17].
Delimitations
1. The study limited to AKU, Central Hospital, Arar
2. The duration of the study limited to 8 weeks.
Ethical Considerations
The study will be conducted after getting approval from the following:
1. Ethical committee and research committee.
2. Permission from Central Hospital, Arar, Kingdom of Saudi Arabia.
3. Informed consent from subjects.
Results
The statistical analysis of the collected data using Modified Missoula-Vitas Quality of Life Index showed the following pattern in different aspects of Quality of Life sin relation to symptoms,function, interpersonal, wellbeing and transcendent aspects (Table 1).
| S.no |
Name of the variables |
Subgroups |
Frequency |
Percentage |
| 1 |
Age |
20-30 |
12 |
20 |
| 31-40 |
10 |
16.7 |
| 41-50 |
33 |
55 |
| 51-60 |
5 |
8.3 |
| 2 |
Sex |
Male |
26 |
43.3 |
| Female |
34 |
56.7 |
| 3 |
Marital status |
Single / Unmarried |
6 |
10 |
| Married |
39 |
65 |
| Separated / Divorced |
15 |
25 |
| 4 |
Occupation |
Sedentary |
45 |
75 |
| Moderate worker |
15 |
25 |
| 5 |
Duration of illness |
2-5 Years |
34 |
56.7 |
| 5-10 years |
23 |
38.3 |
| >10 years |
3 |
5 |
| 6 |
Co-morbid Conditions |
Diabetes Mellitus |
17 |
28.3 |
| Hypertension |
24 |
40 |
| Cardiac diseases |
4 |
6.7 |
| Renal diseases |
15 |
25 |
| Others |
0 |
0 |
| 7 |
Diet |
Strict |
17 |
28.3 |
| Non-Strict |
43 |
71.7 |
| 8 |
Performing Sale |
Yes |
60 |
100 |
| No |
0 |
0 |
| 9 |
Number of times in a day doing sale |
5 |
2 |
3.3 |
| 4 |
0 |
0 |
| 3 |
55 |
91.7 |
| 2 |
0 |
0 |
| 1 |
3 |
5 |
Table 1. Description of Selected Demographic Variables.
Descriptive analysis of the study participants showed that majority of them (55%) belongs to 41-50 years followed by 16.7% in the 31-40 years age group. Most of the study participants (75%) reported sedentary lifestyle. Nearly half of the 40% had a history of Hypertension, followed by Diabetes (28.3%) and renal diseases (6.7%). The study also showed that most of the participants (71.7%) had an unhealthy dietary pattern (Table 2, Figure 2).
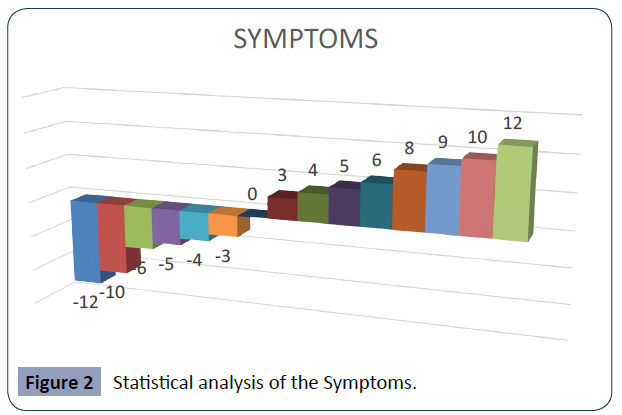
Figure 2 Statistical analysis of the Symptoms.
| Score |
Frequency |
Percent |
Valid Percent |
Cumulative Percent |
| -12.00 |
2 |
3.3 |
3.3 |
3.3 |
|
| -10.00 |
1 |
1.7 |
1.7 |
5.0 |
|
| -6.00 |
4 |
6.7 |
6.7 |
11.7 |
|
| -5.00 |
1 |
1.7 |
1.7 |
13.3 |
|
| -4.00 |
3 |
5.0 |
5.0 |
18.3 |
|
| -3.00 |
5 |
8.3 |
8.3 |
26.7 |
|
| .00 |
3 |
5.0 |
5.0 |
31.7 |
|
| 3.00 |
3 |
5.0 |
5.0 |
36.7 |
|
| 4.00 |
3 |
5.0 |
5.0 |
41.7 |
|
| 5.00 |
1 |
1.7 |
1.7 |
43.3 |
|
| 6.00 |
6 |
10.0 |
10.0 |
53.3 |
|
| 8.00 |
11 |
18.3 |
18.3 |
71.7 |
|
| 9.00 |
3 |
5.0 |
5.0 |
76.7 |
|
| 10.00 |
3 |
5.0 |
5.0 |
81.7 |
|
| 12.00 |
11 |
18.3 |
18.3 |
100.0 |
|
| Total |
60 |
100.0 |
100.0 |
- |
|
Table 2. Symptoms Modified Missoula-Vitas® Quality Of Life Index.
Statistical analysis of the Symptoms shows that a total of 26.7% of the study participants were experienced physical discomfort associated with progressive illness that is perceived level of physical distress (Table 3, Figure 3).
Score |
Frequency |
Percent |
Valid Percent |
Cumulative Percent |
| -4.00 |
4 |
6.7 |
6.7 |
6.7 |
| -3.00 |
12 |
20.0 |
20.0 |
26.7 |
| .00 |
9 |
15.0 |
15.0 |
41.7 |
| 2.00 |
1 |
1.7 |
1.7 |
43.3 |
| 3.00 |
4 |
6.7 |
6.7 |
50.0 |
| 4.00 |
6 |
10.0 |
10.0 |
60.0 |
| 6.00 |
7 |
11.7 |
11.7 |
71.7 |
| 8.00 |
6 |
10.0 |
10.0 |
81.7 |
| 9.00 |
5 |
8.3 |
8.3 |
90.0 |
| 12.00 |
6 |
10.0 |
10.0 |
100.0 |
| Total |
60 |
100.0 |
100.0 |
- |
Table 3. Function.
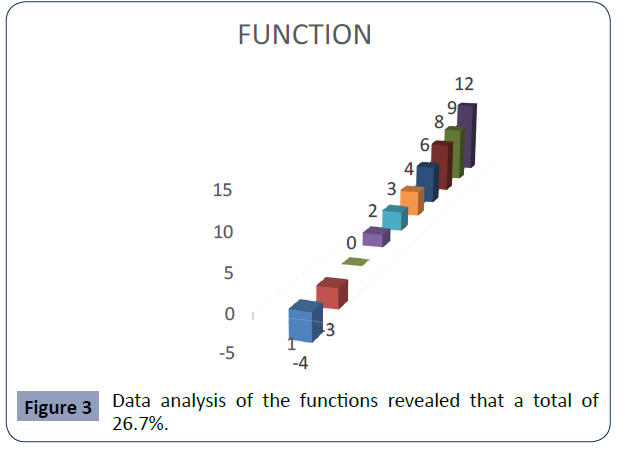
Figure 3 Data analysis of the functions revealed that a total of 26.7%.
The higher total score, the highest level of QOL.
| Assessment |
-2 |
-1 |
0 |
+1 |
+2 |
| Satisfaction |
+4 |
+3 |
0 |
-3 |
-4 |
| Importance |
5 |
4 |
3 |
2 |
1 |

Data analysis of the functions revealed that a total of 26.7% of the clients were experienced decreased ability to perform accustomed functions and activities of daily living, experienced in relation to activities (Table 4, Figure 4).
Score |
Frequency |
Percent |
Valid Percent |
Cumulative Percent |
| -20.00 |
2 |
3.3 |
3.3 |
3.3 |
|
| -16.00 |
4 |
6.7 |
6.7 |
10.0 |
|
| -15.00 |
1 |
1.7 |
1.7 |
11.7 |
|
| -12.00 |
5 |
8.3 |
8.3 |
20.0 |
|
| -10.00 |
1 |
1.7 |
1.7 |
21.7 |
|
| -9.00 |
3 |
5.0 |
5.0 |
26.7 |
|
| -8.00 |
1 |
1.7 |
1.7 |
28.3 |
|
| -4.00 |
4 |
6.7 |
6.7 |
35.0 |
|
| -3.00 |
6 |
10.0 |
10.0 |
45.0 |
|
| .00 |
10 |
16.7 |
16.7 |
61.7 |
|
| 6.00 |
2 |
3.3 |
3.3 |
65.0 |
|
| 8.00 |
9 |
15.0 |
15.0 |
80.0 |
|
| 9.00 |
6 |
10.0 |
10.0 |
90.0 |
|
| 12.00 |
6 |
10.0 |
10.0 |
100.0 |
|
| Total |
60 |
100.0 |
100.0 |
|
|
Table 4. Interpersonal.
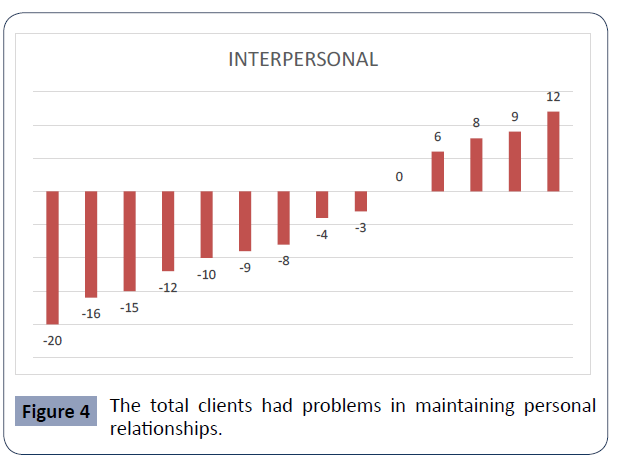
Figure 4 The total clients had problems in maintaining personal relationships.
The table shows that nearly half of the total clients had problems in maintaining personal relationships and they perceived their quality of relationship with family and friends were negatively affected when compared with previous disease-free life (Table 5, Figure 5).
| Score |
Frequency |
Percent |
Valid Percent |
Cumulative Percent |
| -18.00 |
1 |
1.7 |
1.7 |
1.7 |
| -16.00 |
10 |
16.7 |
16.7 |
18.3 |
| -15.00 |
1 |
1.7 |
1.7 |
20.0 |
| -12.00 |
2 |
3.3 |
3.3 |
23.3 |
| -9.00 |
2 |
3.3 |
3.3 |
26.7 |
| -8.00 |
1 |
1.7 |
1.7 |
28.3 |
| -6.00 |
2 |
3.3 |
3.3 |
31.7 |
| -4.00 |
5 |
8.3 |
8.3 |
40.0 |
| -3.00 |
6 |
10.0 |
10.0 |
50.0 |
| .00 |
17 |
28.3 |
28.3 |
78.3 |
| 5.00 |
1 |
1.7 |
1.7 |
80.0 |
| 6.00 |
4 |
6.7 |
6.7 |
86.7 |
| 8.00 |
1 |
1.7 |
1.7 |
88.3 |
| 9.00 |
4 |
6.7 |
6.7 |
95.0 |
| 10.00 |
1 |
1.7 |
1.7 |
96.7 |
| 12.00 |
1 |
1.7 |
1.7 |
98.3 |
| 16.00 |
1 |
1.7 |
1.7 |
100.0 |
| Total |
60 |
100.0 |
100.0 |
|
Table 5. Well-Being.
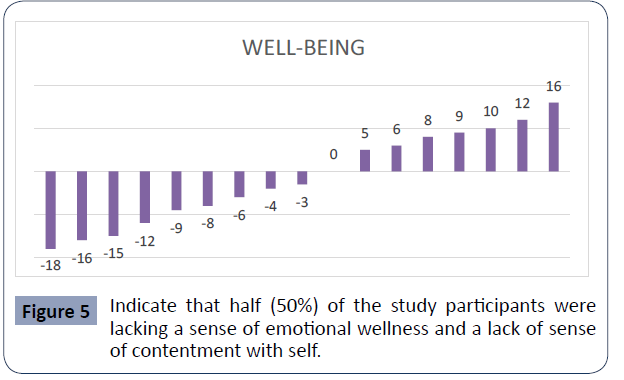
Figure 5 Indicate that half (50%) of the study participants were lacking a sense of emotional wellness and a lack of sense of contentment with self.
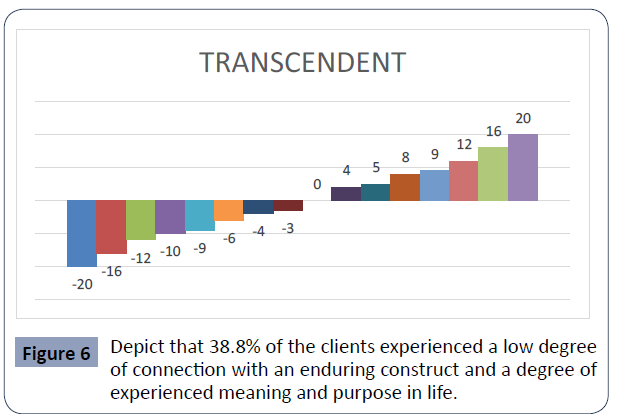
The above table and figure depict that 38.8% of the clients experienced a low degree of connection with an enduring construct and a degree of experienced meaning and purpose in life (Table 6, Figure 6).
Score |
Frequency |
Percent |
Valid Percent |
Cumulative Percent |
| -20.00 |
1 |
1.7 |
1.7 |
1.7 |
| -16.00 |
1 |
1.7 |
1.7 |
3.3 |
| -12.00 |
3 |
5.0 |
5.0 |
8.3 |
| -10.00 |
3 |
5.0 |
5.0 |
13.3 |
| -9.00 |
6 |
10.0 |
10.0 |
23.3 |
| -6.00 |
1 |
1.7 |
1.7 |
25.0 |
| -4.00 |
2 |
3.3 |
3.3 |
28.3 |
| -3.00 |
6 |
10.0 |
10.0 |
38.3 |
| .00 |
13 |
21.7 |
21.7 |
60.0 |
| 4.00 |
2 |
3.3 |
3.3 |
63.3 |
| 5.00 |
1 |
1.7 |
1.7 |
65.0 |
| 8.00 |
4 |
6.7 |
6.7 |
71.7 |
| 9.00 |
3 |
5.0 |
5.0 |
76.7 |
| 12.00 |
2 |
3.3 |
3.3 |
80.0 |
| 16.00 |
11 |
18.3 |
18.3 |
98.3 |
| 20.00 |
1 |
1.7 |
1.7 |
100.0 |
| Total |
60 |
100.0 |
100.0 |
- |
Table 6. Transcendent.
Figure 6 Depict that 38.8% of the clients experienced a low degree of connection with an enduring construct and a degree of experienced meaning and purpose in life.
Correlation of Quality of Life and selected demographic variables shows that the quality of life decreases with increase in of duration of illness (-0.235). Following an unhealthy diet pattern also found to be a factor in reducing the quality of life (Table 7).
| S.no |
Name of the variables |
Scale |
Pearson correlation |
Significance |
| 1 |
Age |
Modified Missoula-vitas® quality of life index |
-.091 |
.488 |
| 2 |
Sex |
Modified Missoula-vitas® quality of life index |
.184 |
.159 |
| 3 |
Marital status |
Modified Missoula-vitas® quality of life index |
-.038 |
..771 |
| 4 |
Occupation |
Modified Missoula-vitas® quality of life index |
0.223 |
0.086 |
| 5 |
Duration of illness |
Modified Missoula-vitas® quality of life index |
-.235 |
0.071 |
| 6 |
Co-morbid Conditions |
Modified Missoula-vitas® quality of life index |
0.134 |
0.307 |
| 7 |
Diet |
Modified Missoula-vitas® quality of life index |
-.137 |
0.296 |
| 8 |
Performing Sala |
Modified Missoula-vitas® quality of life index |
- |
- |
| 9 |
Number of times in a day doing sala |
Modified Missoula-vitas® quality of life index |
0.209 |
0.109 |
Table 7.Correlation between Quality of life and the selected demographic variables.
Results
Majority of the study participants (55%) belonged to 41-50 years followed by 16.7% in the 31-40 years age group. Most of the study participants (75%) reported sedentary lifestyle. Nearly half of the 40% had a history of Hypertension, followed by Diabetes (28.3%) and renal diseases (6.7%). The study also showed that most of the participants (71.7%) had an unhealthy dietary pattern. The statistical analysis of the collected data using Modified Missoula- Vitas Quality of Life Index was done in relation to symptoms, function, interpersonal, wellbeing and transcendent aspects.
It shows that a total of 26.7% of the study participants were experienced physical discomfort associated with progressive illness that is perceived level of physical distress. A total of 26.7% of the clients were experienced decreased ability to perform accustomed functions and activities of daily living, experienced in relation to activities. Nearly half of the total clients had problems in maintaining personal relationships and they perceived their quality of relationship with family and friends were negatively affected when compared with previous disease-free life. Also, half (50%) of the study participants were lacking a sense of emotional wellness and a lack of sense of contentment with self. 38.8% of the clients experienced a low degree of connection with an enduring construct and a degree of experienced meaning and purpose in life. Correlation of Quality of Life and selected demographic variables shows that the quality of life decreases with increase in of duration of illness (-0.235). Following an unhealthy diet pattern also found to be a factor in reducing the quality of life.
Conclusion
The statistical analysis of the collected data using Modified Missoula-Vitas Quality of Life Index showed reduced quality of life in all the aspects like physical discomfort (26.7%), decreased ability to perform accustomed functions and activities of daily living (26.7%), problems in maintaining personal relationships, and a lack of sense of contentment with self (50%) and a low degree of connection with an enduring construct and a degree of experienced meaning and purpose in life.
Purpose of the Study
The main purpose of the study is to analyse the quality of life with reference to symptom, function, well- being, interpersonal and transcendent dimensions; among ESRD patients who are undergoing haemodialysis mostly 2 to 3 times per week and to compare the different aspects of quality of life among them.
REFERENCES
- Amaral-Figueroa MI (2014) Physical activity in end-stage renal disease patients: a pilot project in Puerto Rico. P R Health Sci J 33.
Indexed at, Google Scholar
- Hiraki K (2013) Decreased physical function in pre-dialysis patients with Chronic Kidney Disease. J ClinExp Nephr 17.
Indexed at, Google Scholar, Crossref
- Johansen K L (2000) Physical activity levels in patients on hemodialysis and healthy sedentary controls. Kidney Int 57.
Indexed at, Google Scholar, Crossref
- Moinuddin I, Leehey D J (2008) A comparison of aerobic exercise and resistance training in patients with and without chronic kidney disease. Adv Chronic kid Dis 15.
Indexed at, Google Scholar, Crossref
- Painter P (2014) Physical function and physical activity assessment promotion in the hemodialysis clinic: a qualitative study. Am J Kid dis 64.
Indexed at, Google Scholar, Crossref
- Padilla J etal (2008) Physical functioning in patients with Chronic Kidney Disease J Nephrology 21.
Indexed at, Google Scholar
- Trisha L (2006) Exercise Training during Hemodialysis Improves Dialysis Efficacy and Physical Performance. Arc h Phys Med Rehabil 87.
Indexed at, Google Scholar, Crossref
- Christensen A, Ehlers S (2002) Psychological factors in end-stage renal disease: An emerging context for behavioral medicine research. J Cons Clin Psy 70:712-724.
Google Scholar
- Md. Yusop NB, Yoke Mun C, Shariff ZM, Beng Huat C (2013) Factors Associated with Quality of Life among Hemodialysis Patients in Malaysia 8:e84152.
Google Scholar, Crossref
- Ira Byock MD the Missoula Vitas Quality of life Index (MVQOLI): An Outcome measure for Palliative care.
Google Scholar
- Roger WE (1985) the Quality Of Life Of Patients With ESRD. N Engl J Med 312:9.
- Kamyar K, Joel D, Gladys B, Michael H (2001) Association among SF 36 QOL measures and Nutrition, Hospitalization & Mortality. American Society of Nephrology.
Google Scholar
- Saby A, Miller LS (2016) Functional Assessment in ESRD: enhancing quality of life. Willey Periodicals Semin Dial 29:170-2.
Google Scholar
- Abdelbasit MAA (2012) Quality of life Among Dialysis Patients in United Arab Emirates. Victoria university of wellington
Google Scholar
- Cynthia I Taylor (2010) Quality of life in hemodialysis patients”, University of Tennesier. Chattanooga.
Google Scholar
- Deigo (2016) Physical Activity of Hemodialysis Patients Fisioterapia pesquiza online version 23.
Google Scholar
- DiseaseJi-Cheng Lv, Lu-Xia Zhang (2018) Prevalence and Disease Burden of Chronic Kidney. Adv Exp Med Biol 1165:3-15
Indexed at, Google Scholar, Crossref
Citation: Zahrani HA, Saseendrababu S, Rejennal AT (2022) Quality Of Life among End Stage Renal Disease Patients with Hemodialysis, At Arar, Kingdom Of Saudi Arabia. Health Sci J. Vol. 16 No. 11: 983


