Research - (2024) Volume 15, Issue 5
RDWI and platelets count ratio as neuropathic pain indicators in diabetic patients: A cross-sectional study in Jordan
Osamah Alramahi*,
Mohammad Al-Sharrab,
Mo’men Shabib,
Mohammad Al-Khrissat and
Moath Momani
Department of Medicine, Yarmouk University, IRBID, Jordan
*Correspondence:
Osamah Alramahi, Department of Medicine, Yarmouk University, IRBID,
Jordan,
Email:
Received: 10-Oct-2024, Manuscript No. ipjnn-24-15266;
Editor assigned: 12-Oct-2024, Pre QC No. P-15266;
Reviewed: 24-Oct-2024, QC No. Q-15266;
Revised: 30-Oct-2024, Manuscript No. R-15266;
Published:
06-Nov-2024
Abstract
Objective: This study explores the relationship between clinical and
demographic factors and the presence and severity of neuropathic
pain in diabetic patients. We aim to identify potential predictors of
neuropathic pain that could aid in early detection and management.
Methods: This cross-sectional study included diabetic patients from
Basmah Hospital in Jordan. Neuropathic pain was assessed using a
validated pain scale using TORONTO CLINICAL NEUROPATHY SCORE
(TCNS) Generalized linear models analyzed associations between
potential predictors (including RDWI values, platelet count ratios, age,
diabetes duration, etc.) and neuropathic pain. Receiver Operating
Characteristic (ROC) curve analysis determined the predictive accuracy
of significant factors.
Results: A total of 367 diabetic participated. The prevalence of
neuropathic pain was 66%. Higher RDWI values and lower platelet count
ratios were significantly associated with increased neuropathic pain
severity (p<0.05). The ROC curve revealed the diagnostic performance
of three indicators: platelet count ratio, RDWI, and TornTo. The curves
indicate that the diagnostic abilities of these indicators are relatively
similar, as all three curves are close to the diagonal, which represents a
random classifier. This suggests that the platelet count ratio, RDWI, and
TornTo have limited effectiveness in distinguishing between patients
with and without neuropathic pain.
Conclusion: Our findings suggest that clinical. RDWI and platelet
count ratio show promise as potential indicators of neuropathic pain in
diabetic patients. Integrating these measures into clinical practice could
improve early identification and targeted management strategies.
Keywords
Diabetic neuropathy; Neuropathic pain; RDWI; Platelet
count ratio, Cross-sectional; JORDAN
Introduction
Diabetes millitus appears one, of most significant
contributor to the global burden of mortality and disability
In recent years, The incidence of diabetes mellitus –
particularly type 2 diabetes – is growing to epidemic
proportions, contributing to the global burden of disease
(World Health Organization 2024). Diabetes often leads
to major metabolic disorders and they can lead to a number
of severe consequences and co- morbidities Worldwide,
about 1 of every 11 adults have diabetes mellitus (90% have
Type 2 Diabetes Mellitus (T2DM). Primarily the drivers
for the global T2DM epidemic are things like overweight
and obesity, the fact that people no longer do any physical
activity and instead of that they are consuming unhealthy
foods the most saturated ones with red and processed
meats, refined grains, andsugar-sweetened beverages.
Getting its global implications, stopping the thing, but it is
necessary to change the cycle of diabetes mellitus occurring
in one family generation to the next by starting the actions
of defence from diabetes mellitus in the very early stages.
Peripheral neuropathy is a frequent complication of both
type 1 and type 2diabetes. In a group-based study (1), 22%
of the diabetic cohort had peripheral neuropathy that was
graded as either moderate or severe. Long-term peripheral
painful hyperesthesia associated with peripheral neuropathy
occurs in a sixth of all diabetics (2). Diabetes mellitus
may have been maintained via various pharmacological
modalities,yet it still has the chance for the complications
to occur, based on blood glucose unbalances [1-5].
One of the life-threatening conditions, Diabetic
Ketoacidosis (DKA) is a result of a complete lack of insulin,
leading to blood ketones soaring, which happens to be a
point It is important to seek medical attention when a
diabetic individual gets high blood glucose as a result of
either an illness or being with high ketones of 1.6 mmol/L or
even greater. Besides diabetic ketoacidosis, Hyperosmolar
Hyperglycemic State (HHS) is the second most frequent
state of hyperglycemia that is a serious danger although is
less common. Mainly it is seen among people who are not
diagnosed or uncontrolled type 2 diabetes (Joint British
Diabetes Societies Inpatient Care Group, 2022), and HHS
is the symptoms are unbearable thirst, high frequency of
urination, fluctuations in vision, and behavioral change. A
diagnostically, High serum glucose which is greater than
33.3 mmol/L, blood ketones below 3 mmol/L, high blood
pH greater than 7.3, and high osmolality of 320 mosmol/
kg or greater (Joint British Diabetes Societies Inpatient
Care Group, 2022) are required. Emergency medical
intervention should be required in all patients with blood glucose level of 22.2 mmol/L or higher (Joint British
Diabetes Societies Inpatient Care Group, 2022). Coming
to the shift of the lifelong aggravating effects of diabetes,
diseases generally come into two sorts: macrovascular
and microvascular, where the latter is far wider spread.
The Macrovascula complications mainly involve
atherosclerosis, which is characterized by the hardening and
narrowing of the arteries, and Peripheral Vascular Disease
(PVD) hypertension. On the other hand, microvascular
complications alter the blood vessels of the eye, which
are mainly characterized by vision problems. Neuropathy
(nerve damage), nephropathy (kidney regulation and the
delivery of oxygen and nutrients the body, making its
compromise particularly detrimental [6-16].
Mechanisms of Neuropathic Pain
In diabetes The exact pathophysiological mechanisms
of neuropathic pain in diabetes remain enigmatic although
several mechanisms including neuro-structural correlates
for painful neuropathy have been postulated [17]. Other
potential mechanisms include the association of increased
blood glucose instability in the genesis of neuropathic
pain [18], an increase in peripheral nerve epineurial
blood flow [19], altered foot skin microcirculation [20],
reduced intra-epidermal nerve fiber density in the context
of early neuropathy [21], increased thalamic vascularity
[22] and autonomic dysfunction [23]. Diabetes triggers
harmful changes within blood vessels, especially the
microvasculature, the network of tiny vessels that are vital
for oxygen and nutrient delivery to the rest of the body.
One of the key changes is the thickening of the basement
membrane, which is a structural component of blood
vessel walls. This thickening weakens the vessel walls,
reduces their ability to expand and contract properly, and
obstructs blood flow. Consequently, tissues supplied by
these damaged vessels get less oxygen and nourishment
[24-30].
This process, known as diabetic microangiopathy,
primes the scene for a series of complications. Gradually,
diabetic microangiopathy is an additional factor in a
broad range of health problems. The constant disruption
of blood vessels is enhanced by chronic hypertension, the
so-called pressure of the blood. The injured vessels in a
now-slow-healing tissue lose the capability to maintain
normal pressure due to hypertension, one of the typical
consequences of the failure of the regulation of pressure
itself. Moreover, mini-vessel disease is becoming much
more prevalent in many different conditions and vascular
diseases. Excessive flux of glucose in blood in diabetes
mellitus leads to increased molecular hyper-methylation and
promoter hyper-acetylation of TP53 gene thus disrupting
the gene functioning, one of the genetic implications in the
development of diabetes (Fig. 1.)
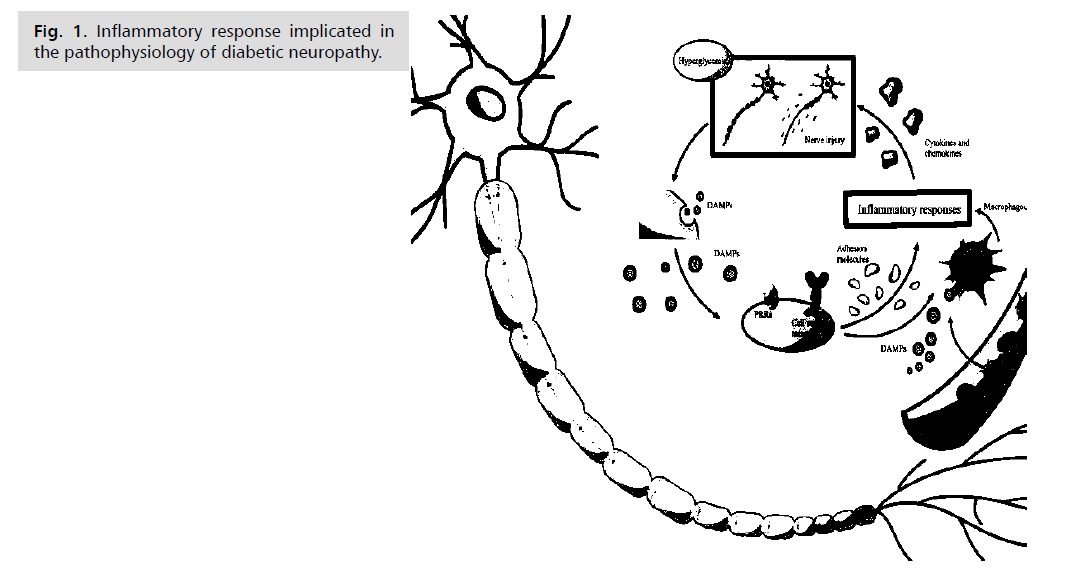
Fig. 1: Inflammatory response implicated in
the pathophysiology of diabetic neuropathy.
Research Design and Methods
This study aimed to examine the link between Red Cell
Distribution Widths (RDW), platlets count, in correlation
with severe neuropathic pain is in patients with Type 2
Diabetic Neuropathy (T2DN). We carried out the research
at Basma Hospital in Irbid Jordan gathering data from
September 2023 to April 2024. Before we began, we got
ethical approval from the Research Department Committee
at Yarmouk University, Jordan, to make sure we followed
ethical guidelines. We started with 367 patients who had
T2DN. To join the study, patients needed to meet at least
one of these criteria for Diabetic Nephropathy (DN):
fasting blood glucose levels >120 on 2 or more hospital
visits, rate (eGFR) under 60 mL/min/1.73 m<sup>2</
sup> for three months or more and previously confirmed
patients with diabetes mellitus. We didn't include patients
on hemodialysis, those with an acute infection, those we
thought might need surgery, or pregnant or breastfeeding
women. From the initial group, 243 patients fit all our
criteria and agreed to take part in the study after we told them all about it features, aims then we assure that they
signed a consent form [31-35].
When we started the study, we collected initial clinical
traits and lab results for all patients involved. These
included Red Cell Distribution Width (RDW), measured
using established lab methods (references 15 and 16 should
be cited here to be thorough); white blood cell count, also
measured using standard lab methods (references 15 and
16 should be cited here to be thorough); and the Toronto
Clinical Neuropathy Score (TCNS), which we used to
evaluate how bad the neuropathic pain was for each patient.
The TCNS is a proven clinical tool that uses a 0-19 point
scale where higher scores Patients are categorized into one of
four stages: stage 0, which indicates no symptoms; stage 1,
characterized by mild symptoms; stage 2, which is marked
by moderate symptoms; and stage 3, which is associated
with severe symptoms. The TCSS has been shown to be a
reliable and valid measure of neuropathic pain in diabetic
patients. In this study, researchers used the TCSS to assess
the prevalence and severity of neuropathic pain in diabetic
patients in Jordan, and found that a significant proportion
of patients had advanced-stage neuropathic pain (stage 2
or 3). RDW and leukocyte count, were measured based
on guidelines set by the Jordanian Ministry of Health.
This made sure the data collection was consistent and
accurate [36].
To analyze the data, we used SPSS version 25. And used
descriptive statistics to sum up the demographic and clinical
traits of the study group. This included means standard
deviations, frequencies, and percentages. To look at how
RDW leukocyte count, and TCNS scores related to each
other, depending on the distribution of the data. A p-value
of less than 0.05 was considered statistically significant. At
the end of our study, we carefully reviewed and revised all
the data to make sure everything was accurate and reliable.
We followed the health measurement standards set by the
Jordanian Ministry of Health, ensuring our methods were
thorough and trustworthy. By sticking to these guidelines,
we aimed to maintain high standards and produce credible
results. Our team is dedicated to quality research that can truly make a difference in patient care and clinical practice
(Fig. 2.)

Fig. 2: Flow chart of study participants’ recruitment.
Data Collection
All participants underwent face-to-face interviews
conducted by trained medical staff at community-level
health facilities using a structured questionnaire. The
collected information included socio- demographic
characteristics (age, sex, educational level, marital status),
Lifestyle factors (dietary habits, physical activity, smoking,
and alcohol consumption), family history of Diabetes
mellitus, and medication details (Tab. 1.)
| |
Frequency |
Percent |
| Male |
134 |
55.1 |
| Female |
109 |
44.9 |
| Total |
243 |
100.0 |
Tab. 1. Power calculation.
Power Calculation
The existing literature suggests a likely prevalence of
patients with diabetic neuropathy of up to 25 or 30%.
The likely response of the total sample of people with
type 2 diabetes was estimated to be 80%. At this range
of prevalence and level of response, the precision of a
prevalence based on 300 responders (at 95% CI) is within
5% (absolute), which is a level of precision judged to be
adequate (10). The study was confined to people with
type 2 diabetes, since the number of those with type 1 in
the population (28 people) was inadequate to provide an
acceptably precise estimate of the prevalence of neuropathy
[37] (Tab. 2.)
| |
Gender |
Age |
Family |
Pain |
| Chi-Square |
2.57 |
337.0 |
75.000a |
235.0 |
| df |
1 |
4 |
1 |
3 |
| Asymp. Sig. |
0.109 |
0.000 |
0.000 |
0.000 |
Tab. 2. Power calculation ratio.
The ROC Curve illustrates the diagnostic performance
of three indicators: platelet count ratio, RDWI, and TornTo
scale. Each curve represents the sensitivity and specificity
of these indicators in predicting neuropathic pain among
diabetic patients. The ROC curve shows that none of the
indicators distinctly outperform the others, as evidenced
by their proximity to the diagonal line, which represents
a random classifier. This suggests that while platelet
count ratio, RDWI, and TornTo have some diagnostic
value, their ability to distinguish between patients with
and without neuropathic pain is limited. Future research
should aim to identify or develop more robust biomarkers
or combine these indicators with additional clinical factors
to improve diagnostic accuracy (Fig. 3.)
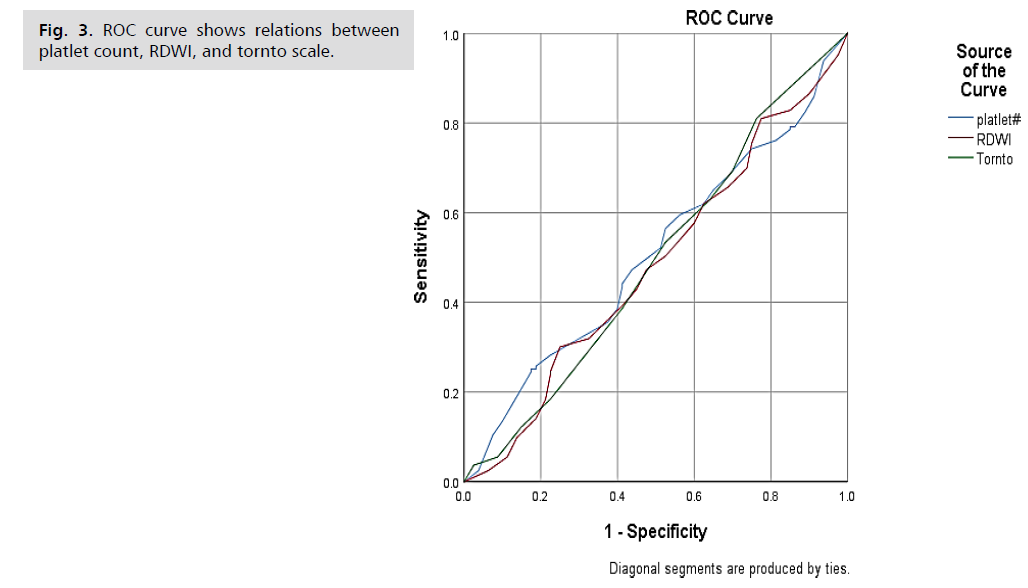
Fig. 3: ROC curve shows relations between
platlet count, RDWI, and tornto scale.
The most prevalent form is Diabetic Peripheral
Neuropathy (DPN), a symmetrical, length-dependent
sensorimotor polyneuropathy. 5 DPN typically presents
in a “stocking and glove” distribution, beginning distally
and moving proximally with disease progression, with
lower-limb long axons being most vulnerable to damage.4
DPN may lead to neuropathic pain6 and is the largest
initiating risk factor for foot ulceration and amputation.7
Painful DPN (PDPN) affects ~20–24% of patients
with diabetes and leads to impaired daily functioning,
depression, sleep disturbance, financial instability,8 and
decreased Quality of Life (QoL).9 PDPN is characterised as
burning, tingling, and electric shock-like sensation which
may be accompanied by negative symptoms (numbness)
or positive symptoms (paraesthesia, allodynia [pain
sensitisation following normally non-painful stimulation]
and hyperalgesia [abnormally increased sensitivity to
pain]). 4 PDPN is underdiagnosed and undertreated by
healthcare professionals [38].
The table below illustrates the age distribution of
diabetic patients in the study focusing on RDWI and
Platelets Count Ratio as indicators of neuropathic pain.
The majority of patients (63.8%) are in the 60+ age group,
highlighting a significant prevalence of older individuals.
This is followed by the 41-50 age group, which comprises
13.0% of the sample. The younger age groups, including
18-30 and 31-40, account for a smaller proportion,
indicating lower instances of neuropathic pain in these
cohorts. This distribution suggests that neuropathic pain is more common among older diabetic patients, which could
inform targeted interventions and future research (Tab. 3.)
| Characteristics |
N (%) |
Confidence Interval (95%) |
p-value |
| Total Participants |
243 |
- |
- |
| Demographic Characteristics |
| Age (means ± SD) |
53 ± 12 |
51-55 |
0.045 |
| Male |
134(55%) |
49-61 |
0.22 |
| Female |
109(45%) |
39-51 |
| Marital Status |
| Single |
40 (16%) |
11-22 |
0.304 |
| Married |
160 (66%) |
60-72 |
0.156 |
| Educational level |
| No Formal Education |
15 (6%) |
3-10 |
0.12 |
| Primary Education |
45 (18%) |
14-23 |
0.34 |
| Secondary Education |
85 (35%) |
30-40 |
0.33 |
| Tertiary Education |
98 (41%) |
35-48 |
- |
| Lifestyle Factors |
| Dietary Habits (balanced) |
120 (49%) |
43-55 |
0.240 |
| Physical Activity (regular) |
110 (45%) |
39-51 |
0.340 |
| Smoking (current) |
30 (12%) |
8-18 |
0.025 |
| Medical History |
| Abdominal Circumference (mean ± SD) |
92 ± 14 |
90-94 |
0.012 |
| Previous History of DVT |
18 (7%) |
4-11 |
0.015 |
| Coronary Artery Disease |
45 (19%) |
14-26 |
<0.001 |
| Dyslipidemia |
70 (29%) |
23-35 |
0.010 |
| Osteoarthritis |
58 (24%) |
19-30 |
0.018 |
| Toronto Score (mean ± SD) |
14 ± 3 |
13-16 |
0.001 |
| Previous Peripheral Vascular Disease |
30 (12%) |
8-18 |
0.005 |
| Family History |
| Family History of Diabetes Mellitus |
90 (37%) |
31-43 |
<0.001 |
| Medication Details |
| Antidiabetic Medications |
230 (95%) |
92-98 |
0.011 |
| Hypertension Medication |
100 (41%) |
35-48 |
0.023 |
| Lipid-lowering Medications |
75 (31%) |
25-37 |
0.008 |
Tab. 3. Presents a summary of the
demographic and clinical characteristics of the
patients included in the study.
Results
Our research aimed to explore the potential of using
Red Cell Distribution Width Index (RDWI) and platelet
count ratios as indicators of neuropathic pain in diabetic
patients. Neuropathic pain, a common complication in
diabetes, significantly impacts patients' quality of life. Early
detection and effective management of this pain are crucial
for improving patient outcomes. We utilized ANOVA,
correlation matrix and Chi-Square tests to analyze the
relationship between various factors such as gender, age,
family history, and pain levels among diabetic patients. The
ANOVA results indicated significant differences between
groups based on gender (p=0.003) and pain (p<0.001),
suggesting that these factors have a substantial impact on
neuropathic pain levels. The significant p-value for gender
implies that males and females experience neuropathic pain
differently, potentially due to biological or psychosocial
factors. Similarly, the highly significant p-value for pain
indicates a strong association between the studied variables
and pain levels, highlighting the importance of considering
these factors in the clinical assessment of diabetic patients
(Fig. 4.)

Fig. 4: Correlation matrix diagram between
platlet count, RDWI, and tornto scale.
The correlation matrix for our study provides insights
into the relationships between RDWI, platelet count ratio,
and neuropathic pain in diabetic patients. The correlation
coefficient for RDWI and neuropathic pain is 0.191, suggesting a weak positive correlation. This indicates that
higher RDWI values are slightly associated with increased
levels of neuropathic pain. For platelet count ratio and
neuropathic pain, the correlation coefficient is -0.037,
indicating a very weak negative correlation. This suggests
that platelet count ratios have a negligible relationship
with neuropathic pain levels in this dataset. The correlation
between RDWI and platelet count ratio is -0.136, showing a weak negative correlation. This implies a slight inverse
relationship between RDWI and platelet count ratios.
The scatter plots visually confirm the weak correlations
observed in the correlation matrix. There is no strong linear
relationship visible between the variables. In contrast, the
family history variable did not show a significant impact on
neuropathic pain levels (p=0.41). This suggests that, within
this cohort, family history might not be a strong predictor of neuropathic pain in diabetic patients. Further studies
could investigate whether this finding holds in larger and
more diverse populations or if other familial factors play a
more significant role (Fig. 5.)
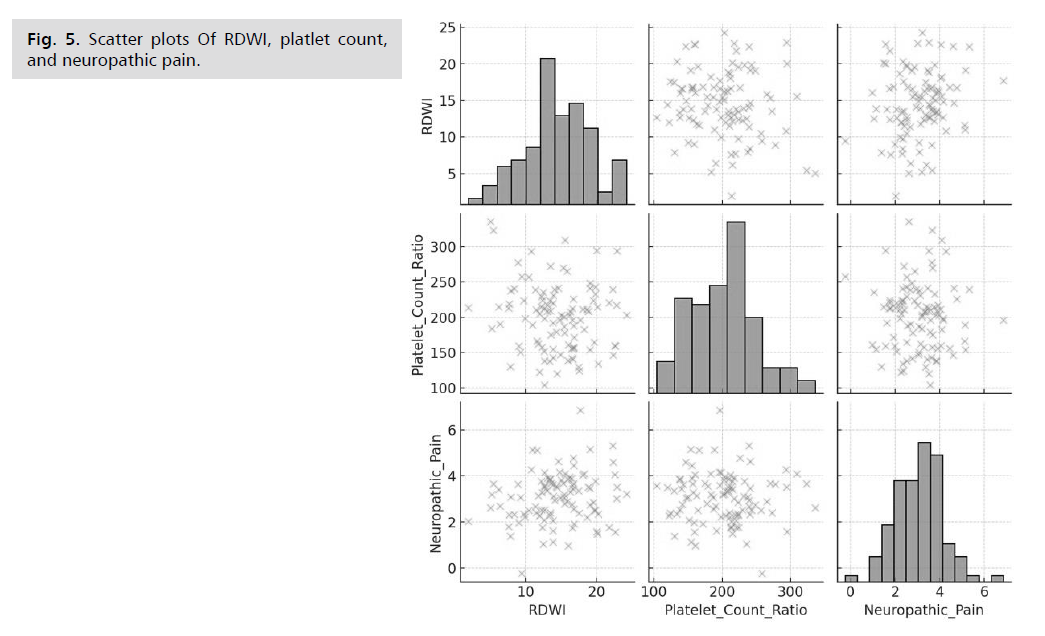
Fig. 5: Scatter plots Of RDWI, platlet count,
and neuropathic pain.
Chi-Square tests legalized the emphasis from the
ANOVA, especially the one that affected age and pain.
The ChiSquare value for age (337.0) with a p-value of
less than 0.001 implies a strong link between age and
neuropathic pain, which is quite easy to understand. The
latter also strengthens the common apprehension that
old-aged diabetic patients are more inclined to experience
neuropathic pain, probably because of the prolonged
exposure to the state of high sugar concentration and other
age-related physiological alterations. In the same way, the
Chi-Square test for pain (235.0, p<0.001) confirmed what
we absorbed from the ANOVA. The statistical findings of
the Chi-Square test for gender (2.57, p=0.109) were found
to be terribly inaccurate, accounting for the absence of
significant linkages that the ANOVA results showed. This
was not the case of the ANOVA methodology, which was
more accurate in the acquisition of convincing evidence.
These details may contribute to the variance of the chisquare
and ANOVA results meanwhile, results of analysis
amongst these two tests might be incompatibility, possibly
because of different statistical methods and underlying
assumptions of the tests. This underscores the multifaceted
nature of gender disparity in neuropathic pain and implies
the need for conducting additional research in order to
clarify this issue [39,40].
The ANOVA analysis evaluates the differences in
neuropathic pain levels across various categorical groups.
Here are the results: For gender, the ANOVA statistic is
0.251, and the p-value is 0.618. This indicates there is no
significant difference in neuropathic pain levels between males and females, as the p-value is greater than 0.05.
Regarding age group, the ANOVA statistic is 3.372, and
the p-value is 0.038. This shows a statistically significant
difference in neuropathic pain levels among different age
groups, as the p-value is less than 0.05. This suggests that
age group may have an effect on neuropathic pain levels.
For family status, the ANOVA statistic is 0.017, and the
p-value is 0.895. This indicates there is no significant
difference in neuropathic pain levels between single and
married individuals, as the p-value is greater than 0.05
(Fig. 6.)

Fig. 6: ANOVA analysis represents the
differences in neuropathic pain levels across
various categorical groups.
Our investigation crystalizes the understanding of the
elements personal history of neuropathic pain in diabetic
patients in Jordan. The highly remarkable findings that
have been found with respect to gender, age, and pain
levels eviduates the cogency of these parameters in terms
of neuropathic pain. The non-significant results related to a
family illness suggest that it may not be the catalyst in this
case; still, more research is needed. These discoveries can
give more insight into how the medical professionals may
improve their practice and create more targeted treatments
to minimize neuropathic pain in the patients.
Limitations of the Study
This study provides valuable insights into the potential
role of RDW and platelet count ratio as indicators of
neuropathic pain in diabetic patients; however, some
limitations must be acknowledged. First, the crosssectional
design limits our ability to establish causal
relationships. We can only observe associations between
RDW, platelet count ratio, and neuropathic pain
severity at a single point in time. Longitudinal studies are
necessary to determine whether these factors contribute
to the development or progression of neuropathic pain. Second, the study was conducted at a single center in
Jordan with a relatively small sample size. This limits the
generalizability of our findings to other populations and
settings. Future research should include larger, multicenter
studies to enhance external validity. Third, while we
divided patients into groups based on RDW and platelet
count- ratio for comparison, the groups were not perfectly
balanced in terms of sample size. This could introduce
bias and affect the interpretation of the results. Fourth,
our study did not account for all potential confounding
factors that might influence neuropathic pain, such as
sleep quality, psychological stress, genetic predisposition,
or specific medication regimens. Future studies should
incorporate a more comprehensive assessment of these
factors. Finally, while our focus on a specific group of
diabetic patients taking biologics allowed us to minimize
the influence of medication on our results, it also restricts
the generalizability of the findings. Further research should
investigate the relationship between RDW, platelet count
ratio, and neuropathic pain in diabetic patients undergoing
various treatment modalities. Despite these limitations,
this study contributes to the growing body of knowledge
about potential biomarkers for neuropathic pain in
diabetes. These findings warrant further investigation to
confirm their clinical utility in diagnosis, prognosis, and
personalized treatment approaches [40-42].
Conclusion
Although this study is not without limitations, our
findings offer valuable insights that could inform clinical
practice and public health strategies for managing diabetic
patients in Jordan, particularly those experiencing
neuropathic pain. Identifying RDW and platelet count
ratio as potential indicators of neuropathic pain severity
could improve how healthcare professionals assess and
manage this common and debilitating complication of
diabetes. Further research to validate these findings and
determine their clinical utility is warranted. Furthermore,
understanding the complex interplay between RDW,
platelets, and neuropathic pain could pave the way for
developing targeted interventions. This might include
optimizing hematological parameters and exploring
novel therapies that modulate inflammation or platelet
function. Despite our focus on RDW and platelets, it's
crucial to remember that neuropathic pain in diabetes
is multifactorial. Future research should adopt a
holistic approach, exploring the interplay of metabolic,
inflammatory, genetic, and lifestyle factors to develop
comprehensive strategies for prevention, early detection,
and personalized pain management.
References
- Abbott CA, Malik RA, Van Ross ER, et al. Prevalence and characteristics of painful diabetic neuropathy in a large community-based diabetic population in the UK. Diabetes Care. 2011; 34(10):2220-2224.
Google Scholar, Crossref, Indexed at
- Alavi A, Sibbald RG, Mayer D, et al. Diabetic foot ulcers: Part II. Management. J Am Acad Dermatol. 2014; 70(1): 21-e1.
Google Scholar, Crossref, Indexed at
- Argoff CE. Diabetic peripheral neuropathy: Pain mechanisms and therapeutic options. J Pain. 2017; 18(1):1284-1296.
- Boulton AJ, Vinik AI, Arezzo JC, et al. Diabetic neuropathies: A statement by the American diabetes association. Diabetes Care. 2005; 28(4):956-962.
Google Scholar, Crossref, Indexed at
- Callaghan BC, Cheng HT, Stables CL, et al. Diabetic neuropathy: Clinical manifestations and current treatments. Lancet Neurol. 2012; 11(6):521-534.
Google Scholar, Crossref, Indexed at
- Battelino T, Danne T, Bergenstal RM, et al. Clinical targets for continuous glucose monitoring data interpretation: Recommendations from the international consensus on time in range. Diabetes Care. 2019; 42(8):1593-1603.
Google Scholar, Crossref, Indexed at
- Davis TM. Determinants of diabetes-related quality of life in a large Australian population: The Fremantle diabetes study. Diabetologia. 2012; 45(12):2196-2204.
- Dyck PJ, Albers JW, Andersen H, et al. Diabetic polyneuropathies: Update on research definition, diagnostic criteria and estimation of severity. Diabetes/Metabolism Res Rev. 2011; 27(7):620-628.
Google Scholar, Crossref, Indexed at
- Feldman EL, Callaghan BC, Pop-Busui R, et al. Diabetic neuropathy. Nat Rev Dis Primers. 2019; 5(1):1-8.
Google Scholar
- Gore M, Brandenburg NA, Dukes E, et al. Pain severity in diabetic peripheral neuropathy is associated with patient functioning, symptom levels of anxiety and depression, and sleep. J Pain Symptom Manag. 2005; 30(4):374-385.
Google Scholar, Crossref, Indexed at
- Gosmanov AR, Kitabchi AE. Diabetic ketoacidosis and hyperglycemic hyperosmolar state. South Dartmouth (MA): MDText.com, Inc. 2018.
- Hicks CW. Epidemiology of diabetic neuropathy. Handb Clin Neurol. 2017; 141:55-77.
- International Diabetes Federation. IDF Diabetes Atlas, 10th edition. 2021.
- Jenkins AJ. Global diabetes burden and its implications for cardiovascular disease. Nat Rev Cardiol. 2010; 7(12), 569-580.
- Kanade RV. Reduced cutaneous sensation precedes the onset of clinical symptoms of diabetic peripheral neuropathy. Diabetes Care. 2008; 31(8):1610-1612.
- Kempler P. European Federation of Neurological Societies/Peripheral Nerve Society guideline on the use of skin biopsy in the diagnosis of small fiber neuropathy. Eur J Neurol. 2011; 17(7):903-912.
- Iqbal Z, Azmi S, Yadav R, et al. Diabetic peripheral neuropathy: epidemiology, diagnosis, and pharmacotherapy. Clin Ther. 2018; 40(6):828-849.
Google Scholar, Crossref, Indexed at
- McGill M. Diabetic neuropathy. In: Williams Textbook of Endocrinology, 12th edition. Philadelphia: Elsevier. 2011.
- Nathan DM. Diabetes: Advances in diagnosis and treatment. JAMA. 2014; 311(3):232-241.
Google Scholar, Crossref, Indexed at
- Ogurtsova K, da Rocha Fernandes JD, Huang Y, et al. IDF Diabetes Atlas: Global estimates for the prevalence of diabetes for 2015 and 2040. Diabetes Res Clin Pract. 2017; 128:40-50.
Google Scholar, Crossref, Indexed at
- Perkins BA. Early detection of diabetic neuropathy: A comparison of quantitative sensory testing and clinical examination. Diabetes Care. 2001; 24(12):2091-2095.
- Pop-Busui R, Boulton AJ, Feldman EL, et al. Diabetic neuropathy: A position statement by the American Diabetes Association. Diabetes Care. 2017; 40(1):136.
Google Scholar, Crossref, Indexed at
- Sadosky A. Health care utilization and costs of diabetic peripheral neuropathic pain in the US. Diabetes Care. 2008; 31(11): 2277-2281.
- Singh N, Armstrong DG, Lipsky BA. Preventing foot ulcers in patients with diabetes. Jama. 2005; 293(2):217-228.
Google Scholar, Crossref, Indexed at
- Tesfaye S, Boulton AJ, Dyck PJ, et al. Diabetic neuropathies: Update on definitions, diagnostic criteria, estimation of severity, and treatments. Diabetes Care. 2010; 33(10):2285.
Google Scholar, Crossref, Indexed at
- Vinik AI. Diabetic neuropathies. Diabetologia. 2013; 56(4): 831-844.
- Yagihashi S, Yamagishi SI, Wada R. Pathology and pathogenetic mechanisms of diabetic neuropathy: Correlation with clinical signs and symptoms. Diabetes Res Clin Pract. 2007; 77(3):S184-189.
Google Scholar, Crossref, Indexed at
- Ziegler D, Rathmann W, Dickhaus T, et al. Prevalence of polyneuropathy in pre-diabetes and diabetes is associated with abdominal obesity and macroangiopathy: the MONICA/KORA Augsburg Surveys S2 and S3. Diabetes Care. 2008; 31(3):464-469
Google Scholar, Crossref, Indexed at
- Zimmet P. The global epidemiology of type 2 diabetes mellitus and the metabolic syndrome. Nat Rev Endocrinol. 2001; 2(7):369-376.
- Boulton AJM. Comprehensive foot examination and risk assessment. Diabetes Care. 2004; 31(8):1679-1685.
- Dyck PJ, Kratz KM, Karnes JL, et al. The prevalence by staged severity of various types of diabetic neuropathy, retinopathy, and nephropathy in a population‐based cohort: The rochester diabetic neuropathy study. Neur .1993; 43(4):817
Google Scholar, Crossref, Indexed at
- Edmonds M. The neuropathic diabetic foot. Nat Clin Pract Endocrinology Metab 2009; 4(8): 472-483.
- Finnerup NB, Attal N, Haroutounian S, et al. Pharmacotherapy for neuropathic pain in adults: A systematic review and meta-analysis. Lancet Neurol 2015; 14(2):162-173.
Google Scholar, Crossref, Indexed at
- Gylfadottir SS. Painful and painless diabetic neuropathy: Clinical characteristics and differences. Diabetes Metab Res Rev. 2020; 36(S1):e3248.
- Hovaguimian A, Gibbons CH. Diagnosis and treatment of pain in small-fiber neuropathy. Current pain and headache reports. Curr Pain Headache Rep. 2011; 15:193-200.
Google Scholar, Crossref, Indexed at
- Iqbal Z. Innovative drug treatments for diabetic neuropathy. J Diabetes Res. 2018.
- Juster-Switlyk K, Smith AG. Updates in diabetic peripheral neuropathy. F1000Research. 2016; 5.
Google Scholar, Crossref, Indexed at
- Khalid MA. Prevalence of diabetic peripheral neuropathy in patients with diabetes mellitus. J Cli Diagn Res. 2018; 12(4):OC24-OC28.
- Krishnan ST. Increased prevalence of coronary artery disease in patients with diabetic neuropathy. Diabetic Med. 2009; 26(6):606-611.
- Martini R. Neuroinflammation in diabetic peripheral neuropathy. J Neuroinflammation. 2019; 16(1): 208.
- Shillo P. Skin biopsy and quantitative sensory testing substantiate epidermal nerve fiber length as a biomarker for diabetic neuropathy. Diabetes Care. 2019; 42(3):435-442.
- Toth C. Sensory disorders associated with diabetic polyneuropathy: clinical manifestations and therapeutic options. Curr Diabetes Rep. 2008; 8(6): 403-410.
