Keywords
Salivary cortisol, Stress, Simulation-based education, Multidisciplinary team, Emergency
Introduction
Stress is a major event occurring during management of lifethreatening emergencies [1]. Furthermore excessive stress impairs performance [2]. Stressful situations lead to the activation of endocrine, nervous and immune systems, known as stress response [3]. Acute stress induces the hypothalamic pituitary adrenal (HPA) axis activity that generates cortisol secretion. Simulation-based education is commonly used to train multidisciplinary teams (MDTs) in the management of lifethreatening situations [4-6]. Stress has been reported during simulation and assessed by various means [7-10]. HPA activity can be apprehended by the non-invasive measurement of salivary cortisol (SC) [11]. SC has been measured in a number of stress models [12] and used in simulation [13]. The underlying learning objective for using simulation-based education is that the repetition of simulations induces an increase in healthcare providers’ performance [14-16]. Therefore, because of the negative correlation described punctually between assessed stress and performance [2,17-21], one should expect a decrease in cortisol over time with a repetition of simulation sessions. However, SC, which was punctually used in simulation, has never been assessed over time after repeated immersive simulations. Our hypothesis was that SC increased after immersive simulation and decreased after debriefing, but was blunt after a repetition of simulation sessions. The aim of the study was to analyze SC level during immersive simulation and to study its evolution over time with a repetition of simulation sessions.
Methods
Study
This single-center study took place in the Laboratory of Simulation- INSERM (French national health and medical research institute) #1402, Faculty of Medicine, University of Poitiers, France. Here are reported the results of the analysis of biological stress during immersive simulations of a randomized controlled trial registered by ClinicalTrials.gov under the number NCT02424890 (a WHO-approved primary registry) and published [22]. The study protocol, information form, and consent form were approved by the Comité de Protection des Personnes III de la region Ouest. All data were kept anonymous.
Objectives
The primary objective was to evaluate SC during an immersive simulation session. Secondary objectives were to assess variation of SC level with a repetition of simulation sessions over 1 year and to compare these variations between two rhythms of sessions (every 6 weeks versus every 6 months) in all team members.
Participants
Twelve emergency multidisciplinary teams (MDTs) of 4 persons who usually constitute the French Emergency Medical Service (EMS) teams were enrolled from the Poitou-Charentes region (France). Each MDT was made up of an emergency physician (EP), a resident (PGY), a nurse (RN), and an ambulance driver (AD). All of them had to have less than 7 years of experience in order to minimize inter-individual variability of stress response which had been described to be linked with competencies [23]. Noninclusion criteria were pregnancy, any disease that could induce modifications related to stress, or worsen in relation to stress and/ or psychiatric disease modifying stress response, treatment with medication having a potential effect on stress parameters like steroids or hormone replacement therapy. Recruitment, inclusion and exclusion criteria, and randomization were detailed in the study protocol [22]. Among the 48 participants, 26 were males (54.2%) and 22 females (45.8%). The mean age (M ± SD) was 32 ± 9 years for EP, 29 ± 8 years for PGY, 42 ± 13 years for RN, and 47 ± 16 f years or AD. Paramedics had exercised in other departments (critical care units or emergency) before joining the EMS unlike medical staff. Therefore, there was an age difference for a same level of experience. Randomization assumed that demographic characteristics of participants were equally distributed in each group. Experience (M ± SD) was 4.2 ± 1.9 for EP, 4.8 ± 2.4 for RN, 5.8 ± 0.75 for AD in experimental group and 4.5 ± 2.16 for EP, 5.5 ± 1.4 for RN, 5.3 ± 1.9 for AD in control group. In both groups PGYs had less than one year of experience.
Intervention
Six MDTs constituted the experimental group to undertake 9 simulation sessions over 1 year (every 6 weeks) and 6 MDTs represented the control group planned for 3 simulation sessions over 1 year (every 6 months).
The model of stress used during the simulations was a pediatric life-threatening condition, i.e. shock in an infant requiring an intraosseous access insertion. The rationale for this choice relied on the fact that this model was considered as the most stressful, for different reasons: 1) Pediatric emergencies are less frequent than adults ones; 2) It is most of the time emergency physicians who take care of pediatric emergencies in France (except in tertiary hospitals where specific pediatric emergency departments exist) and their approach to pediatric emergencies is very often only didactic; 3) In France, medical assistance for out-of-hospital pediatric emergencies is provided by emergency physicians as leaders of emergency medical service teams.
In the present study, nine different scenarios were used: 4 with hypovolemic shocks, 2 with cardiogenic shocks, 1 hemorrhagic shock in severe trauma, 1 anaphylactic shock, and 1 septic shock. The high-fidelity simulation used a mannequin (SimNewB*, Laerdal®), and scenarios were played in a simulated crash room (with all the equipment) in the Simulation Laboratory of Poitiers. Details of content of sessions and their structure were described in the study protocol [22].
Endpoints
Sampling
All sessions were scheduled the same day of the week at 2:00pm because of the circadian cycle of cortisol. In fact, SC has a physiologic rhythm in normal individuals without HPA axis diseases [24] with a peak in the morning followed by a decrease over the day. The lowest level is reached at midnight before gradually increasing until morning [25]. After the onset of stressors, cortisol level peaks at 30-40 minutes [26]. Because of the SC concentrations variation, cortisol reactivity to stressful situations can differ according to time of the day [27,28]. So SC should be measured at similar times during the day to avoid potential confounding effects from inter- and intra-individual differences in the diurnal pattern of cortisol secretion [29]. This is the reason why, on each session, SC level was assessed at 4 different times: the day prior to the simulation between 15:00 and 16:00 (T0), before the simulation at 14:00 (T1), after the simulation at 15:00 (T2), and after the debriefing at 15:45 (T3). SC variation between the four times (T0, T1, T2, and T3) was compared during the 9 simulations of the experimental group. SC variation was also compared between experimental group and control group during the initial, intermediate and final simulation. A status effect was also tested both on SC and SC variations.
Serum cortisol determinations
SC samples were collected with a minimum of 0.5 mL of saliva after making sure that there were no oral inflammatory diseases. The participants did not eat, drink, chew gum, smoke, or brush teeth for the 30 min, and rinse mouth 5 min before sampling.
Method of enzyme-linked immunosorbent assay (ELISA) [30] with an ELISA kit (IBL international®, Hamburg, Germany) was used. Stored and frozen (at -20C) saliva samples were thawed, mixed and centrifuged 10 min at 2000-3000 × g to remove particulate material. Fifty microliters of each standard, control and sample were pipetted with 100 μL of enzyme conjugate. After 2 hours incubation at 20°C on an orbital shaker at 500 rpm, they were tested with 100 μL of TMB (3,3',5,5'-tetramethylbenzidine) substrate in a standard procedure described by IBL. The substrate reaction was stopped after 30 min incubation in the same conditions. Seven standards and two controls in ranges from 0.00- 4.00 μg/dL were used in the assay. Then, the microtitter plate was immediately read at 450 nm with checking the calibration curve [31]. All kit controls were found within the acceptable ranges as stated on the labels and the QC certificate. SC was given in μg/dL and relative variation of SC over time was calculated to adjust for SC inter-individual variability.
Statistics
All data were analyzed with Statview version 4.5 (SAS Institute Inc., Cary, NC). SC was described as mean and standard deviation (M ± SD) and relative variation (RV) between 2 times was calculated as ((final score-initial score)/initial score). Mann-Whitney test was used for comparison of SC and RV of SC between groups at two times. Kruskal-Wallis test was used for comparison of experience level, and SC between the 4 status (EP, PGY, RS, and AD) in each group and the whole population during common scenarios. RV of stress over time was analyzed using ANOVA for repeated measures, followed by a post-hoc analysis using Scheffe’s test in case of significance. A p value <0.05 was considered significant.
Results
Primary objective
SC assessment during immersive simulation demonstrated the existence of stress. SC evolution is shown on Figure 1. SC increased from 0.16 ± 0.12 at T0 to 0.26 ± 0.14 at T1, and continued to rise up to 0.39 ± 0.27 at T2 before decreasing to 0.21 ± 0.12 at T3, p<0.0001.
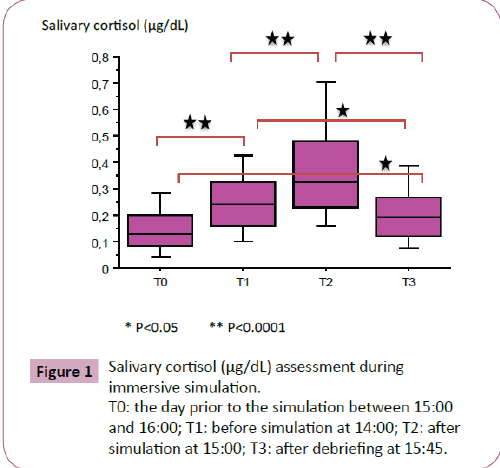
Figure 1: Salivary cortisol (μg/dL) assessment during immersive simulation.
T0: the day prior to the simulation between 15:00 and 16:00; T1: before simulation at 14:00; T2: after simulation at 15:00; T3: after debriefing at 15:45.
Secondary objectives
SC variation over time: In the experimental group (in which 9 simulation sessions were carried out), there was a significant decrease in relative variation of SC between T3 and T0 (p=0.033) (Figure 2). But there was no significant difference with an a posteriori test.
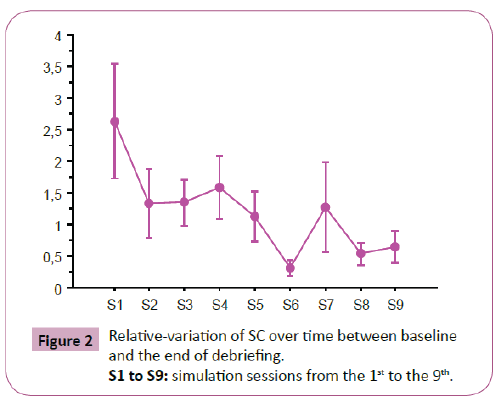
Figure 2: Relative-variation of SC over time between baseline and the end of debriefing.
S1 to S9: simulation sessions from the 1st to the 9th.
SC variation according to group allocation: There was no difference of SC level as well as its relative variation between experimental group leading 9 simulation sessions and the control group leading 3 simulation sessions during initial, 6-month (intermediate) and 12-month (final) sessions (Table 1).
| SC |
Initial session |
Intermediate session |
Final session |
| Experimental group |
Control group |
p |
Experimental group |
Control group |
p |
Experimental group |
Control group |
p |
| T0 |
0.14 (0.08) |
0.15 (0.11) |
0.51 |
0.14 (0.09) |
0.14 (0.10) |
0.92 |
0.16 (0.11) |
0.21 (0.13) |
0.21 |
| T1 |
0.27 (0.14) |
0.28 (0.14) |
0.89 |
0.23 (0.10) |
0.26 (0.10) |
0.48 |
0.26 (0.13) |
0.27 (0.13) |
0.68 |
| T2 |
0.38 (0.29) |
0.33 (0.18) |
0.97 |
0.37 (0.18) |
0.46 (0.23) |
0.13 |
0.43 (0.23) |
0.51 (0.37) |
0.86 |
| T3 |
0.26 (0.20) |
0.23 (0.10) |
0.74 |
0.20 (0.11) |
0.21 (0.10) |
0.45 |
0.21 (0.10) |
0.24 (0.14) |
0.68 |
| RV T1, T0 |
4.96 (7.88) |
1.49 (2.41) |
0.24 |
1.58 (2.69) |
2.27 (4.12) |
0.80 |
1.12 (1.62) |
0.74 (1.12) |
0.48 |
| RV T2, T0 |
6.393 (10.55) |
1.79 (1.95) |
0.34 |
3.58 (5.28) |
5.01 (7.06) |
0.36 |
2.53 (3.40) |
1.94 (2.25) |
0.62 |
| RV T3, T0 |
2.61 (4.44) |
0.95 (1.31) |
0.63 |
1.12 (0.39) |
1.69 (0.74) |
0.97 |
0.65 (0.25) |
0.45 (0.19) |
0.55 |
| RV T2, T1 |
0.43 (0.91) |
0.49 (1.13) |
0.85 |
0.61 (0.53) |
0.98 (0.95) |
0.36 |
0.68 (0.58) |
1.16 (1.32) |
0.89 |
| RV T3, T1 |
0.04 (0.89) |
0.04 (0.71) |
0.99 |
-0.12 (0.04) |
-0.20 (0.08) |
0.70 |
-0.11 (0.08) |
-0.06 (0.10) |
0.90 |
| RV T3, T2 |
-0.30 (0.17) |
-0.27 (0.19) |
0.59 |
-0.43 (0.26) |
-0.51 (0.22) |
0.35 |
-0.45 (0.24) |
-0.44 (0.26) |
0.67 |
| RV: relative variation; SC: salivary cortisol; T0: baseline; T1: pre-simulation time; T2: post-simulation time; T3: post-debriefing time. |
Table 1: Means (SDs) for SC and relative variation over time between experimental and control group
SC variation according to status of the participants: There was neither difference in SC absolute level nor in relative variation during simulation according to the status in MDTs except at T1 at the intermediate session (p=0.04); this difference was between EP and RN according to the post-hoc test (p=0.02) (Figure 3).
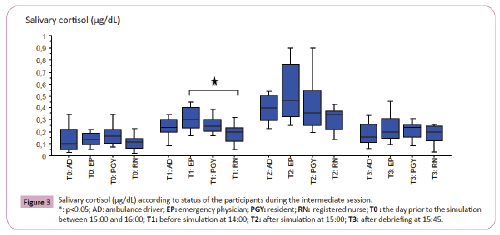
Figure 3: Salivary cortisol (μg/dL) according to status of the participants during the intermediate session. *: p<0.05; AD: ambulance driver; EP: emergency physician; PGY: resident; RN: registered nurse; T0 : the day prior to the simulation between 15:00 and 16:00; T1: before simulation at 14:00; T2: after simulation at 15:00; T3: after debriefing at 15:45.
Discussion
Main results
In an immersive simulation protocol about life-threatening situations where 12 MDTs (48 participants) animated a total of 72 simulation sessions, SC increased during the simulation scenario and decreased after the debriefing without returning to baseline. Furthermore, after the repetition of simulation sessions, this concomitant increase in SC level with simulation was not blunt. Stress response was similar regardless of the status of the members of the MDTs, except in one session.
Limitations
We are aware of the limitations of this study. The real difficulty was the respect of time-schedule for fitting with the cortisol circadian rhythm. All simulations were conducted at the same time to limit this effect. Another problem was the impact of life events on cortisol level independently of simulations. Conditions of recruitment in the study protocol included the obligation to be off working the day before the simulation and to have slept the night before. Moreover, participants should not have any exceptional, unusual or physical activity in the morning of the simulation. Gender difference impacts cortisol level [32], but randomization with similar distribution between males and females in the whole population and in each group limited this factor. Finally, there was an inter-individual heterogeneity of SC level with difficulty for results interpretation. However, this heterogeneity was limited by comparison of relative variation of SC concomitant of analysis of SC level. Because of this heterogeneity and the number of participants, status effect could only be analyzed on the common sessions.
Discussion about the primary objective
Differences in age did not interfere with stress level in adults [33] unlike experience of caregivers [34]. McGraw showed that older nurses were more likely to show a larger salivary amylase stress response than younger nurses but age did not impact SC [32]. Thus, despite the presence of an older group (IDE, AD) in the present study, analysis of biological stress was possible as well as comparisons among MDTs. SC and its relative variation increased after simulation scenario has been acted as suggested in high-fidelity simulation [7-10] and decreased after debriefing [35]. Debriefing using the good-judgment debriefing technique [36] could induce a lowering level of SC. However, SC remained higher than baseline at the end of debriefing. In a recent study, decreasing kinetics of salivary biomarkers of stress appeared different after a stressful scenario. SC remained elevated 30 min after the debriefing whereas salivary amylase (which depends on the activation of the autonomic nervous system-ANS) had already reached baseline [32]. Therefore, SC reflecting HPA axis could be associated to other stress pathways (ANS) to investigate stress pattern after debriefing.
Discussion about secondary objectives
Surprisingly SC remained high after each simulation and stable over time regardless of the frequency of sessions. On the one hand there is a well-known relationship between stress and performance, and excessive stress impairs performance [2,20,32,37,38]. On the other hand, systematic MDTs training improves performance [39], patients’ safety [40], and MDT’s management of life-threatening emergencies [41,42]. Our hypothesis was that stress response declined over time with the repetition of sessions. Results showed there was no variation of SC over time regardless of the frequency of simulation sessions. Consequently, these findings suggest that stress response is multifactorial and depends on multiple pathways. Stress response can be explored with multiple components [43], according to the physiological axes of stress. In other words, HPA axis (leading to the increase in cortisol) seems to be a physiological response to simulated life-threatening events, whereas management of events might depend on the other axes (ANS, and immune systems) [44] or psychological stress [19,45]. Therefore, it could be of interest to consider stress markers of HPA, ANS, and psychological stress pathways not as competitive markers (and choose between them as equivalent markers), but as complementary ones. Their association could provide a comprehensive assessment of a complex response to an event where change in actions, behaviors, and communication take place within a MDT in a short period of time, for the optimal management of the simulated patient.
Moreover, a trend in decrease over time (p<0.05 for ANOVA, but not with an a posteriori test of Scheffe used because of a large SD) could also signify that the repetition of simulation sessions did have an impact on SC level, but not sufficiently to be detected. However, in the present study there was no difference between experimental and control group. Therefore, it would be interesting to repeat the experiment with simulation sessions more frequently in the experimental group, and with an assessment of other stress markers.
In our study, all participants-regardless of their status-expressed the same stress response except at the pre-simulation time during the intermediate session. There was no difference between the leader (EP) and team members. Similar stress response in MDT’s members was previously reported [29,46]. Events may affect differently team members but impact all the team depending on the interaction between themselves [29]. Therefore, stress response should be apprehended in all members without focusing on the team leader. An evaluation of the leadership and communication within the team would be an interesting element to fully interpret SC variations among MDT’s members.
Finally, we showed that the use of SC as sole stress marker, could only reveal a suspected elevation during the simulation scenario. It never returned to baseline after debriefing. After the repetition of simulations, there was no time effect, no group effect, and no status effect. For further investigations on stress during simulation sessions, we suggest to use an association of markers exploring the different axes of stress-HPA, ANS, and psychological to fully comprehend the impact of stress on the medical emergency MDT’s management.
Conclusion
In an immersive simulation study including 72 MDTs simulation sessions, SC increased during a high-fidelity simulation of life threatening events and decreased after the debriefing without returning to the baseline level. Contrary to our hypothesis, this SC variation was not blunt after the repetition of simulation sessions. No status effect was found among the MDTs’ members. It might represent an adaptive team management of high-stakes situations. These results are highly important, showing that SC alone cannot reflect a complete approach of a stressful event. Future studies should investigate on the other axes of stress response (ANS and psychological), and correlate stress markers to team performance.
Author’s Contributions
AG: Has made substantial contributions to conception and design; performed analysis of salivary cortisol, acquisition of data, analysis and interpretation of data, and was involved in drafting the manuscript or revising it critically for important intellectual content.
SR: Has made substantial contributions to conception and design; performed analysis of data, and was involved in drafting the manuscript or revising it critically for important intellectual content.
DO: Has made substantial contributions to conception and design; will perform analysis and interpretation of data, and will be involved in drafting the manuscript or revising it critically for important intellectual content.
All the authors have given final approval of the version to be published, and agree to be accountable for all aspects of the work by ensuring that questions related to the accuracy or integrity of any part of the work were appropriately investigated and resolved.
Acknowledgement
The authors would like to thank the Société Française de Médecine d’Urgence (French Emergency Medicine Society) for the research grant.
We would like to thank Dr. Christine Millet, who provided significant help in analyzing SC.
We would like to thank Jeffrey Arsham, an American medical translator, for having reviewed the English language text.
9152
References
- LeBlanc VR (2009) The effects of acute stress on performance: implications for health professions education. Acad Med 84: S25-33.
- Harvey A, Bandiera G, Nathens AB, LeBlanc VR (2012) Impact of stress on resident performance in simulated trauma scenarios. J Trauma Acute Care Surg 72: 497-503.
- Carrasco GA, Van de Kar LD (2003) Neuroendocrine pharmacology of stress. Eur J Pharmacol 463: 235-272.
- Prince CR, Hines EJ, Chyou PH, Heegeman DJ (2014) Finding the key to a better code: code team restructure to improve performance and outcomes. Clin Med Res 12: 47-57.
- Scaramuzzo LA, Wong Y, Voitle KL, Gordils-Perez J (2014) Cardiopulmonary arrest in the outpatient setting: enhancing patient safety through rapid response algorithms and simulation teaching. Clin J Oncol Nurs 18: 61-64.
- Murphy M, Curtis K, McCloughen A (2016) What is the impact of multi disciplinary team simulation training on team performance and efficiency of patient care? An integrative review. Australas Emerg Nurs J 19: 44-53.
- Arora S, Sevdalis N, Aggarwal R, Sirimanna P, Darzi A, et al. (2010) Stress impairs psychomotor performance in novice laparoscopic surgeons. Surg Endosc 24: 2588-2593.
- Bong CL, Lightdale JR, Fredette ME, Weinstock P (2010) Effects of simulation versus traditional tutorial-based training on physiological stress levels among clinicians: a pilot study. Sim Healthcare 5: 272-278.
- Keitel A, Ringleb M, Schwartges I, Weik U, Picker O, et al. (2011) Endocrine and psychological stress responses in a simulated emergency situation. Psychoneuroendocrinology 36: 98-108.
- Müller MP, Hänsel M, Fichtner A, Hardt F, Weber S, et al. (2009) Excellence in performance and stress reduction during two different full scale simulator training courses: a pilot study. Resuscitation 80: 919-924.
- Dorn LD, Lucke JF, Loucks TL, Berga SL (2007) Salivary cortisol reflects serum cortisol: analysis of circadian profiles. Ann Clin Biochem 44: 281-284.
- Wagner J, Cik M, Marth E, Santner BI, Gallasch E, et al. (2010) Feasibility of testing three salivary stress biomarkers in relation to naturalistic traffic noise exposure. Int J Hyg Environ Health 213: 153-155.
- Arora S, Tierney T, Sevdalis N, Aggarwal R, Nestel D, et al. (2010) The Imperial Stress Assessment Tool (ISAT): a feasible, reliable and valid approach to measuring stress in the operating room. World J Surg 34: 1756-1763.
- Christenson J, Nafziger S, Compton S, Vijayaraghavan K, Slater B, et al. (2007) The effect of time on CPR and automated external defibrillator skills in the Public Access Defibrillation Trial. Resuscitation 74: 52-62.
- Cordero L, Hart BJ, Hardin R, Mahan JD, Nankervis CA (2013) Deliberate practice improves pediatric residents’ skills and team behaviors during simulated neonatal resus citation. Clin Pediatr (Phila) 52(8):747-752.
- Picard M, Curry N, Collins H, Soma L, Hill J (2015) Comparison of high-fidelity simulation versus didactic instruction as a reinforcement intervention in a comprehensive curriculum for radiology trainees in learning contrast reaction management: does it matter how werefresh? Acad Radiol 22(10): 1268-1276.
- Arora S, Sevdalis N, Nestel D, Woloshynowych M, Darzi A, et al. (2010) The impact of stress on surgical performance: a systematic review of the literature. Surgery 147: 318-330, 330.
- Smith WD, Chung YH, Berguer R (2000) A virtual instrument ergonomics workstation for measuring the mental work load of performingvideo-endoscopic surgery. Stud Health Technol Inform 70: 309-315.
- Andreatta PB, Hillard M, Krain LP (2010) The impact of stress factors in simulation-based laparoscopic training. Surgery 147: 631-639.
- Wetzel CM, Black SA, Hanna GB, Athanasiou T, Kneebone RL, et al. (2010) The effects of stress and coping on surgical performance during simulations. Ann Surg 251: 171-176.
- Poolton JM, Wilson MR, Malhotra N, Ngo K, Masters RS (2011) A comparison of evaluation, time pressure, and multitasking as stressors of psychomotoroperative performance. Surgery 149: 776-782.
- Ghazali DA, Ragot S, Breque C, Guechi Y, Boureau-Voultoury A (2016) Randomized controlled trial of multidisciplinary team stress and performance in immersive simulation for management of infant in shock: studyprotocol. Scand J Trauma Resusc Emerg Med 25;24(1): 36.
- Aiken LH, Clarke SP, Sloane DM (2002) Hospital staffing, organization, and quality of care: cross-national findings. Int J Qual Health Care 14: 5-13.
- Chan S, Debono M (2010) Replication of cortisol circadianrhythm: new advances in hydrocortisone replacement therapy. Ther Adv Endocrinol Metab 1: 129-138.
- Debono M, Ghobadi C, Rostami-Hodjegan A, Huatan H, Campbell MJ, et al. (2009) Modified-release hydrocortisone to provide circadian cortisol profiles. J Clin Endocrinol Metab 94: 1548-1554.
- Dickerson SS, Kemeny ME (2004) Acute stressors and cortisol responses: a theoretical integration and synthesis of laboratory research. Psychol Bull 130: 355-391.
- Kudielka BM, Schommer NC, Hellhammer DH, Kirschbaum C (2004) Acute HPA axis responses, heart rate, and mood changes to psychosocial stress (TSST) in humans at different times of day. Psychoneuroendocrinology 29: 983-992.
- Maheu FS, Collicutt P, Kornik R, Moszkowski R, Lupien SJ (2005) The perfect time to bestressed: A differential modulation of human memory by stress applied in the morning or in the afternoon. Prog Neuropsychopharmacol Biol Psychiatry 29: 1281-1288.
- Bong CL, Fraser K, Oriot D (2016) Cognitive Load and Stress in Simulation. In: Cheng, A., Grant, V., editors. Comprehensive Healthcare Simulation: Pediatric Edition. New York City: Springer (in press).
- Lequin RM1 (2005) Enzyme immunoassay (EIA)/enzyme-linked immunosorbent assay (ELISA). Clin Chem 51: 2415-2418.
- Siekmann L, Breuer H (1982) Determination of cortisol in human plasma by isotope dilution-mass spectrometry. Definitive methods in clinicalchemistry, I. J Clin Chem Clin Biochem 20: 883-892.
- McGraw LK, Out D, Hammermeister JJ, Ohlson CJ, Pickering MA, et al. (2013) Nature, correlates, and consequences of stress-related biological reactivity and regulation in Army nurses during combat casualty simulation. Psychoneuroendocrinology 38: 135-44.
- Ordaz S, Luna B (2012) Sex differences in physiological reactivity to acute psychosocial stress in adolescence. Psychoneuroendocrinology 37: 1135-1157.
- Ghazali DA, Faure JP, Breque C, Oriot D (2016) Evaluation of stress patterns during simulated laparoscopy in residency. MinervaChir.
- Hunziker S, Semmer NK, Tschan F, Schuetz P, Mueller B, et al. (2012) Dynamics and association of different acute stress markers with performance during a simulated resus citation. Resus citation 83: 572-578.
- Rudolph JW, Simon R, Raemer DB, Eppich WJ (2008) Debriefing as formative assessment: closing performance gaps in medicaleducation. Acad Emerg Med 15: 1010-1016.
- Cavanagh JF, Frank MJ, Allen JJ (2011) Social stress reactivity alters reward and punishment learning. Soc Cogn Affect Neurosci 6311-320.
- Sexton JB, Thomas EJ, Helmreich RL (2000) Error, stress, and team work in medicine and aviation: cross sectional surveys. BMJ 320: 745-749.
- Sevdalis N (2013) Non-technical skills and the future of teamwork in healthcare settings. The Health Foundation. https://patientsafety.health.org.uk/sites/default/files/resources/non_technical_skills_and_the_future_of_ teamwork_in_healthcare_settings.pdf. Accessed 18 Mar 2016.
- Morey JC, Simon R, Jay DG, Wears RL, Salisbury M, et al. (2002) Error reduction and performance improvement in the emergency department through formal team work training: evaluation results of the Med Teams project. Health Serv Res 37: 1553-1581.
- Blum RH, Raemer DB, Carroll JS, Sunder N, Felstein DM, et al. (2004) Crisis resource management training for an anaesthesia faculty: a new approach to continuing education. Med Educ 38: 45-55.
- Birnbach DJ, Salas E (2008) Can medical simulation and team training reduceerrors in labor and delivery? Anesthesiol Clin 26: 159-168, viii.
- Laurent HK, Powers SI, Granger DA (2013) Refining the multisystem view of the stress response: Coordination among cortisol, alpha-amylase, and subjective stress in response to relationship conflict. Physiol Behav 119: 52-60.
- Clarke S, Horeczko T, Cotton D, Bair A (2014) Heart rate, anxiety and performance of residents during as imulated critical clinical encounter: a pilot study. BMC Med Educ 14: 153.
- Hulsman RL, Pranger S, Koot S, Fabriek M, Karemaker JM, et al. (2010) How stressful is doctor–patient communication? Physiological and psychological stress of medical students in simulated history taking and bad-news consultations. Int J Psychophys 77: 26-34.
- Girzadas DV Jr, Delis S, Bose S, Hall J, Rzechula K, et al. (2009) Measures of stress and learning seem to be equally affected among all roles in a simulation scenario. Simul Healthc 4: 149-154.


