Keywords
Vincristine, Vinblastine, Simultaneous estimation, HPTLC
Introduction
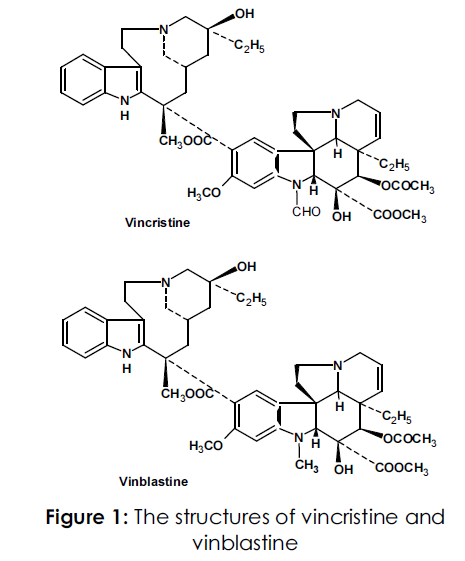
Catharanthus roseus or Vinca rosea belongs to family; Apocyanaceae which is a perennial, evergreen herb. It was native to the Island of Madagascar, and is now growing wildly in most warm regions of the world especially in Egypt [1,2]. C. roseus plant produces many pharmaceutically important alkaloids of which the bisindole alkaloids, vinblastine and vincristine (Figure 1) have antineoplastic properties. In addition, the plant also contains monoindole alkaloids including ajmalicine and serpentine which are antihypertensive in nature [3-9]. Vinblastine sulphate is used commercially for the treatment of neoplasma and is recommended for generalized Hodgkin's disease and resistant choiocarcenoma. The plant has been early used in treatment of diabetes, hypertension, tuberculosis, laryngitis, sore throat, dyspepsia, malaria, and to regulate menstruation [10, 11].Vinblastine and vincristine and vindesine and vinorelbine, semi synthetic derivatives of vinblastine, all work by inhibiting mitosis (cell division) in metaphase [12-15] .These alkaloids bind to tubulin, thus preventing the cell from making the spindles it needs to be able to move its chromosomes around as it divides (this is similar to the action of colchicine, but is different from the action of paclitaxel, which interferes with cell division by keeping the spindles from being broken down). These alkaloids also seem to interfere with cells' ability to synthesize DNA and RNA. The methods so far reported for the analysis of Vincristine and Vinblastine include their estimation using nonaqueous capillary electrophoresis [16], HPLC [17], HPLC/EIMS [18] showed low resolution owing to poor reproducibility. Others have been working on the isolation, purification and evaluation of antineoplastic alkaloids using chromatographic techniques. In this regard, Khaled et al.,[19] have developed several chromatographic techniques, viz charcoal column, VLC, HPLC, HPTLC and centrifugally accelerated radial chromatography (Chromatotrone). Paci et al., [20] further identified and quantified vinca alkaloids viz., vincristine and vinorelbine, vinblastine and vindesine using HPTLC in two different runs. All these procedures used earlier for the estimation of vincristine and vinblastine are lengthy and providing very less concentration of vincristine and vinblastine. With this back ground, we herein report a novel simple, specific and sensitive HPTLC method for the simultaneous quantification of vincristine and viblastine in the leaves of Catharanthus roseus. This method has been validated as per ICH guidelines [21].

Figure 1: The structures of vincristine and vinblastine
Experimental
Chemicals and Reagents
Standard vincristine and vinblastine were procured from Vinkem Labs Limited, Chennai, India. Dried samples of leaves of Catharanthus roseus (Family Apocyanaceae) were procured from a Delhi market, which were further authenticated by a Pharmacognosist and voucher specimens deposited in depository of Bioactive Natural Product laboratory, Department of Pharmacognosy, Jamia Hamdard. All other chemicals used were of analytical reagent grade.
Chromatographic conditions
Sample solutions were applied onto the plates with semiautomatic TLC sampler Linomat V (Camag, Muttenz, Switzerland) and were controlled by WinCATS software 1.4.4. Plates were developed in 20 x 10cm twin trough glass chamber (Camag, Muttenz, Switzerland). A TLC scanner III was used for scanning the TLC plates. Pre-coated silica gel aluminium plates 60F254 (E. Merck, Darmstadt, Germany) with thickness 0.2mm thickness were used for all determinations. The plates were pre-washed with methanol and activated at 60°C for 5minutes prior to chromatography. Six different aliquots (0.1, 0.2, 0.4, 0.8, 1.6, 3.2, 4.0 μL) of standard solution were applied on 20 x 10 cm TLC plates for the preparation of calibration curve. A constant application rate of 150 nL/s was employed with a bandwidth of 7mm.The slit dimension was kept at 6.0 x 0.45 mm and scanning speed of 20 mm/s was employed. Twenty mL of mobile phase consisted of toluene-methanol-diethylamine (8.75: 0.75: 0. 5 v/v/v) was used per plate. The optimized chamber saturation time for mobile phase was 15 min at room temperature (25 ± 2°C) at relative humidity of 60 % ± 5 RH. The plates were developed and scanned within 10 min using desitometric scanner III in the remission mode at 307nm for vincristine and 225nm for vinblastine respectively. The source of radiation was deuterium lamp emitting a continuous radiation between 200-400 nm. Evaluation was done by measuring peak areas with linear regression.
Preparation of Standard Solutions
Standard solutions of vincristine and vinblastine were prepared by dissolving 10mg each of vincristine and vinblastine in 10ml.of methanol (1000 μg/ml). This stock solution was used to make calibration curves of vincristine and vinblastine.
Preparation of Sample Solutions
Weighed 50gm of Catharanthus roseus leaves and boiled it for 2 hrs. on an electric water bath. Powder the leaves and then mixed it sufficient quantity of alcoholic KOH and dried the powder in oven at 100°C. An accurately weighed quantity (2 g) of leaves were sonicated for 20 minutes in 4ml. of methanol separately. The solutions were filtered and collected in vials. Extracted the drug with 150ml. methanol in soxhlet apparatus for 6 hrs. Methanol extract was separated and shaken with successive three portions of 5ml.dilute sulphuric acid. Combined the acid extract and then filtered. Added excess of ammonia to the acid extract to precipitate the alkaloids. Filtered and dried precipitate was weighed. The precipitate was then dissolved in methanol (200mg/ml).
Linearity
Six point calibration curve was constructed by plotting peak area against concentrations. Linearity was evaluated by applying each concentration (100, 200, 400, 1600, 3200, 4000 ng/spot) of vincristine and vinblastine in triplicates per sample and six such samples were evaluated (n = 3 × 6).
Method Validation
Precision
The precision of a method is the extent to which the individual test results of multiple injections of a series of standards agree. Repeatability was determined by six replicate applications and six times measurement of a standard solution at the analytical concentration of 400, 1600 and 3200 ng/spot of vincristine and vinblastine. The repeatability of sample application and measurement of peak area for active compound were expressed in terms of relative standard deviation (% RSD). Precision was obtained from % RSD value by repeating the assay six times on the same day for intra-day precision. Intermediate precision was assessed by the assay of three, six sample sets on different days (inter-day precision) and on different systems (inter-system precision). The intra-day, inter-day and inter-system variations for determination of vincristine and vinblastine were carried out at three different concentration levels 400, 1600 and 3200 ng/spot.
Robustness of the method
By introducing small changes in the mobile phase composition, the effects on the results were examined. Mobile phases having different compositions like toluene-methanol-diethylamine (8.75: 0.75: 0.5 v/v/v) were tried and chromatograms were run. The amount of mobile phase was varied in the range of ±5%. The plates were pre-washed by methanol and activated at 60 ± 5 for 5, 10, 12 min prior to chromatography. Robustness of the method was done at three different concentration levels 400, 1600 and 3200 ng/spot. Amount of mobile phase was varied and plates were developed in 8, 10 and 12 ml mobile phase. Time from spotting to chromatography and chromatography to scanning were also varied and RSD were determined and found to be less than 2 %.
Limit of Detection and Limit of Quantification
In order to estimate the limit of detection (LOD) and limit of quantitation (LOQ), blank solution (methanol) was spotted six times following the same method as explained above. The signal to noise ratio was determined. LOD was considered as 3:1 and LOQ as 10:1. LOD and LOQ were experimentally verified by diluting known concentrations of reference solution until the average responses were approximately three or ten times the standard deviation of the responses for six replicate determinations.
Specificity
The specificity of the method was ascertained by analyzing standard drug and sample.
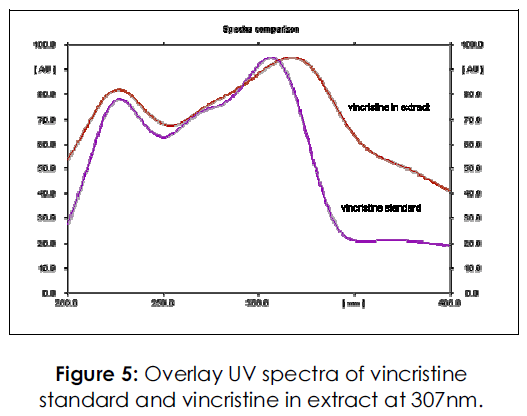
The spots for vincristine and vinblastine in sample were confirmed by comparing Rf and spectra of spot with that of standard. The peak purity (90%) of vincristine and vinblastine was assessed by comparing the spectra at three different levels i.e. peak start, peak apex and peak end positions of the spot. Purity of sample spot corresponding to vincristine and vinblastine was determined by taking the spectra and by comparing it with that of standard. (Figures 5-6)

Figure 2: HPTLC chromatogram of vincristine standard (4.0 μg /spot) at 307 nm.

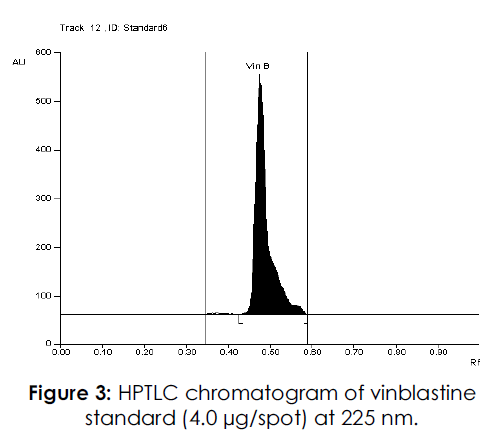
Figure 3: HPTLC chromatogram of vinblastine standard (4.0 μg/spot) at 225 nm.

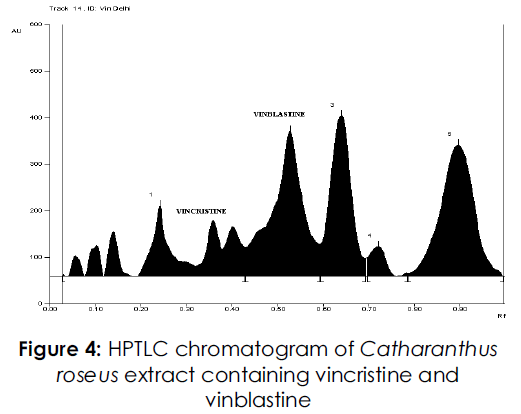
Figure 4: HPTLC chromatogram of Catharanthus roseus extract containing vincristine and vinblastine

Figure 5: Overlay UV spectra of vincristine standard and vincristine in extract at 307nm.

Figure 6: Overlay UV spectra of vinblastine standard and vinblastine in extract at 225 nm.
Recovery Studies (Accuracy)
The pre-analyzed samples were spiked with 50, 100 and 150% of the standard solution and the mixtures were re-analyzed by the proposed method. The experiment was conducted six times. This was done to check the recovery of the drug at different levels in the formulations. Recovery study was carried out for the powder sample of Vinca rosea powder from a Delhi market.
Result and Discussion
Optimization of Solvent System
For the development of mobile phase, different trials were made using many solvents in different proportions. When mobile phase consisting of toluene-methanol was used in the ratio of 8:2v/v two spots were observed at the Rf of 0.39 and 0.49 for vincristine and vinblastine respectively. But it was found that the resolution between the peaks was poor. In order to improve the resolution between the peaks a new mobile phase with the composition of toluene-methanol-diethylamine was used in the ratio of 8.75: 0.75: 0.5 v/v/v. This new mobile phase helped in achieving very compact spots at the Rf of 0.39 and 0.49 (Figures 2-4) for vincristine and vinblastine respectively with good resolution of more than one.
Linearity
Linearity was found between concentration ranges of 100 to 4000 ng/spot for vincristine and 200 to 4000 ng/spot for vinblastine with r2 value of 0.995 and 0.994 respectively. (Table1). These values of correlation coefficients indicated a high degree of linearity.
| Validation Parameters |
Results of Vincristine |
Results of Vinblastine |
| Linearity range (ng spot-1) |
100-4000 |
200-4000 |
| Correlation coefficient (r2 ± SD) |
0.995 ± 0.001 |
0.994 ± 0.001 |
| Regression equation |
Y=409.731+2.347*X |
Y=1032.275+2.641*X |
| Limit of detection (ng spot-1) |
30.5 |
62.3 |
| Limit of quantification (ng spot-1) |
92.6 |
188.9 |
Table 1: Validation parameters of the proposed HPTLC method for estimation of Vincristine and Vinblastine
Method Validation
Precision
Precision data on the intra-day, inter-day and inter-system variation for three different concentration levels are summarized in Table 2. The low % RSD indicated the method is precise for the analysis.
| Conc. (ng spot- 1) |
Inter-day precision |
Intra-day precision |
Inter-system precision |
| Mean peak area ± SD (n = 6 ) |
%RSD |
Mean peak area ± SD (n = 6 ) |
%RSD |
Mean peak area ± SD (n = 6) |
%RSD |
| 400 |
2538.3±19.6 |
0.77 |
3461.5±56.7 |
1.64 |
3015.5±53.7 |
1.78 |
| 1600 |
7743.8±88.2 |
1.13 |
9439.9±96.7 |
1.02 |
9317.8±99.1 |
1.06 |
| 3200 |
10465±112.4 |
1.07 |
13717.6±184.5 |
1.34 |
13129.9s±147.9 |
1.12 |
a) Vincristine
| Conc. (ng spot- 1) |
Inter-day precision |
Intra-day precision |
Inter-system precision |
| Mean peak area ± SD (n = 6 ) |
%RSD |
Mean peak area ± SD (n = 6 ) |
%RSD |
Mean peak area ± SD (n = 6) |
%RSD |
| 400 |
2538.3±19.6 |
0.77 |
3461.5±56.7 |
1.64 |
3015.5±53.7 |
1.78 |
| 1600 |
7743.8±88.2 |
1.13 |
9439.9±96.7 |
1.02 |
9317.8±99.1 |
1.06 |
| 3200 |
10465±112.4 |
1.07 |
13717.6±184.5 |
1.34 |
13129.9s±147.9 |
1.12 |
b) Vinblastine
| Conc. (ng-1 spot ) |
Inter-day precision |
Intra-day precision |
Inter-system precision |
| Mean peak area ± SD (n = 6 ) |
%RSD |
Mean peak area ± SD (n = 6 ) |
%RSD |
Mean peak area ± SD (n = 6) |
%RSD |
| 400 |
2550.7±50.5 |
1.97 |
3940.9±73.21 |
1.85 |
3928.3±77.6 |
1.97 |
| 1600 |
4942.4±63.0 |
1.27 |
10432.3±219.7 |
2.10 |
10374.2±221.9 |
2.13 |
| 3200 |
7745.9±96.3 |
1.24 |
14409.7±281.3 |
1.95 |
14567.3±258.2 |
1.77 |
Table 2: Intermediate precision data of proposed HPTLC method of a) Vincristine and b) Vinblastine
Robustness of the method
The effect of deliberate changes in the composition of mobile phase were studied as % RSD and depicted in the Table 3. Low % RSD indicates the method is robust.
a) Vincristine
| Mobile phase change (Toluene: Methanol: Diethylamine) |
Mean area ± SD (n = 3) |
% RSD of area |
| Actual (v/v/v) |
Used (v/v/v) |
Level |
| 8.75:0.75:0.50 |
8.73:0.77:0.5 |
-2 |
1983.5±16.90 |
0.85 |
| 8.75:0.75:0.5 |
0 |
1852.1±28.57 |
1.54 |
| 8.77:0.73:0.5 |
+2 |
1981.5±17.33 |
0.87 |
| Wavelength change |
|
|
| Actual (nm) |
Used (nm) |
Level |
|
|
| 307 |
305 |
-2 |
2527.9±23.13 |
0.99 |
| 307 |
0 |
2644.3±30.72 |
1.16 |
| 309 |
+2 |
2538.5±43.31 |
1.70 |
RSD, relative standard deviation
b) Vinblastine
| Mobile phase change (Toluene: Methanol: Diethylamine) |
Mean area ± SD (n = 3) |
% RSD of area |
| Actual (v/v/v) |
Used (v/v/v) |
Level |
| 8.75:0.75:0.50 |
8.73:0.77:0.5 |
-2 |
2386.7±32.52 |
1.4 |
| 8.75:0.75:0.5 |
0 |
2373±42.46 |
1.8 |
| 8.77:0.73:0.5 |
+2 |
2376.7±47.09 |
2.0 |
| Wavelength change |
|
|
| Actual (nm) |
Used (nm) |
Level |
| 225 |
223 |
-2 |
2906.5±31.07 |
1.06 |
| 225 |
0 |
2802.1±57.25 |
2.04 |
| 227 |
+2 |
2707.4±30.47 |
1.12 |
RSD, relative standard deviation
Table 3: Robustness data of proposed HPTLC method of a) Vincristine and b) Vinblastine
Limit of Detection and Limit of Quantitation
For the proposed method LOD and LOQ were calculated using signal to noise ratio method and found to be 30.5, 92.6 ng spot-1 for vincristine and 62.3, 188.9 ng spot-1 for vinblastine, respectively (Table 1).
Specificity
The specificity of the newly proposed method was ascertained by superimposing the spectrum of both standard and sample and confirmed for its purity.
Recovery studies (Accuracy)
The accuracy studies were done for the method as recovery studies and the amount of the drug recovered was calculated on the basis of assay. The results of the recovery study were depicted in Table 4.
a) Vincristine
| % of standard spiked to the sample |
Theoretical content (μg/spot) |
Amount of drug recovered (μg ±SD) (n = 6) |
% of drug recovered |
% RSD |
| 0 |
11.98 |
11.82±0.16 |
98.66 |
1.39 |
| 50 |
17.97 |
17.99±0.20 |
100.11 |
1.15 |
| 100 |
23.96 |
24.37±0.45 |
101.71 |
1.87 |
| 150 |
29.95 |
30.06±0.28 |
100.36 |
0.96 |
RSD, relative standard deviation
b) Vinblastine
| % of standard spiked to the sample |
Theoretical content (μg/spot) |
Amount of drug recovered (μg ±SD) (n = 6) |
% of drug recovered |
% RSD |
| 0 |
38.15 |
38.46±0.65 |
100.65 |
1.69 |
| 50 |
57.22 |
56.94±0.27 |
99.44 |
0.48 |
| 100 |
76.30 |
76.20±0.27 |
99.86 |
0.35 |
| 150 |
95.37 |
95.41±0.41 |
100.04 |
0.43 |
RSD, relative standard deviation
Table 4: Accuracy as recovery data of proposed HPTLC method of a) Vincristine b) Vinblastine.
Analysis of samples
For the analysis samples were spotted in triplicate on TLC plate, vincristine has Rf of 0.39 and vinblastine has Rf of 0.49 respectively. It was found that no interference is there in samples with immediate impurities and resolution between the peaks found good.
Conclusion
HPTLC method was developed and validated for the simultaneous determination of vincristine and vinblastine and the content of these markers present in catharanthus roseus plant was quantified and found to be 0.011 % w/w for vincristine and 0.038 % w/w for vinblastine, respectively. The method was found to be simple, rapid, accurate, specific and robust for the analysis of vincristine and vinblastine in crude drug and can be adopted by any laboratory for the quality control of crude drugs and formulations that contains vincristine and vinblastine as active markers.
7290
References
- Dobelis IN. Magic and Medicine of Plants. Reader's Digest Books ed. New York, Pleasantville, 1989.
- Heywood VH, editor. Flowering Plants of the World. Oxford University Press, New York, 1993.
- Zhao J, Verpoorte R. Manipulating indole alkaloid production by Catharanthus roseus cell cultures in bioreactors: from biochemical processing to metabolic engineering. Photochem. Rev. 2007; 6: 435–457.
- Atta-ur-Rahman, Bashir M, Kaleem S and Fatima T. 16-epi-19-S-vindolinine - An indoline alkaloid from C. roseus. Phytochem. 1983; 22: 1021.
- Atta-ur-Rahman, Ali I, Bashir M. Isolation of rhazimol from the leaves of C. roseus. J Nat. Prod. 1984; 47: 389.
- Atta-ur-Rahman, Ali I and Choudhary MI. Isolation and 13C-NMR studies on cathovaline - An alkaloid from leaves of C. roseus. Plant. Med. 1985; 5: 447–448.
- Atta-ur-Rahman, Alam M, Ali I, Habib-ur-Rahman, and Haq I. Leurosinone - A new binary indole alkaloid from C. roseus. J. Chem. Soc., Perkin- Trans. I. 1988; 8: 2175–2178.
- Atta-ur-Rahman, Fatima J and Albert K. Isolation and structure of rosicine from C. roseus. Tetrahedron letters. 1984; 25: 52. 6051–6054.
- Auriola S, Naaranlahti T, Kostianen R, Lapinjaki SP. Identification of indol alkaloids of C. roseus with liquid chromatography/mass spectrometry using collision-induced dissociation with the thermo spray ion repeller. Biomed. Environ. Mass spectrom. 1990; 19: 400–404.
- Moreno P, Van der Heijden, Verpoorte R. Effect of terpenoid precursor feeding and elicitation on formation of indole alkaloids in cell suspension cultures of C. roseus. Plant Cell Rep. 1993; 12: 702–705.
- Soo-Young Lee 1, Choi1 Pil-Son, Chung1 Hwa- Jee, In1 Dong-Soo, Choi1 Dong-Woog, Liu1 Jang R. Comparison of adventitious shoot formation in petiole explant cultures of 20 cultivars of C. roseus. J Plant. Biotech. 2003; 5: 59–61.
- Budavari, Susan. The Merck Index: An Encyclopedia of Chemicals, Drugs and Biologicals, Rahway, New Jersey, Merck & Co, 1989.
- Goodman, Louis Sanford, Alfred Gilman, and Alfred Goodman Gilman. The Pharmacological Basis of Therapeutics, 8th Edition. Elmsford, New York, Pergamon Press, 1990, pp 1098-1116.
- Mutschler, Ernst, Hartmut Derendorf. Drug Actions: Basic Principles and Therapeutic Aspects. Stuttgart, Germany, Medpharm Scientific Publishers, 1994.
- Physician's Desk Reference ©. Montvale, Medical Economics Data Production Company, New Jersey, 1995 pp 2247-2248.
- Barthe L, Ribet JP, Pélissou M, Degude MJ, Fahy J, Duflos A. Optimization of the separation of Vinca alkaloids by nonaqueous capillary electrophoresis. J Chromatogr. A. 2002; 968: 241- 250.
- Gupta MM, Singh DV, Tripathi AK, Pandey R, Verma RK, Singh S, Shasany AK, Khanuja SP. Simultaneous determination of vincristine, vinblastine, catharanthine, and vindoline in leaves of catharanthus roseus by high- performance liquid chromatography. J Chromatogr Sci. 2005; 43: 450-453.
- Chua IH, Bodnarb JA, Bowmanc RN, Whiteb EL. Determination of Vincristine and Vinblastine in Catharanthus roseus Plants by High Performance Liquid Chromatography/ Electrospray Ionization Mass Spectrometry. J. Liq. Chrom. & Rel. Tech. 1997; 20: 1159 – 1174.
- Khaled A Shams, Naglaa M Nazif, Nahla S Abdel Azim, Khaled A Abdel Shafeek, Mostafa M El- Missiry, Shams I Ismail, and Medhat M Seif El Nasr. Isolation and Characterization of Antineoplastic Alkaloids from Catharanthus Roseus L. Don. Cultivated in Egypt. Afr. J. Tradit. Complement. Altern. Med.2009; 6: 118–122.
- Paci A, Mercier L, Bourget P. Identification and quantitation of antineoplastic compounds in chemotherapeutic infusion bags by use of HPTLC: application to the vinca-alkaloids. J Pharm. Biomed. Anal. 2003; 30: 1603-1610.
- ICH Harmonized Tripartite Guideline, Validation of analytical procedures: text and methodology Q2A (R1), International conference on harmonization, Geneva, 2005.


