G.B. Ramos1*, R. Corcino1, H. Rivera1, N. Alfonso1, G. Sia Su2 and R. Arcilla3
1Biology Department, De La Salle University, Taft Avenue, Manila 1004, Philippines
2Department of Biology, University of the Philippines, Padre Faura St., Manila 1000, Philippines
3Mathematics Department, De La Salle University, Taft Avenue, Manila 1004, Philippines
Corresponding Author:
G.B. Ramos
Biology Department, De La Salle University
Taft Avenue, Manila 1004, Philippines
Tel: +63 2 536-0228
Mob: +63 2 998 5416885
E-mail: gliceria.ramos@dlsu.edu.ph
Received Date: 02.10.2015; Accepted Date: 01.04.2016; Published Date: 07.04.2016
Keywords
Anabas testudineus; Breeding; Absolute fecundity (AF); Gonadosomatic index (GSI); Oocyte maturation; Puntius tumba; spawning
Introduction
The two commercially important fish species Puntius tumba and Anabas testudineus constitute a significant component of the fisheries and food industry throughout Lanao del Sur, Mindanao Island, Philippines. However, P. tumba and A. testudineus are continuously being threatened with the economic and infrastructure developments, the growing population of local people living along the periphery of the lake, and the expanding practice of aquaculture farming of non-native species. A study (Ismail et al., 2014) has indicated that a diminishing fish catch particularly that of Puntius species, has been experienced by the local fishers, as it only constitutes a 0.04% of the total harvested weight of fish catch obtained from the lake. The dwindling abundance of these two fish species brings about a heightened concern, especially that these are limited only to Lake Lanao.
In the Philippines, there are limited studies conducted on these two fish species. An early study (Herre, 1924) conducted in Lake Lanao has indicated only the biological characteristic of P. tumba and none of A. testudineus. Considering the dwindling abundance of these fish species and the paucity of information pertaining to their reproductive biological aspects has led the researchers to go about this study. The information on the reproductive biology of these two fish species is important because it potentially indicates their current population condition in the area. Although the data presented here is restricted to the availability of the fish species during the course of the study period, the present work constitutes vital information on the aspects of the fish reproductive biology, particularly the GSI, fecundity, and adult sex ratio. Owing to the fact that little is known about these aspects, the data gathered in this study provide benchmark information for the management, propagation, and conservation of these two particular fish species.
Materials and Methods
Description of the study site
Lake Lanao is the second deepest lake in the Philippines lying west of a plateau in the province of Lanao del Sur in Mindanao Island, Philippines. It covers 145 square miles of open water and lies at an elevation of 2,100 feet, with a surface area of 354.60 km2 and an altitude of 701.35 m. It has an average depth of 60.0 m and an estimated volume of 21.28 km3. The collection site was confined at the shorelines of the municipality of Marantao. The climate map of Lanao del Sur is classified as Type III in accordance with the distribution of rainfall. It is defined to have pronounced maximum rain periods and short dry seasons lasting only for 1–3 months, usually between December and February or between March and May.
Collection of fish samples
P. tumba and A. testudineus were caught by the local fishermen using gill nets every third week of the month from February 2013 to January 2014. The sample size varies depending on the abundance of fish catch. Sample sizes ranging from 16 to 32 were collected for P. tumba, whereas a declining size from 26 to 4 was collected for A. testudineus. The samples were placed in an iced box for immediate air transport to the laboratory and were processed immediately to minimize the deterioration of the gonads.
Processing of the fish samples
The fish samples were washed with tap water and sorted and packed into corresponding labeled zip-locks. The body length, from the snout to the tip of the forked tail, was measured to the nearest centimeter using a tape measure. The body weight was measured to the nearest gram using a digital top balance.
The sex of the individual specimens was identified after the body measurements. The gastrointestinal tract and other associated tissues and organs were removed to expose the gonads. The gonads were obtained and blotted onto a filter paper to absorb excess blood and water. The length and weight of gonads were recorded and soon after were preserved in 10% buffered formalin contained in 10 ml-sized vials.
At least five representative samples of P. tumba and a minimum of two samples of A. testudineus per month were processed histologically. The fish gonads that were fixed in 10% buffered formalin and processed by standard paraffin method and stained with hematoxylin-eosin. Four sections of each individual fish were analyzed using the Nikon Eclipse TS100 microscope. Histological sections were assessed for the morphological characteristics of the eggs. Eventual clustering was done based on the observed morphological characteristics of the eggs, and the different classes (immature, maturing, mature, ripe, and spent) of gonadal maturity were established. Microscopically, the presence/ absence of distinct nucleus and yolk, oocyte size, and shape were used to determine the oocyte maturation categories. Eggs in each of the slide representing a particular maturity stage were classified, counted, and recorded on a monthly basis according to the established gonadal maturity classes for small- to mediumsized freshwater fishes (Muchlisin et al., 2010).
Monthly variation in sex ratio was determined after counting the total number of both sexes from the monthly collected samples. It was done by dividing both sides of the ratio by the number of females in order to prevent having undefined values of the ratio due to zero counts of males in some of the months. A chisquare test was performed to assess whether there are significant differences in sex ratio from the expected ratio of 1:1.

The spawning periodicity was determined by monthly evaluation of the gonadosomatic index (GSI) of each of the female fish samples. GSI was obtained using the individual gonad and body weights. GSI was calculated using the formula employed by Marcano et al. (2007), Sarkar et al. (2012), and Gupta and Banerjee (2013).

The absolute fecundity (AF) was determined by utilizing the data collected microscopically as shown in the formula below. Each of the gonadal section in the slide was examined; the number of eggs classified under the maturing, mature, and ripe classes was summed up; and the sum obtained was divided by the total number of eggs counted within the section.

The estimated AF values were computed for both fish species from the number of maturing and ripe oocytes that were counted. These spawn able eggs include the maturing oocytes (classes B, C, and D for P. tumba and classes B and C for A. testudineus) and the already mature and ripe oocytes (class E for P. tumba and class D for A. testudineus).
Data analysis/statistical tool
Monthly variation of the sex ratio for each of the species was determined. Tabulated data were constructed to summarize the differences in sex ratio (monthly value and overall value) from the expected ratio of 1:1. A chi-square test using the PhStat of Microsoft Excel 2010 was then performed to analyze the data. A test with a P < 0.05 indicates a significant statistical analysis.
The mean GSI values of the female samples for each month were computed. The correlation analysis was used to establish the relationship of the GSI to that of the mean body lengths and the gonad lengths and that of the AF per month to its relationship to body and gonad measurements. A test with a P < 0.05 indicates a significant statistical analysis.
Results
Adult sex ratio
A female-favored ratio was obtained for most of the months of collection except for the months of July (P. tumba; Table 1A) and March (A. testudineus; Table 1B).
| Months |
Total |
Male (n) |
Female (n) |
F:M |
X2 |
Remark |
| Oct |
28 |
1 |
27 |
1:0.037 |
9121.3 |
S |
| Nov |
25 |
5 |
20 |
1:0.25 |
2701.7 |
S |
| Dec |
26 |
12 |
14 |
1:0.86 |
49.7 |
S |
| Jan |
32 |
13 |
19 |
1:0.68 |
557.31 |
S |
| Feb |
29 |
10 |
19 |
1:0.53 |
1132.6 |
S |
| Mar |
26 |
6 |
20 |
1:0.3 |
2450.3 |
S |
| Apr |
23 |
6 |
17 |
1:0.35 |
1331.6 |
S |
| May |
20 |
4 |
16 |
1:0.25 |
1369.5 |
S |
| Jun |
16 |
5 |
11 |
1:0.45 |
269.66 |
S |
| Jul |
27 |
14 |
13 |
1:1.08 |
13.11 |
S |
| Aug |
20 |
7 |
13 |
1:0.54 |
341.57 |
S |
| Sept |
20 |
4 |
16 |
1:0.25 |
1369.5 |
S |
n = sample size; F:M = female:male; X2 = Chi-square; S = significant at 5%
Table 1A: The sex ratio of P. tumba obtained within an annual period.
| Months |
Total |
Male (n) |
Female (n) |
F:M |
X2 |
Remark |
| Oct |
4 |
0 |
4 |
1:0 |
NA |
NA |
| Nov |
8 |
3 |
5 |
1:0.6 |
26.966 |
S |
| Dec |
- |
- |
- |
- |
- |
- |
| Jan |
9 |
0 |
9 |
1:0 |
NA |
NA |
| Feb |
26 |
1 |
25 |
1:0.04 |
7199.5 |
S |
| Mar |
5 |
3 |
2 |
1:1.50 |
323.6 |
S |
| Apr |
7 |
2 |
5 |
1:0.66 |
24.027 |
S |
| May |
- |
- |
- |
- |
- |
- |
| Jun |
16 |
10 |
6 |
1:1.66 |
13.917 |
NS |
| Jul |
- |
- |
- |
- |
- |
- |
| Aug |
- |
- |
- |
- |
- |
- |
| Sept |
- |
- |
- |
- |
- |
- |
n = sample size; F: M = female:male; X2 = Chi-square; S = significant at 5%;
- NS = not significant; NA = not applicable; dashed lines indicate no samples collected
Table 1B: The sex ratio of A. testudineus obtained within an annual period.
GSI of the two fish species population
P. tumba
The mean GSI was observed to reach peaks on the months of May, August, and September (Figure 1A) and showed a decline in October onwards to April where the range is from 3.19 to 1.34. The GSIs on the months of June and July were comparable with those of the months of March and April.
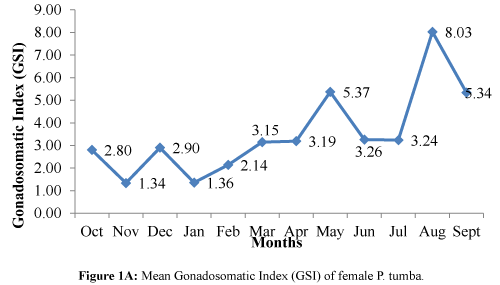
Figure 1A: Mean Gonadosomatic Index (GSI) of female P. tumba.
A. testudineus
The GSI exhibited an increasing trend from October, and the highest peak was observed in November (Figure 1B). A steady increasing pattern was observed in January ensuing up to the March. The GSI had a tendency of declining for the months of April to July. The scarcity of fish in the lake led the researchers to not obtain samples of A. testudineus for the months of December, May, July, August, and September.
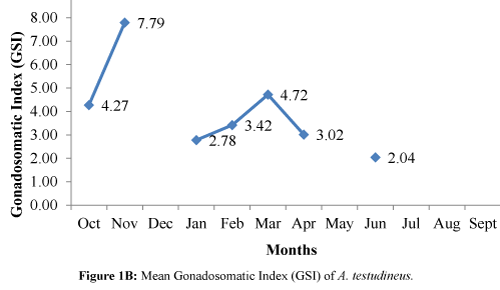
Figure 1B: Mean Gonadosomatic Index (GSI) of A. testudineus.
Oocyte maturation stages
There were six identified categories of stages of oocyte maturation for P. tumba (Table 2A and Figure 2A) and five for A. testudineus (Table 2B and Figure 2B).
| Stage of maturity |
Description |
| A (immature) |
smallest, irregularly shaped oocyte with central translucent nucleus but is not visible to the naked eye |
| B (maturing) |
medium sized and spherical oocyte that appears opaque due to its yolk |
| C (mature type 1) &
|
medium sized, round and yolk-laden oocyte with translucent periphery |
| E (ripe) |
oocyte has reached its maximum size, spherical and opaque in appearance |
| F (spent) |
irregularly shaped oocyte that has emptied its content or is about to collapse |
Table 2A: The stages of oocyte maturation of P. tumba with the corresponding histologic description for each stage.
| Stage of maturity |
Description |
| A (immature) |
smallest oocyte not visible to the naked eye but when magnified appears as a purplish, irregularly shaped cell with nucleus at the center and has no yolk |
| B (maturing) |
pinkish, medium sized, round oocyte undergoing yolk formation |
| C (mature) |
pinkish, medium sized, round oocyte whose yolk has accumulated in the big central space |
| D (ripe) |
big, bean-shaped oocyte with granules and yolk inside |
| E (spent) |
big, irregularly shaped oocyte that has collapsed and has emptied its interior or is about to collapsed |
Table 2B: The stages of oocyte maturation of A. gtestudineus with the corresponding histologic description for each stage.
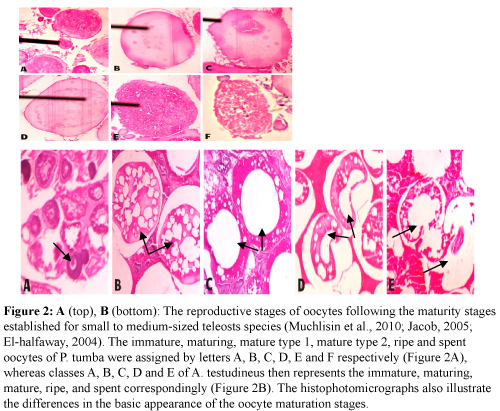
Figure 2: A (top), B (bottom): The reproductive stages of oocytes following the maturity stages established for small to medium-sized teleosts species (Muchlisin et al., 2010; Jacob, 2005; El-halfaway, 2004). The immature, maturing, mature type 1, mature type 2, ripe and spent oocytes of P. tumba were assigned by letters A, B, C, D, E and F respectively (Figure 2A), whereas classes A, B, C, D and E of A. testudineus then represents the immature, maturing, mature, ripe, and spent correspondingly (Figure 2B). The histophotomicrographs also illustrate the differences in the basic appearance of the oocyte maturation stages.
Estimated fecundity and its observed pattern with GSI
P. tumba
The fecundity observed for P. tumba ranges from 0.0003 to 0.4930 (Table 3A), whereas the fecundity observed for A. testudineus ranges from 0.08 to 0.74 (Table 3B). The AF showed maximum peaks during the months of May, June, July, and August (Figure 3A). However, a decline was evident during the months of September to January, and slight increase during the months of February, March, and April ranging from 0.0188 to 0.0681.
| Month |
A |
B |
C |
D |
E |
F |
BCDE |
TOT |
Fec. |
| Oct |
0 |
0 |
0 |
0 |
0 |
2092 |
0 |
2092 |
0.0000 |
| Nov |
1306 |
0 |
0 |
0 |
0 |
2026 |
0 |
3331 |
0.0000 |
| Dec |
192 |
0 |
0 |
0 |
1 |
1794 |
1 |
1987 |
0.0003 |
| Jan |
58 |
0 |
0 |
0 |
2 |
1358 |
2 |
1419 |
0.0017 |
| Feb |
3778 |
100 |
18 |
49 |
85 |
1390 |
253 |
5421 |
0.0466 |
| Mar |
351 |
9 |
6 |
30 |
69 |
1210 |
114 |
1675 |
0.0681 |
| Apr |
109 |
11 |
0 |
0 |
17 |
1342 |
28 |
1479 |
0.0188 |
| May |
112 |
70 |
14 |
111 |
5 |
142 |
201 |
455 |
0.4411 |
| Jun |
53 |
124 |
63 |
7 |
6 |
181 |
200 |
434 |
0.4601 |
| Jul |
8 |
152 |
17 |
1 |
1 |
197 |
171 |
376 |
0.4542 |
| Aug |
189 |
81 |
107 |
58 |
51 |
116 |
297 |
602 |
0.4930 |
| Sept |
1261 |
0 |
0 |
0 |
1 |
2004 |
1 |
3266 |
0.0002 |
BCDE= Spawnable eggs; TOT= Total number of oocytes; Fec.= Absolute Fecundity
Table 3A: The annual record of oocyte count and absolute fecundity of female P. tumba.
| Month |
A |
B |
C |
D |
E |
TOTAL |
BCD. |
Fec. |
| Oct |
273.5 |
54.2 |
27.4 |
45.8 |
238.6 |
127 |
640 |
0.20 |
| Nov |
598.2 |
158 |
52.8 |
77.4 |
145.8 |
288 |
1032 |
0.28 |
| Dec |
- |
- |
- |
- |
- |
- |
- |
- |
| Jan |
644.5 |
45.6 |
6.2 |
25.6 |
208.2 |
77 |
930 |
0.08 |
| Feb |
185 |
154 |
141 |
65.4 |
40 |
360 |
585 |
0.62 |
| Mar |
256.6 |
134.2 |
187.6 |
71.4 |
26.6 |
393 |
676 |
0.58 |
| Apr |
124.6 |
473.8 |
144.4 |
144.8 |
143 |
763 |
1031 |
0.74 |
| May |
- |
- |
- |
- |
- |
- |
- |
- |
| Jun |
962.4 |
61 |
137.2 |
51 |
2053 |
249 |
3265 |
0.08 |
| Jul |
- |
- |
- |
- |
- |
- |
- |
- |
| Aug |
- |
- |
- |
- |
- |
- |
- |
- |
| Sept |
- |
- |
- |
- |
- |
- |
- |
- |
CDE= Mature eggs for spawning; TOT= Total number of oocytes; Fec = Absolute Fecundity
Table 3B: The annual record of oocyte count and absolute fecundity of female A. testudineus.
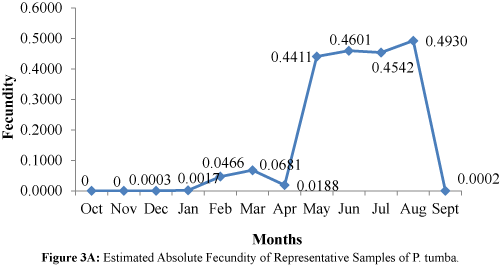
Figure 3A: Estimated Absolute Fecundity of Representative Samples of P. tumba.
A. testudineus
The maximum peaks were observed in the months of February, March, and April (Figure 3B). An increasing trend was also observed for the months of October and November.
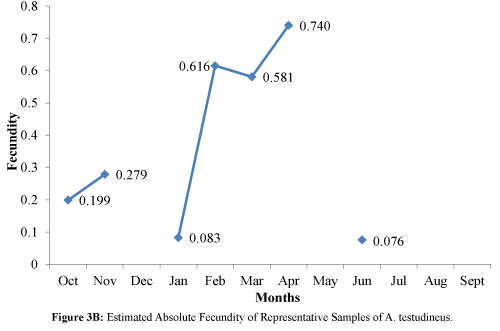
Figure 3B: Estimated Absolute Fecundity of Representative Samples of A. testudineus.
A distinct pattern was observed in the estimated AF and GSI for both P. tumba and A. testudineus (Figures 4A and 4B). An increasing trend in both the estimated AF and GSI was evident for P. tumba for the months of October to June (Figure 4A), whereas an increase in the estimated AF and GSI for the months of October to November and from January to March for A. testudineus (Figure 4B). The seasonality of the reproductive stages of the two fish species using the GSI and fecundity data was predicted as shown in Table 4.
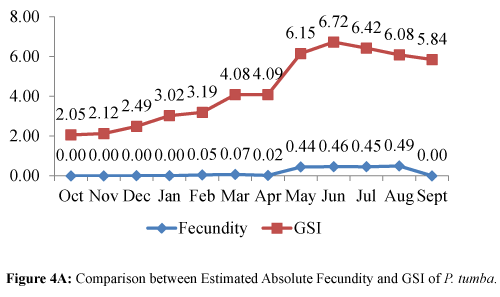
Figure 4A: Comparison between Estimated Absolute Fecundity and GSI of P. tumba.
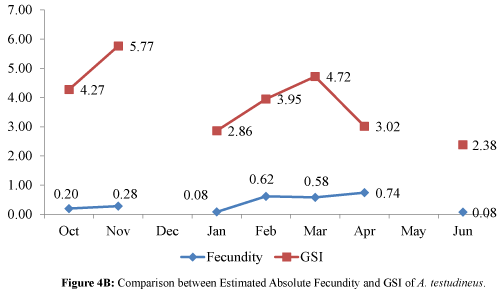
Figure 4B: Comparison between Estimated Absolute Fecundity and GSI of A. testudineus.
| |
P. tumba |
A. testudineus* |
| Maturation Period
|
Jan-May
- Nov-May (GSI)
- Jan-May (Fecundity)
|
Oct-Feb
- Oct-Nov and Jan-Mar (GSI)
- Oct-Nov and Jan-Feb (Fecundity)
|
| Spawning Season
|
May-Aug
- May and Aug (GSI)
- May-Aug (Fecundity)
|
Feb-Apr
- Nov and Mar (GSI)
- Feb-Apr (Fecundity)
|
| Breeding Season
|
Sept-Jan
- Jun-Jul and Sept-Nov (GSI)
- Sept-Jan (Fecundity)
|
Apr-Jun
- Dec-Jan and Apr-Jun (GSI)
- May-Jun (Fecundity)
|
* = no samples obtained during the months of May, Jul, Aug, Sept and Dec
Table 4: The summary of the established seasonality of reproductive stages of the two fish species based on some aspects of their reproductive biology.
Correlation of GSI with body length and gonad length of the population and fecundity with body length and gonad length
There were no significant relationships found between the GSI and those of body length and gonad length in both species (Figure 5) (P > 0.05). Similarly, there were no significant relationships (P > 0.05) found between fecundity and those of body length and gonad length in both species (Figure 6).
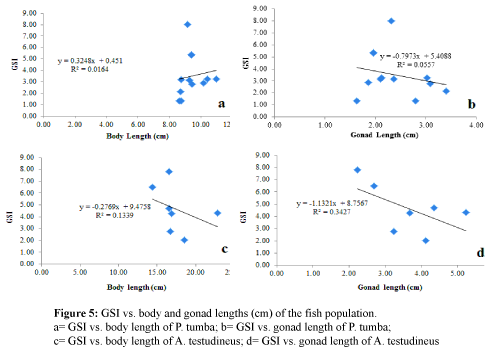
Figure 5: GSI vs. body and gonad lengths (cm) of the fish population
- a= GSI vs. body length of P. tumba; b= GSI vs. gonad length of P. tumba;
- c= GSI vs. body length of A. testudineus; d= GSI vs. gonad length of A. testudineus
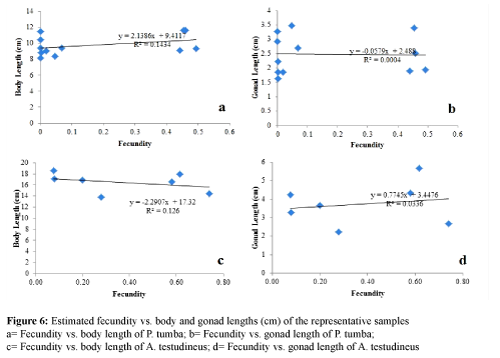
Figure 6: Estimated fecundity vs. body and gonad lengths (cm) of the representative samples
- a= Fecundity vs. body length of P. tumba; b= Fecundity vs. gonad length of P. tumba;
- c= Fecundity vs. body length of A. testudineus; d= Fecundity vs. gonad length of A. testudineus
Discussion
In the Philippines, fish is an important source of protein for Filipinos, and the availability and accessibility of such commodity are of utmost importance.
Our study has shown that there is a female-biased adult sex ratio in most times of the year suggesting a sustainable population for both species. The dominance of females in the population is indicative that a steady production of oocytes could be sustained. However, there were times of the year, like the month of July for P. tumba and the month of March for A. testudineus, that showed a male-favored population. The occurrence of a male-favored population in July (P. tumba) and in March (A. testudineus) may result to an efficient fertilization corresponding to the peaks in GSI and fecundity. In one study (Mendoza-Carranza and Franyutti, 2005), a decrease in the proportion of captured males was attributed to the energetic cost of oral incubation and the migration from fishing areas to estuarine zones to release their progeny. In the case of Lake Lanao, there is likely a migration of the fish species from frequented fishing zones to safer habitats.
The months with the highest peaks in the GSI may be indicative of each fish species respective spawning periods. For P. tumba, it was observed that there was a very short breeding period in between the peaks as relatively low GSI occurrences were seen in the months of June and July. For A. testudineus, the spawning season could be in October, November and March which are the months that showed high GSI values. The months with the high GSI values coincide with the wet season, indicative of a colder temperature. A study (Muchlisin et al., 2010) has indicated that colder temperatures trigger the spawning of freshwater fish species; hence, they tend to migrate from the lake to neighboring rivers with colder temperature.
Apart from the temporal changes in relation to the periods of growth and development, maturation, spawning, and breeding, we expect that the differences may also be influenced by the changes in the environmental condition and the availability of resources in the area. A copious body of knowledge states that timing is crucial for the reproductive cycles of vertebrates from fish to mammals wherein the young are expected to appear when food is most available and other environmental conditions are optimal for survival of the offspring (Hickman et al., 1997; Campbell et al., 2005). The variations in the growth and developmental periods of these two fish species may be influenced by their ability to adapt and to cope with ecological instabilities and availability of resources to meet their life-sustaining needs.
The months of maximum peaks of AF in P. tumba that were observed may be indicative of the periods where the fish species is ready to go about its spawning season. The months of September to January that showed decrease in the AF values may possibly indicate the maturation-to-breeding season. The periods predicted to be the spawning, maturation, and breeding season coincide with the GSI data. Similarly, the peak of fecundity observed for A. testudineus during the months of February, March, and April suggests the possible spawning season of the fish species. It is likely that the months of June, September, and October, based on the decrease in fecundity values, are suggestive of the maturationto- breeding season. It was noticed that a high GSI value likewise indicates a high fecundity value. Since both the AF and GSI values reached their peaks in the months of May to August for P. tumba, these months indicate the spawning periods of the fish species, and the month of September had the lowest GSI and fecundity, indicating the period as the maturation-to-breeding season. The relatively low AF value for A. testudineus in the months of June, October, November, and January is suggestive of the fish’s maturation-to-breeding season. This, however, is more of a speculation than a close estimate because of the dearth of samples collected in July, August, September, and December. The peak of spawning period of A. testudineus most likely occurs during the months of February, March, and April. It can be speculated further that the environmental conditions in most of the months were not optimal to induce reproductive success. In numerous studies, extreme cases of low environmental conditions can induce reproductive failure and lead to skip spawning seasons (Bell et al., 1992; Livingston et al., 1997). A large body of previous studies reported that the different reproductive strategies among fish species often account for the differences in fecundity among fish species (Murua et al., 2003; Wooton 1984). Furthermore, environmental pollution can also affect fecundity (Johnson et al., 1998). Unfortunately, an estimate of the fecundity of the two fish species in conjunction with the existing environmental and biological conditions of the lake was not taken into account in this study.
The absence of a linear relationship between the estimated fecundity and the body lengths of both fish species could be accounted for the constancy of the body length of the fish species that were examined. We noted that the fish species tend to grow up to a certain body length and they remain to have the same body length throughout the year despite the periodic variations in the fecundity values that we observed (Figure 6). Likewise, the lack of a linear correlation between the estimated fecundity and the gonad lengths of both fish species studied was observed. The result of our study on this aspect, however, is not in parallel with a great number of reported studies (Hossain et al., 2012; Adebiyi, 2012), where positive correlations were found between fecundity and body length and weight. It is likely that the lack of correlation may be due to the fact that fecundity is more related to the number of mature to ripe eggs than with that of the length of the ovary. Apparently, the gonads that we examined for length showed varying fecundity.
Conclusion and Further studies
The reproductive biology of the two fish species in Lake Lanao was examined, and the different periods of growth and development, maturation, spawning, and breeding on a year round were established. The generated information from this study provides a useful tool to the fishermen and the resource managers for the future management, propagation, and conservation of these fish species in Lake Lanao. The need for continuous studies on the other aspects of reproductive biology that may include correlation analysis of the reproductive cycle and environmental variables and study on reproductive strategies considering the different habitats present in the lake would be worthwhile.
Acknowledgment
The authors are grateful to Mr. Roberto B. Corcino, his MS students, and the fishermen of Lake Lanao for finding all the possible ways that the fish samples were collected every month.
9376
References
- Adebiyi, F.A., (2012).Aspects of reproductive biology of big eye grunt Brachydeuterus auritus(Valenciennes, 1832). Nature and Science 10, 19–24
- nBell, J.D., Lyle, J.M., Bulman, C.M., Graham, K.J., Newton, G.M. et al., (1992).Spatial Variation in reproduction and occurrences of non-reproductive adults, in orange roughy, HoplostethusatlanticusCollett (Trachichthyidae) from southeastern Australia. J. Fish Biol., 40, 107–122
- nCampbell, N.A., Reece, J.B., Urry, L.A., Cain, M.L., Wasserman, S.A. et al., (2008).Biology (8thed). Pearson Benjamin Cummings, United States of America
- nGupta, S., Banerjee, S.,(2013).Studies on some aspects of the reproductive biology of Amblypharyngodonmola. International Research Journal of Biological Sciences 2, 69–77
- nHerre, A., 1924.Distribution of the true freshwater fishes in the Philippines. II: The Philippine Cyprinidae. The Philippine Journal of Science 24, 249–307
- nHickman Jr. C.P., Roberts, L.S., Larson, A., (1997).Integrated Principles of Zoology. WCB/McGraw-Hill, Co., United States of America
- nHossain, M.Y., Rahman, M.M., Abdallah, E.M., (2012).Relationships between body size, weight, condition and fecundity of the threatened fish Puntiusticto (Hamilton, 1822) in the Ganges River, Northwestern Bangladesh. Sains Malaysiana 41, 803–814
- nIsmail, G.B., Sampson, D.B., Noakers, D.L.G., (2014).The status of Lake Lanao endemic cyprinids (Puntius species) and their conservation. Environ. Biol. Fish. 97, 425–434
- nJohnson,L.L., Misitano, D., Sol, S.Y., Nelson, G.M., French, B., Ylitalo, G.M., Hom, T., 1998. Contaminant effects on ovarian development and spawning success in rock sole from Puget Sound, Washington. Trans Am. Fish Soc. 127, 375–392
- nLivingston, M.E., Vignaux, M., Schofield, K.A.,(1997).Estimating the annual proportion of non-spawning adults in New Zealand hoki, Macruronusnovaezelandiae. Fish Bull. US 95, 99–113
- nMarcano, D., Cardillo, E., Rodriguez, C., Poleo, G., Gago, N., Guerrero, H., (2007).Seasonal reproductive biology of two species of freshwater catfish from the Venezuelan floodplains. General and Comparative Endocrinology 153, 371–377
- nMendoza Carranza, M., Hernández-Franyutti, A., (2005).Annual reproductive cycle of gafftopsail catfish, Bagremarinus (Ariidae) in a tropical coastal environment in the Gulf of Mexico. Hidrobiológica 15, 275–282
- nMuchlisin, Z., Musman, M., Azizah, M., (2010). Spawning seasons of Rasboratawarensis (Pisces: Cyprinidae) in Lake LautTawar, Aceh Province, Indonesia.Reproductive Biology and Endocrinology 8, 49
- nMurua, H., Kraus, G., Saborido-Rey, F., Wittzhames, P.R., Thorsen, A., Junquera, S.,(2003). Procedures to estimate fecundity of marine fish species in relation to their reproductive strategy. J. Northwest Atl. Fish. Sci. 33, 33–54
- nSarkar, U., Kumar, R., Dubey, V., Pandey, A., & Lakra, W. (2012). Population structure and reproductive biology of a Freshwater Fish, Labeoboggut (Sykes, 1839), from two perennial rivers of Yamuna Basin. J. Applied Ichthyology [0175-8659]; 28, 107-115
- nWooton, R.J., (1984). Introduction: tactics and strategies in fish reproduction, in: Potts, G.W., Wooton, R.J. (Eds.), Fish Reproduction: Strategies and Tactics. Academic Press, New York, 1–12.
