Keywords
Fish larvae; Exposure; Coral reef; Dispersal; Red Sea
Introduction
The tropical marine ecosystem is characterized by the presence of the coral reefs, which support a large variety of fish communities, and benthic fauna that are sources of eggs and larvae of fish and benthic fauna, and the open ocean, where mesopelagic fish dominate the fish community (Nonaka et al. 2000). The distribution of the pelagic stages of coral reef fishes has received more attention than any other aspects of their biology and show that larvae of the coral reef fishes can be found from water over the reef to the open ocean many hundreds of kilometres from any reef (Victor, 1987). As such, the knowledge of the natural history and ecology of fish larvae is very important for the understanding of the biology of fishes (Leis & Rennis, 1983).
Fish larval distribution is influenced by spawning behaviour of the adult fish, hydrographic structure at a variety of scales and the interaction with the reef topography, duration of the larval period, behaviour of the larvae and larval mortality and growth and their variation in space and time (Leis, 1991a). The degree of larval dispersal affects the connectivity between reef fish populations which in turn influences their dynamics and small-scale studies on larval spatial distributions can give important information about possible retention mechanisms near to the adult’s habitats. Moreover, the study of small-scale temporal patterns of variation in the composition of assemblages can be used to determine the duration of the breeding seasons and dynamics of recruitment patterns of coastal species. Many adult reef fishes are sedentary and the pelagic stage of most species probably has a broader range than the demersal adult stage (Sale, 1980) hence the pelagic, juvenile stage is more likely to determine the geographical size of populations than the adult stage (Leis, 1986).
Habitat selection of reef fish larvae at settlement is one of the mechanisms proposed to explain spatial patterns in the distribution of fishes and the corresponding spatial structure of the communities (Leis, 1991). The larval fish assemblages in nearshore waters are complex both in terms of species composition and patterns of distributions (Sponaugle et al.2002) and their spatial and temporal variations have been mainly related to the meteorological, environmental and oceanographic seasonal features (Hernández-Miranda et al.2003). Short-term coupling between physical processes and biological mechanisms can strongly modify the distribution and abundance of larval stages. Furthermore, the location and abundance of larval stages may exhibit a strong relationship with the type of habitat or spawning grounds of the adults (Cushing, 1990).
The present study aims to complement the very few studies on the larvae of the coral reef fishes in the Red Sea. Information on the composition of larval communities in the Egyptian Red Sea is limited (Abu El-Regal, 1999; Abu El-Regal, 2008, 2009). Although there is a highly diverse adult reef fish community in Hurghada (e.g. Al-Khloy, 1964; Ormond and Edwards, 1987; Debelius, 1998), nothing is known about the distribution of their larval stages and recruitment processes. Similarly, there are very few comprehensive studies on larval development and taxonomy in the tropical Indo-Pacific coastal fishes (Leis & Rennis, 1983; Leis & Trnski, 1989; Leis & Carson-Ewart, 2002). Nellen (1973) sampled larval fish from the southern entrance of the Red Sea and Gulf of Aden as part of a larger Indian Ocean survey but his samples were taken during a single cruise only and did not give any information about spawning seasons.
Regional and spatial distribution of larvae of coral reef fish at Sharm El-Sheikh (Abu El-Regal, 1999) and Hurghada (Abu El-Regal, 2008) has been studied. The present study builds on that information by analysing the composition and distributional patterns of larval fish community on the coral reefs of the Red Sea in both inshore and offshore sites and in exposed and sheltered sides of the reef in each site. In particular, the study tests the hypothesis that larval stages of coral reef fishes from inshore and offshore reefs of different levels of exposure have the same community structure and same pattern of spatial and temporal distribution.
Material and Methods
Study Area
The study area at the northern part of Hurghada, on the Egyptian coast of the Red Sea was divided into inshore and offshore sites (Figure1). The inshore site was adjacent to the Hurghada Marine Biological Station (MBS) and the offshore sites were near the Big Giftun Island. The inshore site (stations H3, X3) lies in the northern tip of the Red Sea 5 km away from the centre of Hurghada city. This site contains fringing reefs extending from the shore for about 500 m and contains many lagoons. It extends to about 150 m seaward and ends with a lagoon of 5 m depth. The lagoon is followed by a ribbon-like reef. The offshore site, Big Giftun Island, is a very popular dive site that lies about 15 miles away from the Hurghada coast and are characterized by extensive and diverse coral cover and ichthyofauna. Two sites, Sabina 1 (X1, H1) and Sabina 2 (X2, H2), were sampled. At each site larvae were collected from both exposed and sheltered sides of the coral reef. A brief description of the different sites sampled during the study is given in Table 1.
| Site |
Code |
Coordinates |
Location |
Exposure |
Substrate type |
Depth
|
| Latitudes |
Longitude |
| Sabina 1 |
H1 |
27º 11‘ 5" |
33º 57‘
|
Offshore |
Sheltered |
Mostly sand |
0.5 - 1.5 |
| |
X1 |
27º 11‘’47 |
33º 57‘ 8" |
Offshore |
Exposed |
Mostly coral |
8-12.5 |
| Sabina 2 |
H2 |
27º 12‘’44 |
33º 57‘
|
Offshore |
Sheltered |
Mostly coral |
13-20 |
| |
X2 |
27º 13‘ 6 |
33º 57‘
|
Offshore |
Exposed |
Mostly coral |
25 - 40 |
| NIOF |
H3 |
27º 17‘ 6 |
33º 46‘
|
Inshore |
Sheltered |
Mostly algae &
|
7 |
| |
X3 |
27º 17‘
|
33º 46‘
|
Inshore |
Exposed |
Sand & rubbles |
9-12.5 |
Table 1: Location, coordinates, and description of sites.
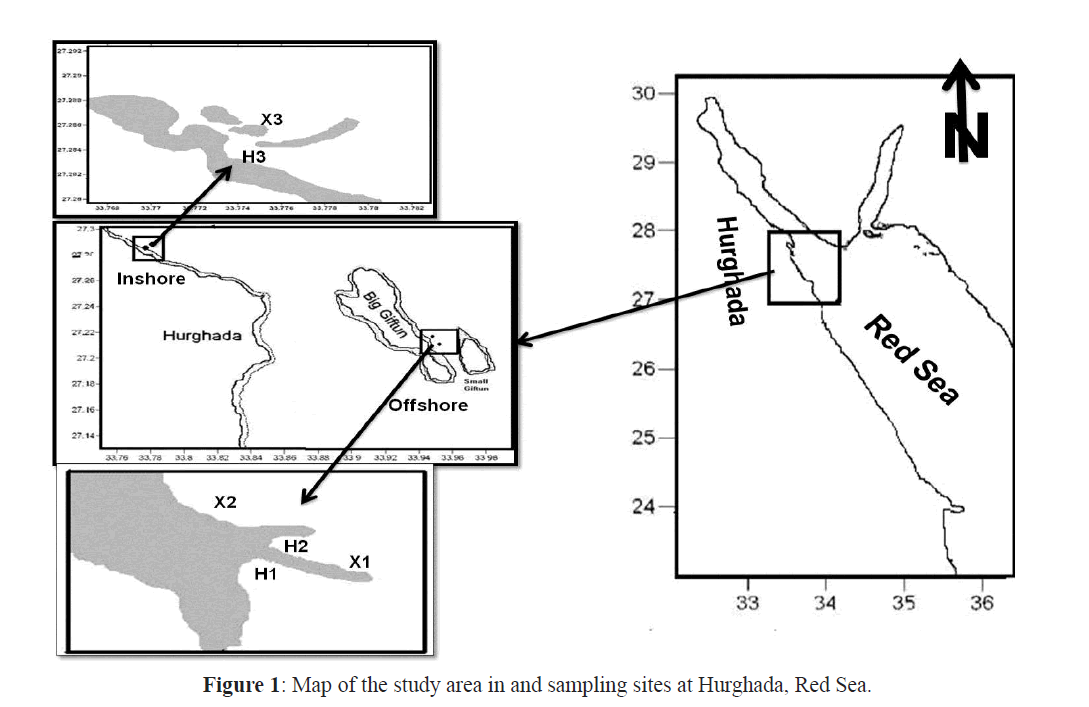
Figure 1: Map of the study area in and sampling sites at Hurghada, Red Sea.
Field and Laboratory Procedure
Sampling and Preservation
The environmental parameters of temperature, salinity, pH, and dissolved oxygen were measured simultaneously using the Hydro-Lab on a bimonthly basis. The ichthyoplankton was collected monthly during the period from for one year using 50 cm mouth diameter plankton net with a mesh size of 0.5 mm in early morning just before sunrise. Nets were towed horizontally parallel to the reef and about 10-50 m away from the reef edge for 5-10 minutes with a towing speed of 1.5 to 2.5 knots. Samples preserved in buffered 5% formalin solution in seawater on board for laboratory investigation. In most cases three replicates were taken although occasionally, due to sampling difficulties, only one or two replicates were obtained. The net was equipped with a flow meter to calculate the volume of water filtered. Densities of fish larvae were related to 1000 m3 of water.
Laboratory Procedures
The samples were sorted and examined under Olympus SZX7 stereomicroscope and the sorted larvae were identified to the highest possible taxonomic separation. All larvae were measured to the nearest 0.1 mm before final preservation in 70% ethanol.
Data analysis
The univariate statistics were done in SPSS v.17.0, using ANOVA to determine differences in number of individuals and number of species between months and sites. Chi squared test was performed in order to find out the association between the degree of exposure and proximity to the shore and their influence on the structure of the larval fishes.
All data were tested for homogeneity of variance and where the samples were not homogeneous, data were either transformed or the non-parametric Kruskal-Wallis test was used (Zar, 1999; Dytham, 2003). The cluster analysis, to determine similarities between sites and months, and diversity indices (species richness, the evenness and diversity index), were calculated using PRIMER (Plymouth Routines in Multivariate ecological Research) v 5.2.
Results
Hydrographical Conditions
The annual mean surface water temperature was 24.89°C at Giftun and 25.16°C at MBS with the maximum during summer (July till September) and the minimum during winter (January till March) (Table 2). They fluctuated from 21.26°C in January to 27.35°C in July at the Giftun island site and from 19.54°C in January to 27.90°C in July at the inshore site. Low variability in environmental conditions was observed among sites and seasons. The seasonal and regional distribution patterns of salinity showed very slight variations where the mean annual salinity was 39.78 at Giftun and 39.92 inshore. The lowest value of 39.5 was recorded in March at Giftun islands and the highest was 40.1 was recorded in July at the inshore site. Values of pH varied little from 8.07 to 8.23 and the water dissolved oxygen showed no pronounced variations and no indication of hypoxia; the oxygen concentration varied from 6.55 mg l-1 in July to 8.05 in January at Giftun and from 7.08 in July to 7.57 in January inshore. The annual mean oxygen concentrations were 7.3 at Giftun and 7.53 inshore.
| |
Temp |
Salinity |
Transparency |
| Site |
Jan |
Mar |
May |
Jul |
Sep |
Jan |
Mar |
May |
Jul |
Sep |
Jan |
Mar |
May |
Jul |
Sep |
| H1 |
21.26 |
23.13 |
25.95 |
27.35 |
26.76 |
40.03 |
39.3 |
39.5 |
39.9 |
40.1 |
1.2 |
1.2 |
1.5 |
1.5 |
1.5 |
| X1 |
20.8 |
22.8 |
26.08 |
27 |
26.5 |
40 |
39.8 |
39.8 |
39.9 |
39.8 |
10 |
10.6 |
11 |
11 |
11 |
| X2 |
20.6 |
22.4 |
25.89 |
27 |
26 |
39.9 |
39.6 |
39 |
39.9 |
40 |
10 |
10 |
10 |
107 |
10 |
| H2 |
21.5 |
23.3 |
33.1 |
27.7 |
27 |
40.01 |
40 |
39.5 |
39.9 |
39.9 |
8 |
8 |
8 |
8 |
8 |
| X3 |
19.14 |
23.57 |
26.03 |
27.9 |
27 |
40 |
39 |
39.7 |
39.9 |
40 |
9 |
9 |
9 |
9 |
9 |
| H3 |
19.54 |
23.99 |
26.89 |
27.9 |
27.48 |
40 |
39.5 |
39.6 |
39.9 |
39.9 |
6 |
as |
6 |
65 |
6 |
Table 2: Hydrographic parameters in Hurghada during the period of study.
Density
The overall average density of fish larvae at all sites was 202 individuals 1000 m-3 and there is a significant difference between all sites (ANOVA F=4.453, P<0.01) and between all months (χ2=63.379, P<0.01) concerning the larval density. Tukey’s post hoc comparison indicated that H3 was significantly different from all other sites (P<0.05). It had the highest density with 2824 larvae 1000 m-3 over the whole year while the inshore exposed site X3 had the lowest density among all sites (621) (Figure 2 and Table 3).
| Fish taxa |
H1 |
X1 |
H2 |
X2 |
H3 |
|
X3 |
| Mean StD |
Mean StD |
Mean StD |
Mean |
StD |
Mean StD Mean StD |
| A budefdufsaxatlis |
0 |
0 |
0 |
0 |
0 |
0 |
0 |
0 |
51 |
41 |
11 |
10.1 |
| ACCO2thlina sp. |
0 |
0 |
0 |
0 |
3.67 |
5.51 |
0 |
0 |
0 |
0 |
0 |
02 |
| Apogontaen lakes |
0 |
0 |
0 |
0 |
0 |
0 |
0 |
0 |
2 |
3 |
0 |
0.0 |
| Atherinomoruslacunosus |
920 |
218 |
513 |
220 |
559 |
104 |
419 |
149.0 |
1329 |
136 |
213 |
933 |
| Bent osema ,oterotum |
0 |
0 |
43 |
24 |
0 |
0 |
162 |
412 |
0 |
0 |
0 |
0.0 |
| Bythitidae |
0 |
0 |
0 |
0 |
2 |
3 |
0 |
0 |
16 |
19 |
0 |
02 |
| C. quinquineatus |
0 |
0 |
0 |
0 |
0 |
0 |
0 |
0 |
2 |
3 |
0 |
0.0 |
| Callionyrnidae |
0 |
0 |
0 |
0 |
0 |
0 |
15.8 |
7.7 |
0 |
0 |
0 |
0.0 |
| Centrepygemultis,oinis |
0 |
0 |
0 |
0 |
0 |
0 |
5.9 |
5.1 |
0 |
0 |
0 |
0.0 |
| Diodonhystx |
0 |
0 |
0 |
0 |
0 |
0 |
0.0 |
0.0 |
2 |
3 |
0 |
0.0 |
| Engraulidae |
0 |
0 |
0 |
0 |
0 |
0 |
15.3 |
4.4 |
0 |
0 |
0 |
0.0 |
| Enreapterguis sp. |
0 |
0 |
402 |
313 |
0 |
0 |
412 |
382 |
8 |
7 |
0 |
0.0 |
| Epine,ohel us sp. |
0 |
0 |
0 |
0 |
0 |
0 |
2.9 |
5.1 |
0 |
0 |
0 |
0.0 |
| Exocoetidae |
0 |
0 |
5 |
4 |
0 |
0 |
93.4 |
8.1 |
27 |
14 |
0 |
0.0 |
| Fistulariacommersonil |
0 |
0 |
0 |
0 |
0 |
0 |
0.0 |
0.0 |
2 |
3 |
0 |
0.0 |
| Gerresoyena |
0 |
0 |
0 |
0 |
0 |
0 |
0.0 |
0.0 |
166 |
82 |
3 |
5.6 |
| Gobiidae |
3 |
5 |
0 |
0 |
0 |
0 |
13.4 |
11.8 |
8 |
14 |
0 |
0.0 |
| m pus so. |
0 |
0 |
0 |
0 |
0 |
0 |
16.6 |
1.0 |
7 |
8 |
0 |
0.0 |
| Hypoatherinatemmincki |
80 |
27 |
106 |
26 |
79 |
12 |
35.8 |
12.0 |
324 |
149 |
94 |
73.9 |
| Hyporham,oh us gam brur |
0 |
0 |
0 |
0 |
0 |
0 |
0.0 |
0.0 |
118 |
62 |
6 |
2.8 |
| Labridae |
0 |
0 |
0 |
0 |
0 |
0 |
0.0 |
0.0 |
0 |
0 |
5 |
8.1 |
| Lutjanidae |
0 |
0 |
0 |
0 |
0 |
0 |
13.7 |
11.9 |
0 |
0 |
0 |
0.0 |
| Microdesmidae |
0 |
0 |
8.5 |
02 |
0.0 |
0.0 |
10.0 |
5.8 |
0 |
0 |
0 |
0.0 |
| Mu Ilidae |
0 |
0 |
12.4 |
15.0 |
0.0 |
0.0 |
219.0 |
56.8 |
25 |
15 |
0 |
0.0 |
| Myrioristis m urdjan |
0 |
0 |
15.6 |
52 |
0.0 |
0.0 |
12.1 |
2.3 |
0 |
0 |
0 |
0.0 |
| Na so |
0 |
0 |
3.0 |
52 |
0.0 |
0.0 |
0.0 |
0.0 |
0 |
0 |
0 |
0.0 |
| Omobran di us puctatus |
0 |
0 |
5.6 |
42 |
0.0 |
0.0 |
43.4 |
31.3 |
3 |
5 |
0 |
0.0 |
| Ostraciion so. |
0 |
0 |
0.0 |
0.0 |
0.0 |
0.0 |
0.0 |
0.0 |
2 |
3 |
0 |
0.0 |
| P. ancylodon |
0 |
0 |
0 |
0 |
0 |
0 |
0 |
0.0 |
56 |
26 |
2 |
2.8 |
| Paracaesiosordidus |
0 |
0 |
23.6 |
52 |
2.3 |
32 |
16.6 |
1.0 |
0 |
0 |
0 |
0.0 |
| Rem oheris so. |
0 |
0 |
0 |
0 |
0 |
0 |
0 |
0.0 |
1 |
2 |
0 |
0.0 |
| PetroscfrresnaWOWS |
4.1 |
7.0 |
5.4 |
9.3 |
0 |
0 |
0 |
0.0 |
186 |
69 |
87 |
262 |
| Platy belonneargafus |
0 |
0 |
0 |
0 |
0 |
0 |
0 |
0.0 |
16 |
23 |
0 |
0.0 |
| Rom acentrus |
0 |
0 |
0 |
0 |
0 |
0 |
0 |
0.0 |
2 |
3 |
0 |
0.0 |
| Pam ace ntrus sp.2 |
0 |
0 |
0 |
0 |
0 |
0 |
0 |
0.0 |
2 |
3 |
0 |
0.0 |
| Pomacentrus sp.3 |
0 |
0 |
0 |
0 |
0 |
0 |
0 |
0.0 |
2 |
3 |
0 |
0.0 |
| Priacanthus ham rur |
0 |
0 |
0 |
0 |
0 |
0 |
10.7 |
11.6 |
0 |
0 |
0 |
0.0 |
| Pseudoanthias sp. |
0 |
0 |
0 |
0 |
0 |
0 |
212 |
27.4 |
0 |
0 |
0 |
0.0 |
| Sargocentron so. |
0 |
0 |
6 |
4 |
0 |
0 |
8.0 |
92 |
0 |
0 |
0 |
0.0 |
| Scaridae |
0 |
0 |
0 |
0 |
0 |
0 |
8.8 |
152 |
0 |
0 |
0 |
0.0 |
| Sphyraena barracuda |
4 |
6.9 |
0.0 |
0 |
0 |
0 |
0.0 |
0.0 |
3 |
6 |
0 |
0.0 |
| Spratelloidesdelicatulus |
95.9 |
67.7 |
322 |
19.4 |
162.8 |
36.1 |
10.4 |
9.1 |
125 |
64 |
63 |
54.1 |
| Syngnathidae |
0 |
0.0 |
0.0 |
0.0 |
0.0 |
0.0 |
0.0 |
0.0 |
19 |
8 |
0 |
0.0 |
| S:modontidae |
0 |
0.0 |
0.0 |
0.0 |
1.7 |
22 |
0.0 |
0.0 |
0 |
0 |
0 |
0.0 |
| Tetraodontidae |
0 |
0.0 |
62 |
5.4 |
0.0 |
0.0 |
0.0 |
0.0 |
0 |
0 |
0 |
0.0 |
| Trach in otussp |
0 |
0.0 |
0.0 |
0.0 |
0.0 |
0.0 |
0.0 |
0.0 |
3 |
6 |
0 |
0.0 |
| Tripterygiidae |
0 |
0.0 |
0.0 |
0.0 |
0.0 |
0.0 |
7.3 |
12.7 |
18 |
11 |
3 |
5.4 |
| Uindentified |
0 |
0.0 |
0.0 |
0.0 |
0.0 |
0.0 |
11.1 |
192 |
22 |
38 |
5 |
8.6 |
| Vinciquerriamabahiss |
0 |
0.0 |
62 |
5.4 |
0.0 |
0.0 |
184.9 |
55.5 |
6 |
7 |
2 |
2.8 |
Table 3: Taxa of different fish varieties.
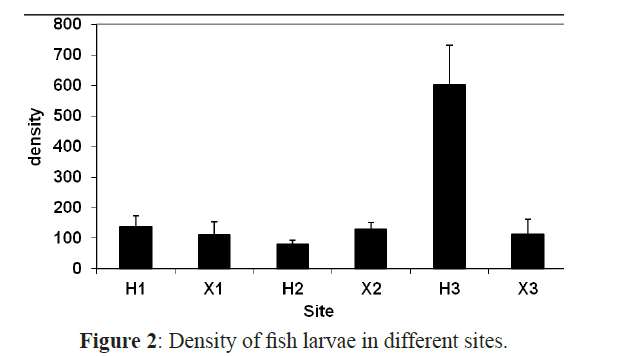
Figure 2: Density of fish larvae in different sites.
Fish larvae peaked from May to July with the highest values in May (1980 1000 m-3) and June (1475 1000 m-3) and there was another small increase in December whereas the minimum number of fish larvae was found in March (123 larvae 1000 m3). The highest number of individuals was recorded at H3 in May and June. There were no larvae present at the offshore sheltered site H1 in March, June, July and August and the offshore exposed site X1 in October and November, and H2 in August and September and the offshore exposed site X2 in November and they were absent from the inshore exposed site X3 in January (Figure 3). Chi squared test showed a strong association between the exposure and the proximity to the shore and a significant difference in abundance and diversity in each site.
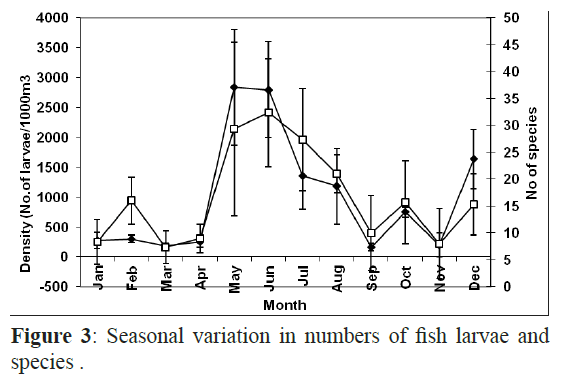
Figure 3: Seasonal variation in numbers of fish larvae and species .
Diversity
Larvae of 49 taxa belonging to 11 orders and 36 families of fish were identified. The most diverse order was the Perciformes that contained 19 families and 28 taxa. Most larvae could be identified either to the family, genus or species level although some larvae could not be identified at all. The 10 most abundant taxa, Atherinomorus lacunosus, Hypoatherina temmincki, Spratelloides delicatulus, Enneapterygius sp., petroscirtes mitratus, Mulloides flavolineatus, Gerres oyena, Exocoetidae, Hyporhamphus gamberur and Abudefduf saxatilis, formed more than 90% of all collected larvae (Figure4). The first and second most abundant the Atherinids Atherinomorus lacunosus and Hypoatherina temmincki (family Atherinidae) that formed 54.5% and 9.9% of all larvae, respectively dominated all sites. Many species were rare in the present collection including Pomacentrus spp. (Pomacentridae), Pempheris vanicolensis (Pempheridiidae) and the boxfish Ostracion cubicus (Ostraciidae) with only 0.02% of all larvae. Three species, A. lacunosus, H. temmincki and S. delicatulus were more abundant at the sheltered than the exposed sites (F=4.5 (P< 0.05) whilst the larvae of Mulloides flavolineatus, Vinciguerria mabahiss and Benthosema pterotum were more abundant in the exposed than the sheltered sites (F=18.7, p<0.05).
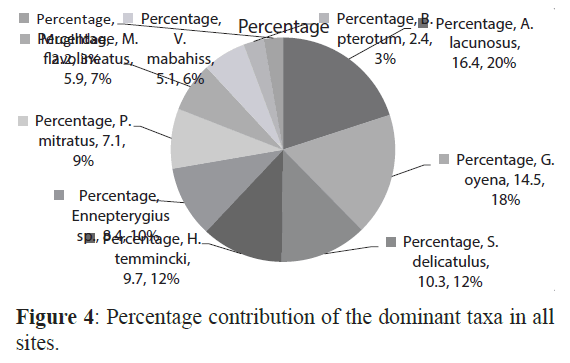
Figure 4: Percentage contribution of the dominant taxa in all sites.
The number of taxa in general showed a significant difference among sites (χ2= 47.870, P <0.01) and among months (F=3.497, P<0.01). The sheltered inshore site (H3) had the highest number of taxa (30) followed by X2 and X1 with 24 and 17 taxa, respectively (Figure 5). The lowest number of taxa was recorded at H1 and H2 with only 6 and 7 taxa, respectively. The late spring and summer months, May, June, July and August had the highest number of species with a peak in July (26 taxa). Whereas, January and November had the lowest number of taxa with 5 taxa each (Figure 2).
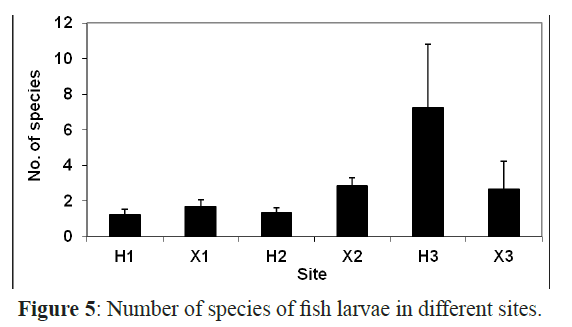
Figure 5: Number of species of fish larvae in different sites.
There were significant differences in the species richness in inshore and offshore sites (F=2.594, P<0.05) and some taxa such as Scaridae, Labridae, Acanthuridae and Priacanthidae were found to be site dependent as they were restricted to either inshore or offshore sites. The larvae of 17 taxa were restricted to the offshore sites and 18 taxa were restricted to the inshore areas whereas 13 taxa were collected from both sites. These taxa were the most abundant and constituted 84% of all larvae in the inshore areas and 68% in the offshore areas.
The Margalef’s index (species richness ranged from the lowest (0.4) at H1 to the highest at H3 and X3 (2.4). The highest richness values were recorded in July and June with 2.4 and 2.1, respectively (Figure 6). The evenness was very high at H1 and X3 and was low in H3. Species in September and February had almost the same density with evenness value of 0.9 in the two months while the fish larval populations in January and December were dominated by one or a few species as indicated by the lowest evenness values. The Shannon-Wiener diversity index was maximal in July (1.92) followed by May, August and June and minimal in November (0.74) (Figure 7).
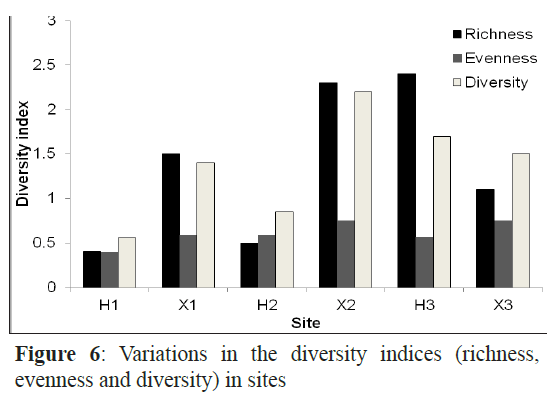
Figure 6: Variations in the diversity indices (richness, evenness and diversity) in sites
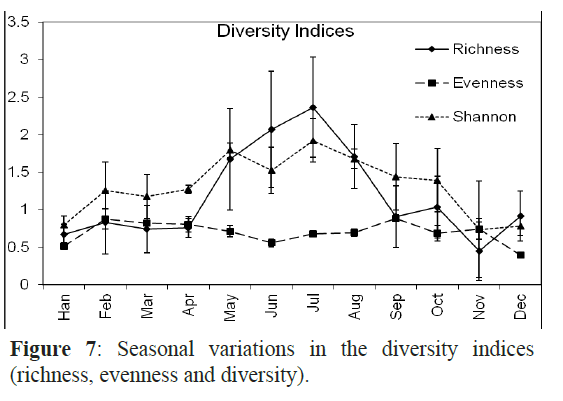
Figure 7: Seasonal variations in the diversity indices (richnesSse,a esovneanl nvearsisa taionnds dini vtheer sdiitvye)r.sity
Inshore larval assemblage was dominated by larger larvae than the offshore assemblage (average larval sizes of 8.3 mm and 5.2 mm respectively). The largest larva in the collection was Hyporhamphus gamberur of 32 mm that was collected from H3 and the smallest larva was Gerres oyena of 2.3 mm. In the offshore sites, the largest larvae were Atherinmomrus lacunosus (25mm) and the smallest was Acanthurus sp. with 1.8 mm. The analysis of the combined data of size range of larvae collected from inshore and offshore on one hand and from sheltered and exposed sides of the reefs indicated that most of larvae collected from the exposed sides are small and in the preflexion stages comparing to their relatives in the sheltered sides. The sheltered sides of each reef had about 62% of all larvae whereas the exposed sites had only 38% and the larvae inside the reef were larger than those outside the reef (Figures 8 and 9).
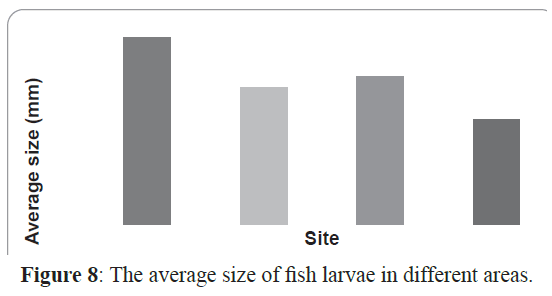
Figure 8: The average size of fish larvae in different areas.
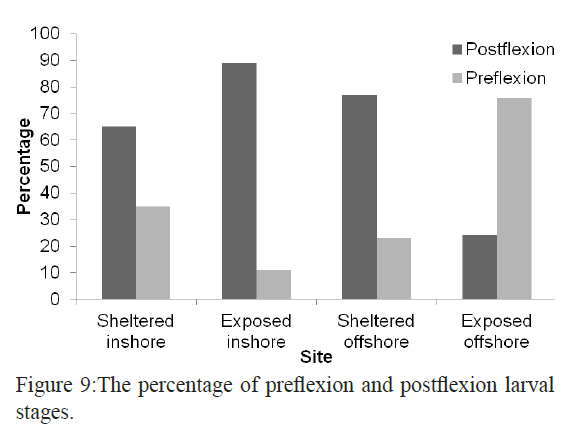
Figure 9: The percentage of preflexion and postflexion larval stages.
In the offshore sites, there were regional and seasonal differences in both abundance and number of species and the exposed sides are highly significantly different from the sheltered sides (F=5.379, P<0.05). The density in the offshore sites (Giftun islands) varied from the lowest in March to the highest in December. The evenness values were very low (0.37) in December. Larvae offshore were also abundant in July and August where many taxa were abundant with the evenness value (0.92).
At the inshore site, the abundance at the sheltered side (H3) is significantly different from that of the exposed site X3 (F=9.71, P<0.05). This site showed the highest density and diversity among all sites. Larvae of 23 families and 30 different taxa of fish were collected forming 84% of all fish larvae caught inshore. The evenness values showed that H3 was richer than X3 with Margalef’s index 3.8 and 1.4 for H3 and X3 respectively. The overall density of fish larvae was 1161 individuals 1000 m-3 and the highest density occurred in May followed by June. The lowest density occurred in January.
There was a significant difference between sheltered and exposed sides at coastal sites for individuals (F =11.07, P<0.001) and species (F=7.38, P<0. 01) and January and May data are significantly different from all other months (F=3.132, P<0.05). The seasonal variations inshore showed that larvae of Atherinidae occurred all over the year whereas larvae of Diodon hystrix, Ostracion cubicus and Trachintous species were collected only in May.
Discussion
The present study complements the very few studies on the ichthyoplankton of the coral reef fishes in the Red Sea: southern Red Sea (Nellen, 1973), Sharm El-Sheikh (Abu El-Regal, 1999), Hurghada (Abu El-Regal, 2008) and Aqaba (Faroukh, 2001). All of these studies aimed to identify the larval fishes in the studied area and to provide data on the density and seasonality of the larvae. Despite differences due to the methods of sampling, the present study confirmed the highest abundance of fish larvae was recorded from May to August. This agrees with previous reports for the northern Red Sea that larvae of coral reef fishes peaked in the warmer seasons of the year (El-Sherbiny, 1997; Cuschnir, 1991; Abu El-Regal, 1999; Faroukh, 2001; Abu El-Regal, 2008). More minor density and diversity differences between the areas may be due to the method of sampling and the gears used.
More fish families (36) were collected during the present study than those from Aqaba (25) and Sharm El-Sheikh (32). Although the lowest number of families was found in Aqaba, more taxa were identified (74) because most of species belonged to families Apogonidae and Pomacentridae that contained 23 and 17 taxa respectively. Some taxa absent from Aqaba or Sharm El- Sheikh samples were recorded in Hurghada and the vice versa. Larvae of Pomacanthidae, Scaridae, Microdesmidae, Gerridae and Engraulidae were collected from Hurghada only. Of the most abundant families in Aqaba, Clupeidae, Pomacentridae, Apogonidae and Gobiidae, only clupeid larvae were abundant in the present collection. Slight differences in the species composition and density of fish larvae are found between Sharm El-Sheikh and Hurghada collections because of the similar environmental conditions. As the plankton net was of 0.5 mm mesh size, most larvae were small and preflexion compared to the larger larvae collected from Jordanian waters by light trap (Farouhk, 2001). Larger larvae of Clupeidae, Pomacentridae, Apogonidae and Gobiidae are photopositive and so more likely to swim into the trap than smaller larvae (Choat et al.1993). The plankton net used in the present work collected only two apogonid and a few pomacentrid larvae
The offshore sites were characterized by a number of fish families that were not recorded in the inshore sites: Scaridae, Acanthuridae, Holocentridae, Serranidae, Pomacanthidae, Lutjanidae, Microdesmidae, Synodontidae and Priacanthidae. The majority of these were coral reef fishes and were collected from the exposed sites in summer months where the average surface water temperature in Giftun Islands was 27.35ºC. Larvae of Microdesmidae and at least one species of Synodontidae were recorded in winter where the temperature was 21.5ºC. Most of these fishes are pelagic spawners and the larvae were generally small and most of them were in the preflexion stage. In the sheltered offshore sites, larvae of 9 families containing 10 taxa were found.
Larvae of 29 taxa belonging to 23 families were recorded at the exposed offshore sites of which 24 taxa were collected from X2. The most abundant taxa were A. lacunosus, Enneapterygius sp., V. mabahiss, M. flavolineatus and H. temmincki. It is clear that site X2 is more diverse than site X1 with 23 species being recorded compared to 16 species at site X1.
The majority of fish larval species present in the area are also recorded as adults. About 21% of the adult fish species recorded have their larval stages in the area while very few taxa were found only as larvae (Abu El-Regal, unpublished data). Bellwood and Wainwright (2002) stated that 281 species in 40 fish families are known to be reef fishes in the Red Sea. Larvae of 25 coral reef fish families were collected in the present study, of which, 16 families were taken inshore and 22 were taken offshore. Most notably, although taken as adults in the area, 15 families do not have larvae in the area. Young et al.(1986) similarly recorded 40 fish families as adults in the North West continental shelf of Australia but did not find their larvae in the area. Hence the inshore larval assemblages may not necessarily be representative of the adult fish assemblage. Larvae of many taxa of reef fishes were missing inshore (Miller, 1974, 1979; Watson & Leis, 1974) and Leis (1994) considered it possible that pelagic larval coral reef fishes disperse from their natal reef. Many of the missing reef fish larvae inshore can be found 5-12km offshore (Leis & Miller, 1976). Some species, such as that of families Chaetodontidae, Scaridae and Lutjanidae have a very short planktonic life and a rapid metamorphosis to adult, and settle to the bottom after hatching (Lowe-McConnell, 1979). Some species of Apogonidae and Pomacentridae produce demersal eggs that are attached to the substratum and the larvae never enter the pelagic life (Munro et al.1973). Visual census techniques have shown apogonid and pomacentrid larvae hidden among branches of Acropora corals (personal observation). This may explain the rarity of these fishes in the current samples. Pomacanthid larvae are very rare in the present collection as only two larvae were collected from Giftun Island in July. Chaetodontid larvae were missing from Hurghada (present data), Arabian Gulf (Houde et al.1986) and Sharm El-Sheikh (Abu El-Regal, 1999).
Larvae of many commercial fishes were collected during the present study. Families such as Mullidae, Lutjanidae, Scaridae, Carangidae, Sphyraenidae, Gerridae and Serranidae are represented in the current samples by larvae indicating nearby spawning grounds. This study presents important information on the spawning seasons and spawning grounds of these fishes that form a baseline data concerning the larvae of commercial fishes as essential part in fisheries management. However, the larvae of some fishes whose adults are important constituents of Egyptian fisheries were rare or even absent in the collection. This may be due to the behaviour of the adult or the behaviour of the larvae (Leis, 1991b; Montgomery et al.2001). Larvae of lethrinid fishes were absent in the ichthyoplankton samples during the period of study and other studies in the Red Sea (Abu El-Regal, 1999, 2008, 2009). These fishes may migrate to areas more favourable for spawning (Johannes, 1978).
The present study focuses on the effect of the proximity to the shore and the degree of exposure to wave action on the abundance, diversity and size of larval fish. There are two distinct assemblages of larval distribution (Figure 5) in the present study. Most of the larvae collected from the inshore and offshore sites in the present study were belonging to nearshore fishes. The larvae of nearshore fishes formed about 99.5% and 92% in inshore and offshore sites respectively.
The inshore assemblage was composed mainly of larvae that hatched from demersal spawners and the offshore had most larvae hatched from pelagic eggs. There is evidence of reef fish being retained nearshore and that the fish larval assemblages inshore are dominated by larvae from demersal spawners (Leis, 1978; Leis 1982; Suthers et al.1991; Leis and McCormic, 2002; Paris and Cowen, 2004)). Leis (1982) showed that dominance by larvae of demersal spawners in inshore waters was due to a few species– primarily tripterygiid, schindleriid and gobiid larvae. In the present study, this dominance was due to the highest densities of atherinid, blennid and hemirhamphid larvae. In the offshore waters of Oahu, Clark (1991) found that larvae from the pelagic spawners dominated the collection and that from demersal spawners were rare or completely absent. Smith et al. (1987) reported that inshore areas adjacent to deep waters in the Caribbean were dominated by clupeids, blennids and gobiids.
The composition and distribution of fish larvae are influenced by environmental factors such as temperature and salinity (Houde and Zastrow, 1993; Hernandez-Miranda et al.2003). There were no significant differences in salinity and temperature between the sites but there was a significant difference in temperature between seasons (F=90.6 P<0.05). Hence temperature may influence the temporal but not the spatial distribution of fish larvae in Hurghada area. The highest catch and taxon richness of fish larvae were related to high temperatures in the area and the summer months.
Indo-Pacific coral reefs, including the Red Sea, have a complex topography, hydrography and biota. The structural complexity of coral reef provides a variety of habitats most of which support fish larvae (Leis, 1991a). However, in the present study, the topography and complexity of the reef differ from site to site with highest coral cover recorded offshore in X2 (70% coral cover). Prior to the present study, little was known about the influence of exposure on the species composition and distribution of fish larvae. Miller (1979) identified windward-leeward differences in larval distribution based on surface tows and considered the differences might be related to an assumed, taxon-specific vertical distribution of larvae but thought that hydrography was the major determinant. Similarly, Leis (1991a) found strong windwardleeward differences in larval abundances and assemblages in the immediate vicinity of the reef. In the present study, the distribution between sheltered and exposed sides of the reef has two distinct patterns. In the inshore sites, larvae were more abundant and diverse in the sheltered side than the exposed side. In contrast, the offshore sites had larger numbers of larvae and species in the exposed sides compared to the sheltered sites. Many larval fish taxa were recorded only from the exposed side of the reef and larvae of Holocentridae, Priacanthidae, Scaridae, Pomacanthidae, Lutjanidae, Callionymidae, Microdesmidae, Serranidae and Engraulidae were never collected from the sheltered side. Most larvae collected from the offshore exposed sites hatched from pelagic spawners whereas the majority of fish larvae in the offshore sheltered sites hatched from demersal eggs. Brooders were rare in X2, abundant in H2 and H3 and totally absent from the other sites (Figure 6). These differences of the larval community structure in both sides may be due to the topographic conditions in the different sites (Table I) and the spawning behaviour of the adults.
This study has shown the distributional patterns of the larvae of coral reef fishes that help to understand the interrelationships among fish species during their larval stages and to understand the adult spawning patterns in Hurghada waters. Such information is important for fisheries management although further studies are required to understand the patterns of dispersal of fish larvae in the area, for example, on the vertical distribution of the larvae and the interaction with the physical processes in the area.
Acknowledgments
Without the help of many people, this work could not be adequately completed. The authors would like to thank the National Institute of Oceanography and Fisheries for funding a part of this work. We would like to appreciate the significant contribution of Red Sea Protectorates rangers in sampling of fish larvae from Giftun islands. Staff of the Institute of Estuarine and Coastal Studies of the Biological Sciences Department in Hull University, UK offered a lot of facilities and support during the examination of fish larvae, analysis of data and writing of the manuscript. The authors want to thank Dr. Krysia Mazik for her kind help in the analysis of data.
8187
References
- Abu El-Regal, M. A. (1999).Some biological and ecological studies on the larvae of coral reef fishes in Sharm El-Sheikh (Gulf of Aqaba-Red Sea). M.Sc. Thesis. Mar. Sci. Dept. Fac. Sci. Suez Canal University.Unpublished
- nAbu El-Regal, M. A. (2008). Ecological studies on the ichthyoplankton of coral reef fishes in Hurghada, Red Sea, Egypt. PhD thesis.Mar. Sci. Dept. Fac. Sci. Suez Canal University.pp. Unpublished
- nAbu El-Regal. 2009.Spatial distribution of larval fish assemblages in some coastal bays along the Egyptian Red Sea coast. J. Egypt. Acad. Soc. Environ. Develop., 10 (4): 19-31
- nAhlstrom, E. H. (1971). Kinds and abundance of fish larvae in the eastern tropical Pacific, based on collection made on EASTROPAC I. Fish. Bull. 69(1), 3-77
- nAhlstrom, E. H. (1972). Kinds and abundance of fish larvae in the eastern tropical Pacific on the second multivesselEASTROPAC survey and observations on the annual cycle of larval cycle of larval abundance. Fish. Bull. 70(4), 1153-1242
- nAl-Kholy, A. (1964). Red Sea Fisheries.General Egyptian Organization of Aquatic Resources. Cairo. 345 pp
- nBellwood, R. D. & Wainwright, P.C. (2002).The history and biogeography of fishes on coral reefs.In: Sale, P.F. (Ed), Coral reef fishes: dynamics and Diversity in a complex ecosystem. Academic press, San Diego.Pp 5-32
- nBotros, G. A. (1971). Fishes of the Red Sea.Oceanogr. Mar. Biol. Annu. Rev. 9, 221-348
- nChoat, J. H., Doherty, P., Kerrigan, J B.A., Leis, J.M. (1993).A comparison of towed nets, purse seine, and light aggregation devices for sampling larvae and juveniles of coral reef fishes.Fish. Bull. 91, 195-209
- nClarke, T. A. 1991. Larvae of nearshore fishes in oceanic waters near Oahu, Hawaii.NOAA, Technical report NMFS101:1-19
- nCuschnir, A. (1991). Taxonomic diversity, biological and ecological Interspecific Relationships, and Annual cycle of Distribution of Ichthyoplankton in the Northern end of the Gulf of Elat (Red Sea). Ph.D. Thesis, University of Tel-Aviv,Israel
- nCushing, D. H. (990). Plankton production and year class strength in fish populations: an update of the match/mismatch hypothesis. In: Blaxter, J. H., Southward, A. J. (Eds.), Advances in Marine biology, vol. 26. Academic Press, San Diego, pp. 249-293
- nDebelius, H. (1998).Red Sea reef guide.IKAN-Unterwasserarchiv.Frankfurt. 321 pp
- nDufour, V., Gazlin, R.(1993).Colonization patterns of reef fish larvae to the lagoon at Moorea Island, French Polynesia.Marine Biology progress Series. 102, 143-152
- nDytham, C. (2003). Choosing and using statistics. A biologist’s guide. Blackwell Publishing, Oxford, 248pp
- nEl-Sherbiny, M. M. (1997).Some ecological studies on zooplankton studies in Sharm El-Sheikh area (Red Sea). M. Sc. Thesis. Mar. Sci. Dept. Fac. Sci. Suez Canal University. Egypt. 151pp
- nFaroukh, T. J.(2001). Studies on taxonomy and ecology of some fish larvae from the Gulf of Aqaba. M.Sc. Thesis. Fac. of Graduate Studies.Univ. of Jordan.103 pp
- nGohar, H. A. F (1948). On the relation between fish and anemone with a description of eggs of Amphiprionbicinctus (Rüppell).Publication of the Marine Biological Station, Al-Ghardaqa, Red Sea.6, 35-44
- nGohar, H. A. F. &Latif, F. A. (1959). Morphological studies on the some scarid and labrid fishes. Publication of the Marine Biological Station, Al-Ghardaqa, Red Sea.10, 145-190
- nHernández-Miranda, E., Palm, A.T., Ojeda, E. P. (2003).Larval fish assemblages in nearshore coastal waters off central Chile: temporal and spatial patterns. Estuarine and Coastal and Shelf Science 56, 1075-1092
- nHoude, E. D. &Zastrow, C. E. (1993).Ecosystem- and taxon-specific dynamic and energetics properties of larval fish assemblages, Bulletin of Marine Science 53, 290–335
- nHoude, E. D., Almatar, S., Leak D. C. & Dowd, C. E. (1986). Ichthyoplankton abundance and diversity in the Western Arabian Gulf.Kuwait Bull. Mar. Sci.8,107-393
- nJohannes, R. E.(1978). Reproduction strategies of coastal marine fishes in the tropics.Envir. Biol. Fish. 3, 141-160
- nLeis, J. M.(1986).Vertical and horizontal distribution of fish larvae near coral reefs at Lizard Islands, Great Barrier reef.Marine Biology.90:505-516
- nLeis, J. M.(1991a). The pelagic stage of reef fishes: The larval biology of coral reefs.. In: Sale, P. F. the ecology of fishes on coral reefs. Academic press, INC. Pp 183-230
- nLeis, J. M.(1991b).Vertical distribution of fish larvae in the Great Barrier Reef lagoon, Australia.Marine biology.109, 7-166
- nLeis, J. M.(994) Coral Sea atoll lagoons: closed nurseries for the larvae of coral reef fishes. Bull. Mar. Sci. 54(1), 6-227
- nLeis, J. M. & McCormick, M. I. (2002). The biology, behaviour, and ecology of the pelagic larval stage of coral reef fishes. In: Sale, P.F. (Ed), Coral reef fishes: dynamics and Diversity in a complex ecosystem. Academic press, San Diego.Pp 171-199
- nLeis, J. M. & Miller, J. M. (1976). Offshore distributional patterns of Hawaiian fish larvae. Marine Biology 36(3), 359-367
- nLeis, J. M. (1982).Nearshore distributional gradients of larval fish (15 taxa) and planktonic crustaceans (6 taxa) in Hawaii.Marine Biology. 77, 89-97
- nLeis, J. M. (1993).Larval fish assemblages near Indo-Pacific coral reefs.Bulletin of Marine Science.53(2), 362-392
- nLeis, J. M., D. Rennis, S. (1983).The larvae of Indo-Pacific coral reef fishes. New South Wales Univ. Press, Sydney, Australia.269 pp
- nLeis, J. M., Hay, A. C., Trnski, T. (2006).In situ ontogeny of behaviour in pelagic larvae of three temperate, marine, demersal fishes.Mar. Biol. 148, 655-669
- nLeis, J. M., Trnski, T. (1989).The larvae of indo-pacific shorefishes. Honolulu, Hawaii. University of Hawaii. 371 p
- nLeis, J. M.; B. M. Carson-Ewart.(2002). Larvae of Indo-Pacific coastal fishes.An identification guide to marine fish larvae.(Fauna Malesiana Handbooks 2). E. J. Brill, Leiden, 850 pp
- nLeis, J.M. & B. Goldman.(1987). Composition and distribution of larval fish assemblages in the Great Barrier Reef Lagoon near Lizard Island, Australia.Australian Journal of Marine and Freshwater Research 38(2), 211-223
- nLowe-McConnell, R. H. (1979). Ecological aspects of seasonality in fishes of tropical waters.Symp. Zool. Soc. London 44, 219-241
- nMiller, J. M. (1974). Nearshore distribution of Hawaiian marine fish larvae: effects of water quality, turbidity and currents. In: “the early life history of fish” (J. H. S. Blaxter, ed), pp. 217-231. Springer-Verlag, New York
- nMiller, J. M., (1979). Larval fish distribution. In” an atlas of common nearshore fish larvae of the Hawaiian Islands” (J.M. Miller, W. Watson and J.M. Leis), Misc. rep. 80-02,pp 105-152. Univ. of Hawaii Sea Grant program, Honolulu, Hawaii
- nMontgomery, J. C., Nicholas, T.,&Haine, O.S. (2001).Active habitat selection by presettlement reef fishes.Fish and Fisheries, 2, 261-277
- nMunro, J. L.; R. Thompson; V. C. Gaut.(1973). The spawning seasons of Caribbean reef fishes. J. Fish. Biol. 5:69-84
- nNellen, W. (1973).Kinds and abundance of fish larvae in the Arabian Sea and the Persian Gulf In: B. Zeitzschel. Ed. The biology of the Indian Ocean. New York. 523 pp. Verlag.415-430
- nNonaka, R. H., Matsuuru, Y., Suzuki, K. (2000). Seasonal variation in larval fish assemblages in relation to oceanographic conditions in the Abrolhos Bank region off eastern Brazil.Fish. Bull. 98, 767-784
- nOrmond, R. F. Edwards, G. A. (1987). Red Sea Fishes. Red Sea (Key Environments) (eds. By A. J. Edwards and S. M. Head), pp. 251-287. Pergamon Press, Oxford
- nParis, C. & Cowen, R. k. (2004). Direct evidence of biophysical retention mechanism for coral reef fish larvae.Limnology and Oceanography49, 1964-1979
- nRandall, J. (1986). Red Sea Reef Fishes. IMMEL Publishing, London. 192 pp
- nSale, P. F. (1980). The ecology of fishes on coral reefs.Oceanogr. Mar. Biol. 18, 367-421
- nSmith, C. L., Tyler, J. C. &Stillman, L. (1987). Inshore ichthyoplankton: a distinctive assemblage? Bull. Mar. Sci.41, 432-440
- nSponaugle, S., Cowen, R. K., Morgan, S. G., Leis, J. M., Pineda, J., Boehlert, G. W., Kingsford, M. J., Lindeman, K. C., grimes, C., Munro, J. L. (2002). Predicting self-recruitment in marine populations: biophysical correlates and mechanisms.Bulletin of marine Science70, 341-374
- nSuthers, M. & Frank, K. T. 1991.Comparative persistence of marine fish larvae from pelagic versus demersal eggs off south-western Nova Scotia, Canada.Mar. Biol. 108, 175-184
- nVictor, B. 1987. Growth, dispersal, and identification of planktonic labrid and pomacentrid reef fish larvae in the eastern Pacific Ocean. Mar. Biol. 95, 145-152
- nWatson, W. & Leis, J. M. (1974).Ichthyoplankton of Kaneohe Bay, Hawaii: A one-year study of fish eggs and larvae. Tech. Rep.-Univ. Hawaii Sea Grant Program TR-75-01, 1-78
- nWatson, W. and J. M. Leis. (1974). Ichthyoplankton of Kaneohe Bay, Hawaii: a one-year study of fish eggs and larvae. Univ. Hawaii Sea Grant Program Technical Report 75-01, 178 pp
- nYoung, P. C., Leis, J. M., &Hausfeld, H. F. 1986.Seasonal and spatial distribution of fish larvae in waters over the North West Continental Shelf of Western Australia.Mar. Ecol. Prog. Ser31, 209-222
- nZar, J. H. 1996. Biostatistical analysis.Fourth Edition. Prentice Hall International (UK), London
