Keywords
Haar Wavelet; Whistle Sounds; Dolphins (Tursiops aduncus); Source Level (SL); Beam Pattern.
Introduction
Passive acoustic monitoring has proven to be a successful tool in identifying the presence of baleen whales, and combined with other datasets (for example, genetics and stable isotope ratios) can be used to infer distribution and migration patterns. The Studies usually be aplicated in captivity and in the field about bioacoustics and marine acoustical method, are therefore important for our understanding of animal echolocation, behavior and how it evolved (Wulandari et al., 2016; Lubis et al., 2016; Moron et al. 2015). The vocalization with the underwater behavior acoustic of dolphins has proved difficult due to the lack of underwater access to animals and life history, sex, and relationship information.
Male dolphins (Tursiops aduncus) have a small groups of dolphins frequently approached in recording platform. Processing in data acquisition was manually initiated when dolphins were observed surface with 100 m of and toward in array. Acquisition lasted until the dolphins had passed the recording platform, interrupted 13 s every minute for data storage. Noise Level (NL) to be measured usually with passive instrument standart is hydrophone (receiving sensitivity 184 dB re 1 μPa/V) was high, up to 60 dB re 1μPa in the measured frequency range 0,2 kHz– 40kHz, probably below this level in the whole frequency range of interest for Tursiops echolocation (up to some 120000 Hz). Ambient noise was broad spectral noise from snapping shrimps (Jensen et al., 2009). The recordings were made with a linear fourhydrophone array (Figure 1). The hydrophones have spaced 1 m apart and aligned by mounting them with an interconnected set of PVC pipes. Hydrophone array was suspended vertically between a surface buoy and a 0.5 kg lead weight, the top hydrophone held at a depth of a few meters. Hydrophones TC4034, RESON, SQ 3 can be connected to a four-channel custom-built amplifier, containing noise rejecting and antialiasing filters (40 dB amplification, onepole high pass filter with 3 dB cutoff frequency in 1000 Hz, and a four-pole low pass filter with 3 dB cutoff frequency of 2000 Hz). This paper describes spectral analyse using haar wavelet and Source Level (SL) for whistle sound of dolphins (Tursiops aduncus).
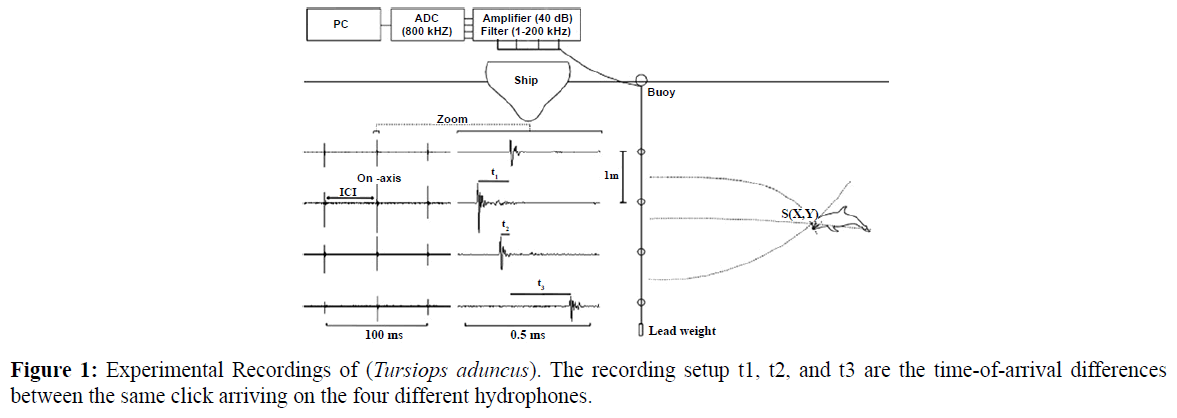
Figure 1: Experimental Recordings of (Tursiopsaduncus). The recording setup t1, t2, and t3 are the time-of-arrival differences between the same click arriving on the four different hydrophones.
Research Method
Whistle source parameters were calculated using equations. Apparent of Source Level (ASL) is defined as the backcalculated sound pressure level in 1 m from the source at an unknown angle from the acoustic axis (Mohl et al., 2000). Calculated using the following equation:
ASL = RL + TL = 20 log R + αR (1)
Power Spectral Density (PSD) function to equalize the number of rows and columns of data matrix m-file in MATLAB of the results of the voice recording process. Power Spectral Density (PSD) is a useful concept to determine the optimum frequency band of the signal transmission system. PSD is a variation of power or energy as a function of frequency spectrum in the form of density estimated using FFT, PSD method is one of the modern spectral estimation technique proposed during this decade (Stoica et al., 1997) Power Spectral value can be obtained equation (2,3 and 4):
 (2)
(2)
 (3)
(3)
 (4)
(4)
Whistles were narrowband, frequency-modulated sounds (Popper et al., 1980). There were at least five different whistle types, categorised according to their spectral contours Figure 2 (Jensen et al., 2009). Whistle type 5 was the only whistle that exhibited harmonics and was therefore placed in a category on its own termed harmonic whistles.
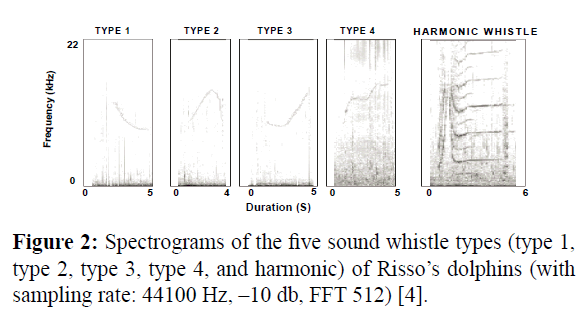
Figure 2: Spectrograms of the five sound whistle types (type 1, type 2, type 3, type 4, and harmonic) of Risso’s dolphins (with sampling rate: 44100 Hz, –10 db, FFT 512) [4].
Haar wavelet basis
Further simplification is a solution can be obtained if in each segment only one collocation point is taken. It is assumed that the highest derivative is constant in each segment. This method is very convenient in the case of nonlinear differential equations, since for each segment only one nonlinear equation should be solved. This method has been applied by (Hsiao et al., 1999).
In 1910 Alfred Haar introduced a function which presents an rectangular pulse pair (Figures 3a and 3b). After that various generalizations and definitions were proposed (state-of-the art about Haar transforms can be found in (Stankovi´c et al., 2003). In 1980 it turned out that the haar wavelet function is in fact the daubechies wavelet of order 1. This enabled to introduce the Haar wavelet, which is the simplest orthonormal wavelet with compact support. It should be mentioned that the Haar wavelet has an essential shortcoming: it is not continuous. In the points of discontinuity the derivatives do not exist, therefore it is not possible to apply the Haar wavelet directly for solving differential equations. The Haar wavelet family for t ∈ [0, 1] is defined as follows:
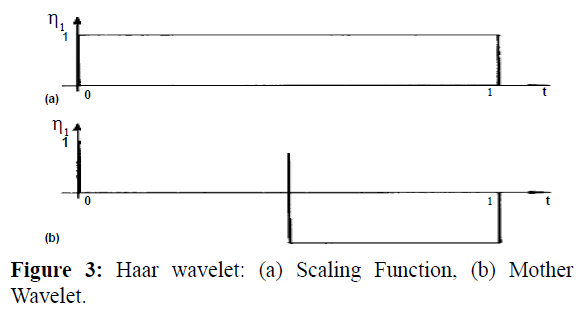
Figure 3: Haar wavelet: (a) Scaling Function, (b) Mother Wavelet.

Haar wavelet family for t ∈ [0, 1] have Integer m = 2j (j = 0, 1, . . . , J) indicates the level of the wavelet; k = 0, 1, . . . m − 1 is translation of parameter. Maximum level of resolution is J. The index i in (1) is calculated according with formula i = m + k + 1; in the case of minimal values is m = 1, k = 0 we have i = 2, maximum value of i is i = 2M = 2j+1. It is assumed that the value i = 1 corresponds to the scaling function for which h1 ≡ 1 in [0, 1] and vanishes elsewhere (Figure 3a).
Let us define the collocation points tl = (l − 0.5)/(2M), (l = 1, 2, . . . , 2M) and discretise the Haar function hi(t); in this way we get the coefficient matrix H(i, l) = (hi(tl)), which has the dimension 2M × 2M. Next the operational matrix of integration P, which is a 2M square matrix, is defined by the equation:
 (6)
(6)
The elements of the matrices H and P can be evaluated according to (1) and (2).
For instance, if M = 2 we find the result is:
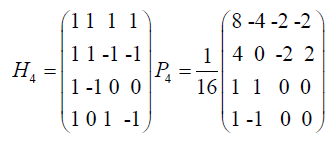 (7)
(7)
Source Level (SL)
Source Level is defined as the sound level at 1 m from the source. In the active sonar equation, Source level is no longer level of the contact or target, but rather the Source Level (SL) of projector from the active sonar system. This source level (SL) is the level (in dB re 1μPa) of the projector, in 1 yard from the object source.
To solve for the source level, we can start with the definition of passive source level by (Urick et al., 1983):

Illustration of experimental research
Illustration of experimental research conducted at park of safari, Cisarua, Bogor Indonesia, with 2 tail of dolphins and ilustration of experimental research showed in Figure 4.
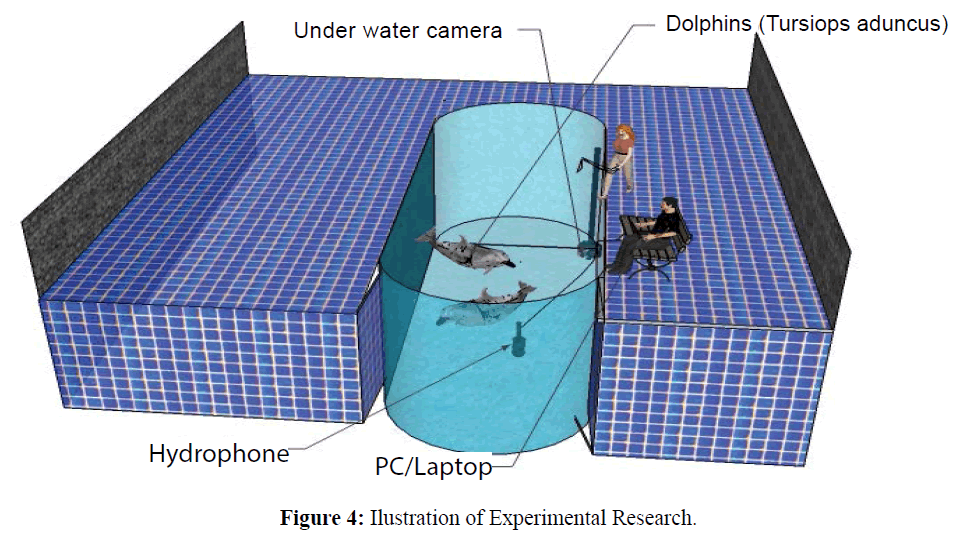
Figure 4: Ilustration of Experimental Research.
Result and Discussions
This study used 4 types of dolphin sounds, much dolphins as two tails. Data recording performed 4 times peremanan which produces whistle 1, 2, 3 and 4. Total duration of each whistle is 0-700 ms on any sound produced. This Research of whistle sound from underwater video and sound recordings made as June 2015 with video cameras (Gopro Hero 3+) and a SQ 3 hydrophone (Passive Acoustic Instrument), frequency to 22 kHz with a –192 dB re 1 μPa. Whistles were assigned to specificated individuals when a dolphin was alone in the camera/hydrophone vicinity, in sole proximity (< 1 m) of the camera/hydrophone, or showed simultaneous bubble emissions correlated with a whistle. Whistles were digitized from audio recordings using Raven Pro 1.5 software (Cornell University, Ithaca, NY, USA) at 44.1 kHz sampling rate ( Whistle 1, 2, 3, and 4). Analysis of Wavelets and Source Level (SL) were run with Matlab R 2008b ( Haar wavelet). Result analysis of Wavelets using Haar wavelet showed in Figures 5-8.
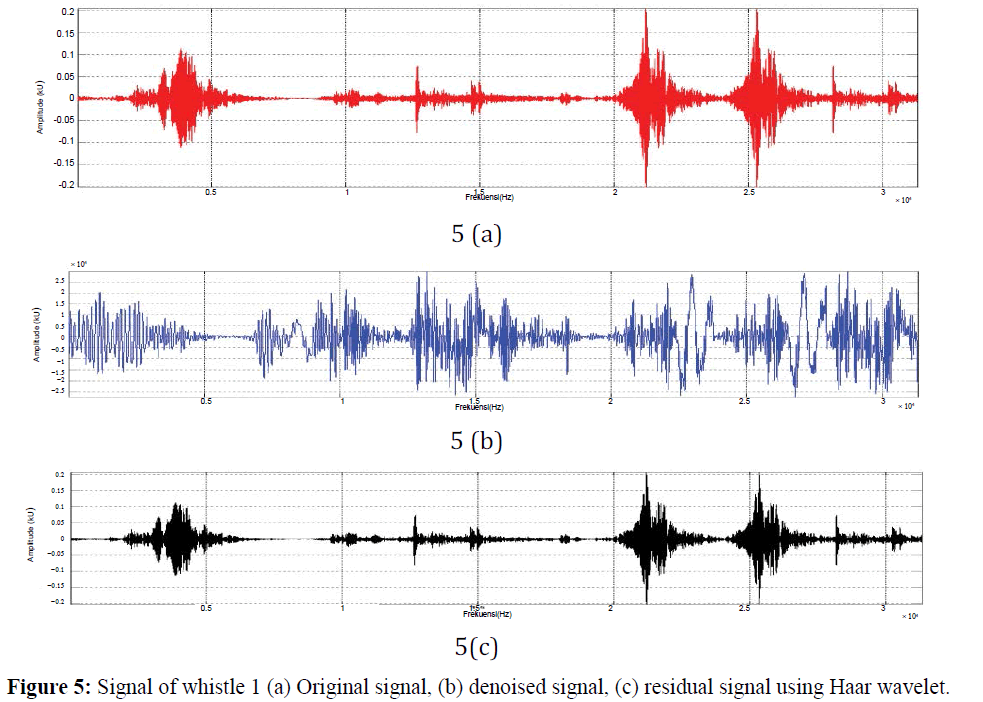
Figure 5: Signal of whistle 1 (a) Original signal, (b) denoised signal, (c) residual signal using Haar wavelet.
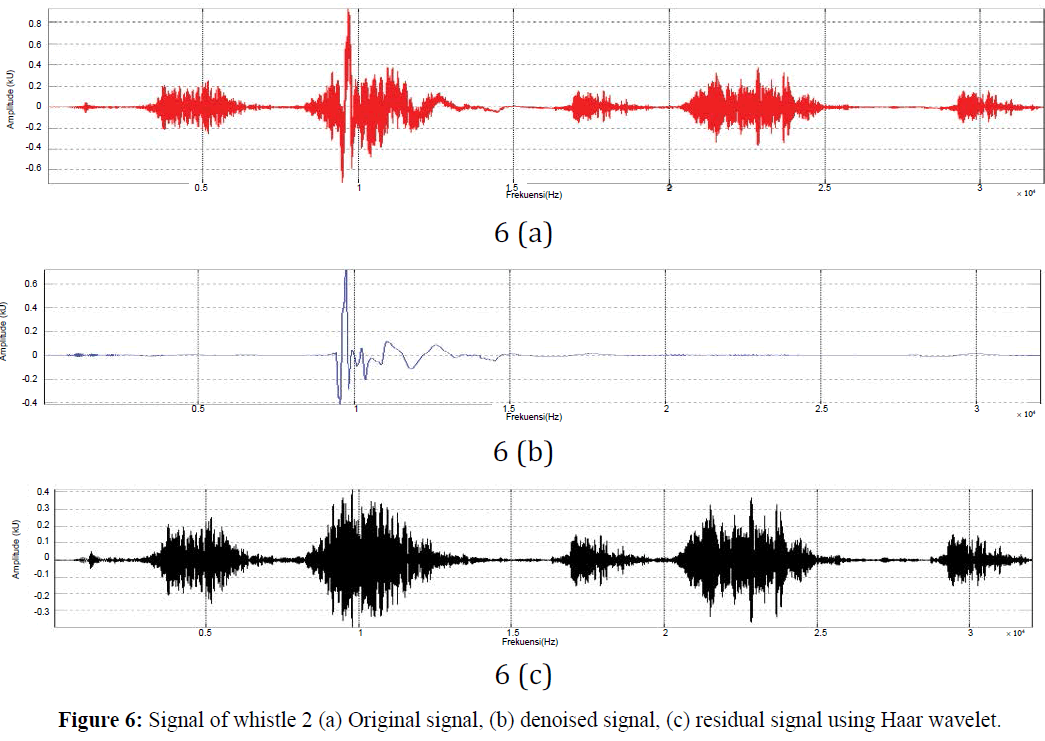
Figure 6: Signal of whistle 2 (a) Original signal, (b) denoised signal, (c) residual signal using Haar wavelet.
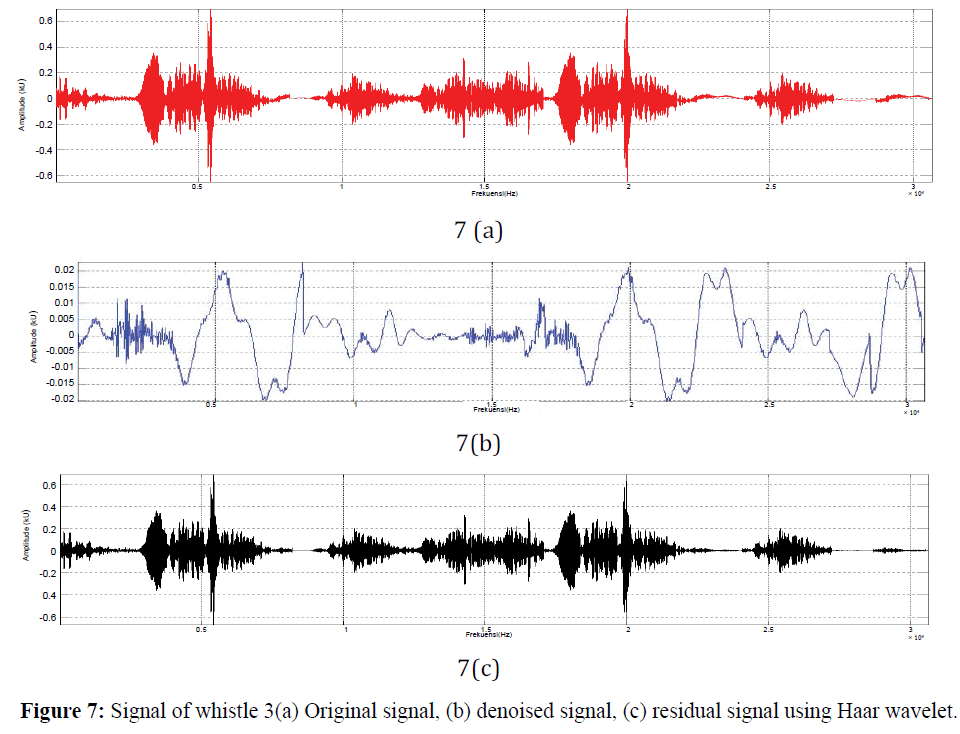
Figure 7: Signal of whistle 3(a) Original signal, (b) denoised signal, (c) residual signal using Haar wavelet.
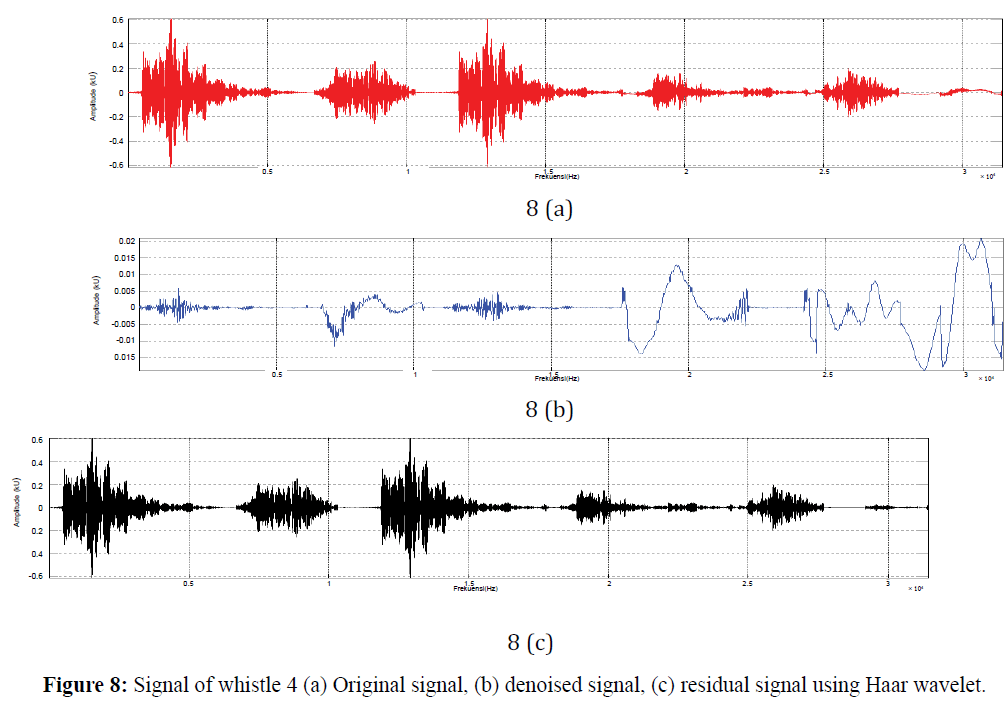
Figure 8: Signal of whistle 4 (a) Original signal, (b) denoised signal, (c) residual signal using Haar wavelet.
Results showed in Figures 5-8 is result of signal processing using the Haar wavelet. Noised highest in first whistle, while the lowest is on a whistle-noised 2. Rated highest of residual signal contained in the second whistle, whistle while the lowest is 1, it shows that the larger the signal denoised result residual signal generated using Haar wavelet, and noised signal will be significantly affect residual values as well as the pattern and duration of the equation matemathics (Stankovi´c et al., 2003; Cattani et al., 2001) Source Level (SL) showed in Figure 9.
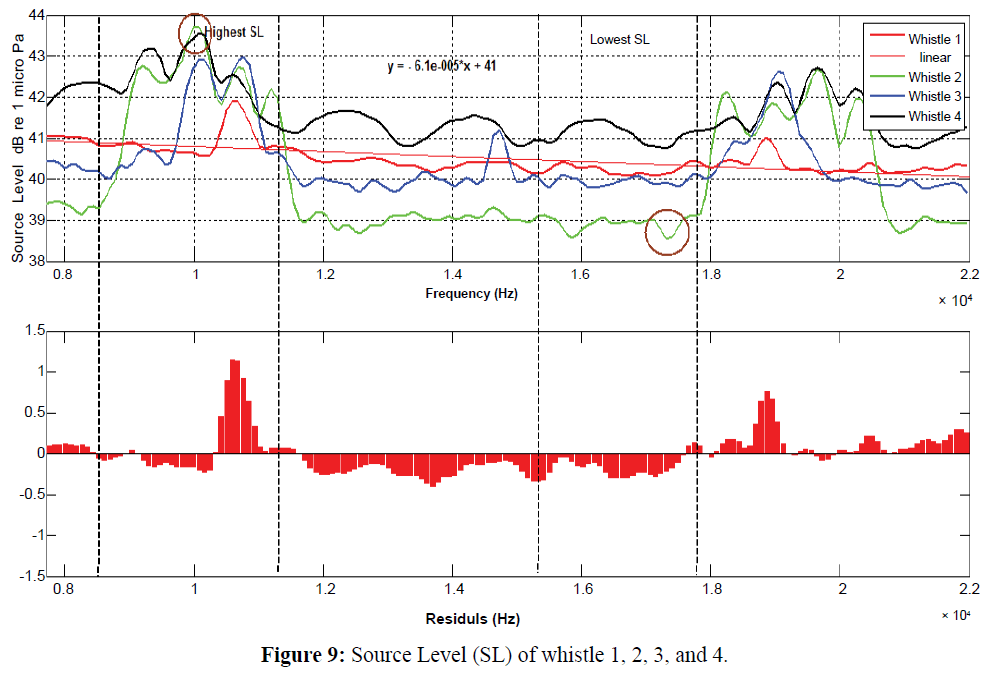
Figure 9: Source Level (SL) of whistle 1, 2,3,and 4.
Source Level (SL) produced by dolphins in quarantine pool with 2 tails of dolphins. Whistle 1 will be showed with red line, Whistle 2 will be showed with green line, Whistle 3 will be showed with blue line, and Whistle 4 will be showed with black line. The highest of Source level value is with frequency range value is 8500 Hz- 11800 Hz, with the highest SL value is 43.9 dB (brown circle). The lowest of Source level with frequency range value is 15700 Hz- 17990 Hz, with a lowest SL value is 38.5 dB (brown circle). Frequency range 11800 Hz – 15700 Hz is mean value from Source Level (SL). Whistle 1, 2, 3, and 4 have a different value SL. SL value was lowest for the second whistle; this is because dolphins are far away from the hydrophones. Distance and volume will affect the value of the resulting frequency in [1] and [2], it can be stated with a different frequency, Source Level (SL) value will be also different from each and other. Physical parameters will affect the value of the frequency and magnitude of the object recorded (Lubis et al., 2014; Lubis et al., 2015).
According in (Bebus Sara et al., 2015) average minimum frequency dolphins sound of whistle is 8090 Hz, the average maximum frequency dolphins sound of whistle is 21030 Hz, it indicates the difference between the minimum frequency dolphins sound of whistle to the research conducted is 10 Hz, and the difference between the maximum frequency of the sound of the whistle is 100 Hz. In the study conducted by (Janik et al., 2000) obtained maximum value Source Level (SL) of the common bottlenose dolphin is 40 dB with a frequency is 12 kHz, this indicates that there are differences in values Source Level (SL) obtained from this study, in this study derive maximum value SL is 29 dB with a frequency is 16 kHz. Value Source Level (SL) conducted in an captivity Taman Safari Indonesia memikili smaller value than studies (Rasmussen et al., 2006; Jakobsen et al., 2013; Lubis et al., 2016), earning the Source Level (SL) is 43.9 dB with a frequency of 10 kHz, this shows the frequency value with the same, but the value Source Level (SL) is different. 3D Figure (Intensity, Frequency, and Time duration) and approach signal in beam pattern showed in Figure 10.
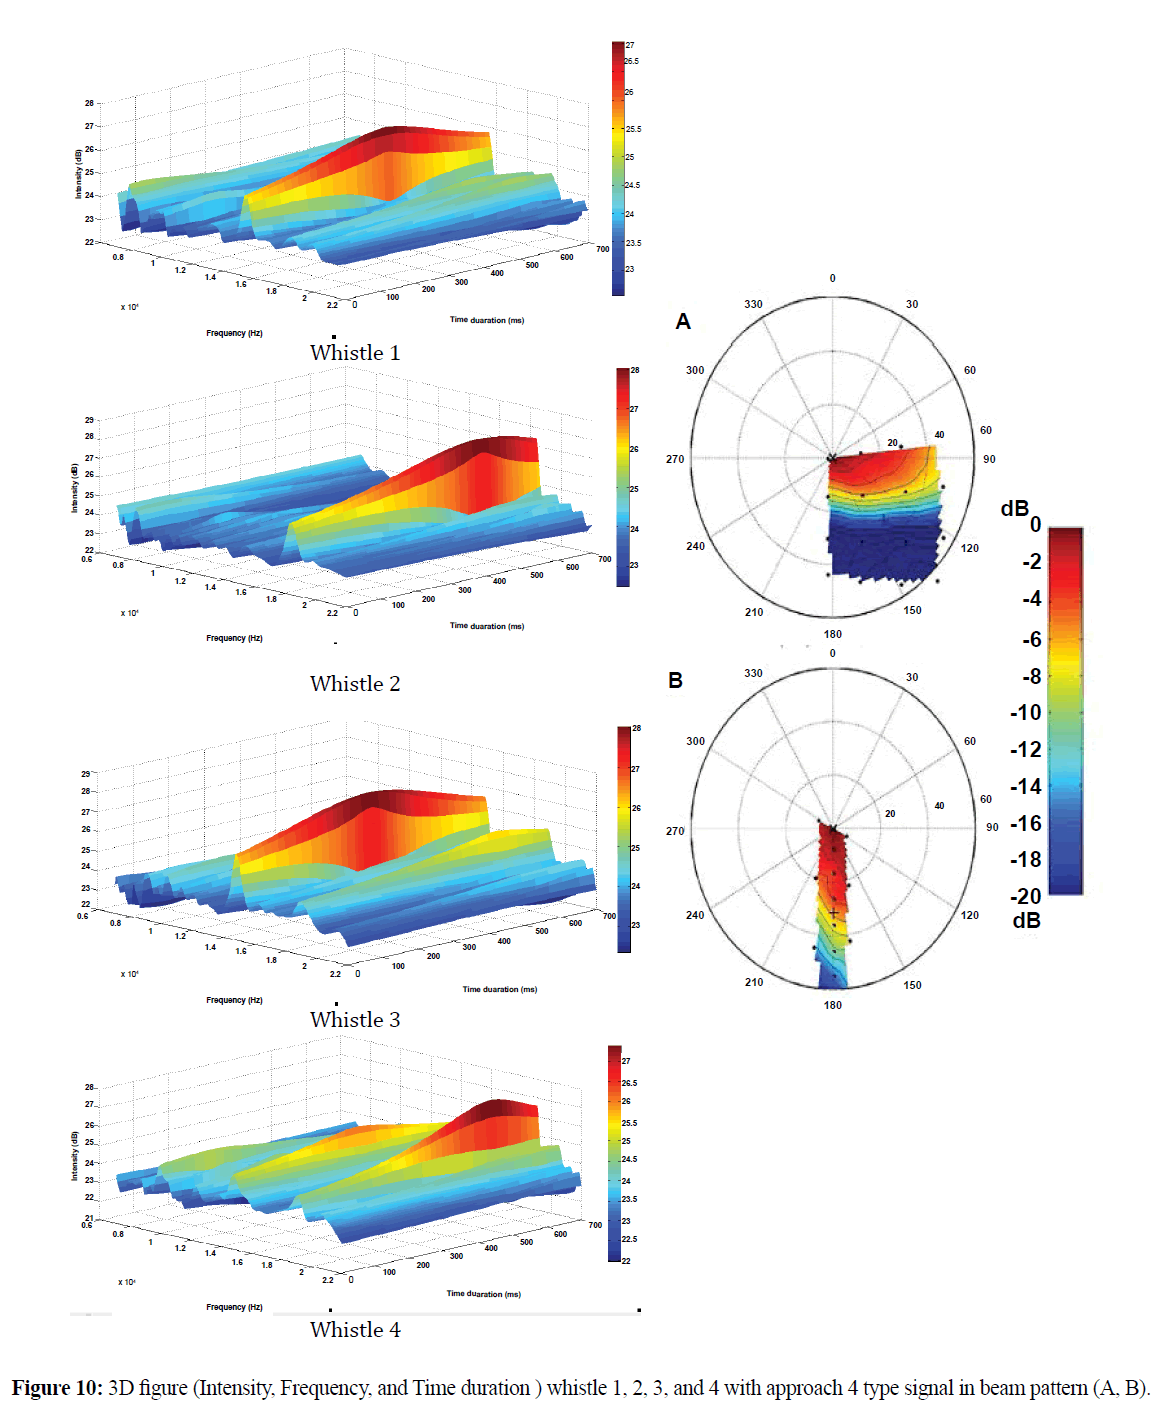
Figure 10: 3D figure (Intensity, Frequency, and Time duration ) whistle 1,2,3,and 4 with approach 4 type signal in beam pattern (A, B).
Conclusions
Signal of dolphin sound (Tursiops aduncus) recording in Park of Safari, Cisarua, Bogor Indonesia have frequency range 8-22 kHz and residual signal contained in the second whistle, whistle while the lowest is 1, it shows that the larger the signal denoised result residual signal generated using Haar wavelet. Each source level value obtained in noise 1,2,3, and 4 have differences with each other (dolphins sound of whistle), it shows the same target but SL value and the sound patterns remain distinct by looking at time duration of whistle sound. Beam pattern with 4 type signal have range value 70 º-180°, with highest intensity values is 60º (showed with red colour in Figure 10).
9871
References
- Wulandari, P.D., Pujiyati, S., Hestirianoto, T., Lubis, M.Z. (2016) Bioacoustic Characteristic Click Sound and Behaviour of Male Dolphins Bottle Nose (Tursiops aduncus). J Fisheries Livest Prod 4, 160
- nLubis, M.Z., Pujiyati,Sri., Hestirianoto,Totok., Wulandari, P.D. (2016) Bioacoustic Characteristics of Whistle Sounds and behaviour of male Indo-Pacific bottlenose dolphins (Tursiops aduncus) in Indonesia. International Journal of Scientific and Research Publications6
- nMoron, J.R., Andriolo, A. (2015) Preliminary evidence for signature and copied whistles among spinner dolphins in the Southwest Atlantic Ocean: Beacon purpose?. The Journal of the Acoustical Society of America, 138, 1904-1904
- nJensen, F. H., Bejder, L., Wahlberg, M.,Madsen, P.T. (2009) “Biosonar adjustments to target range of echolocating bottlenose dolphins,” J. Exp. Biol. 212, 1078-1086
- nMøhl, B., Wahlberg, M., Madsen, P.T., Miller, L.A., Surlykke, A. (2000) “Sperm whale clicks: Directionality and source level revisited,” J.Acoust. Soc. Am. 107(1), 638-648.Reiss, D. (1988). Observations on the development of echolocation in young bottlenose dolphins. In P. E. Nachtigall & P. W. B. Moore (Eds.), Animal sonar (pp. 121-127). New York: Plenum Publishing
- nStoica. P., Moses, R.L. (1997)Introduction to spectral Analysis. New Jersey: Prentice Hall Inc
- nPopper, A.N. (1980)Sound emission and detection by delphinids. In Cetacean behaviour: mechanisms and functions. Edited by L.M. Herman. Johns Wiley and Sons, New York. pp.1-52
- nHsiao, C.H., Wang, W.J. (1999) State analysis of time-varying singular nonlinear systems via Haar wavelets, Math. Comput. Simulat. 51, 91-100
- nStankovi´c, R.S., Falkowski, B.J. (2003) The Haar wavelet transform: its status and achievements, Comput. Elec. Eng. 29, 24-44
- nUrick, R.J. (1983) Principles of underwater sound. New York: McGraw-Hill
- nCattani, C. (2001) Haar wavelet splines, J. Interdisciplinary Math 4, 35-47
- nLubis, M.Z., Pujiyati, S. (2014)The impact of acclimatization of various salinity to againts mortalitas rate and behaviour fish guppy (poecilia reticulata) as a subtitute for fish bait skipjack (katsuwonuspelamis). Jurnal teknologi perikanan dan kelautan4.
- nLubis, M.Z., Pujiyati, Sri. (2015) Influence of Addition of Salt Levels Against Study of Bio-Acoustic Sound Stridulatory Movement Fish Guppy (Poecilia reticulata), pp.01-07. The 1st International Conference on Maritime Development Proceeding
- nBebus Sara, E., Herzing, L. Denise. (2015) Mother-Offspring Signature Whistle Similarity and Patterns of Association in Atlantic Spotted Dolphins (Stenella frontalis) 2, 71-87 Animal Behavior and Cognition
- nJanik, V.M. (2000) Source levels and the estimated active space of bottlenose dolphin (Tursiops truncatus) whistles in the Moray Firth, Scotland.Journal of Comparative Physiology A, 186, 673-680
- nRasmussen, M.H., Lammers, M., Beedholm, K., Miller, L. A. (2006) Source levels and harmonic content of whistles in white-beaked dolphins (Lagenorhynchus albirostris). The Journal of the Acoustical Society of America 120, 510-517
- nJakobsen, L., Brinklov, S., Surlykke, A (2013) Intensity and directionality of bat echolocation signals. Front Physiol 4, 89
- nLubis, M.Z., Wulandari, P.D., Hestirianoto, T., Pujiyati, S (2016) Bioacoustic Spectral Whistle Sound and Behaviour of Male Dolphin Bottle Nose (Tursiops aduncus) at Safari Park Indonesia, Cisarua Bogor. J Marine Sci Res Dev 6, 189.





 (2)
(2) (3)
(3) (4)
(4)


 (6)
(6) (7)
(7)


