Keywords
Procaine; HSA; Binding constant; Protein secondary structure; FT-IR spectroscopy
Introduction
Procaine hydrochloride, 2-(diethyl amino) ethyl p-amino benzoate has the molecular, formula C13H21 ClN2 O2.HCl, and its chemical structure is shown in Figure 1 [1]. It is a local anesthetic drug applied as an injection during surgery or other medical and dental procedures. It functions as a sodium channel blocker to ease the pain and it is known to be a short acting intravenous drug with adverse side effects such as cardiac and neurological toxicity [2]. Other studies on procaine have shown it to increase dopamine and serotonin in the brains of animals [3].
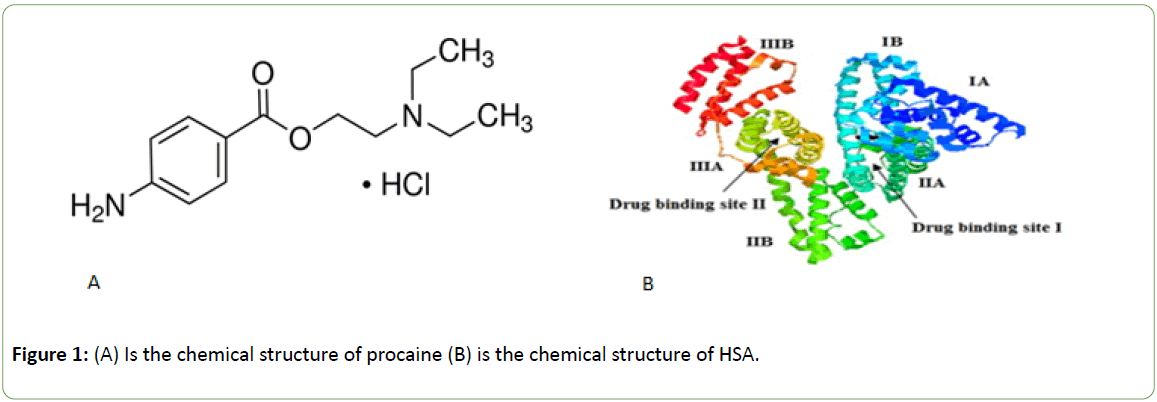
Figure 1: (A) Is the chemical structure of procaine (B) is the chemical structure of HSA.
Human serum albumin (HSA) is composed of three homologous domains (I - III): I (residues 1-195), II (residues (196-383) and III (residues 384-585) and each of which is divided into two subdomains (A and B) and able to bind to a large number of ligands at two main binding sites, identified as site I and site II which are shown in Figure 1B [4-6]. Site I is dominated by strong hydrophobic interaction with most neutral, bulky, heterocyclic compounds, while site II is dominated by dipoledipole, van der Waals, and/or hydrogen-bonding interactions - with many aromatic carboxylic acids [7].
HSA is a single monomeric protein formed by 585 amino acids with 0.6 mM concentration in the blood plasma [8]. HSA has a dominant role in transporting and arranging various compounds such as fatty acids, hormones, tryptophan, steroids, metal ions, therapeutic agents and large number of drugs. HSA is considered as the major solvable protein components of the circulatory system, contributing to colloidal oncotic blood its pressure, binding and transferring poorly soluble drugs in water [9]. A weak drug binding has a short lifetime which is insufficient to provide therapeutic effect, whereas a strong binding reduces the free fraction of drugs with undesirable side effects because of its slow metabolism and excretion [10-13].
Evaluation of mechanisms of interaction of local anaesthetics can provide important information about their storage, transportation, evacuation in the blood makes it possible to predict their pharmacokinetic and pharmacodynamics properties such as the degree and duration of anesthetizing action, the rate of metabolism and/or utilization in peripheral tissues [14-16].
HSA contains a single intrinsic tryptophan residue (Trp 214) in domain IIA and its fluorescence is highly sensitive to the ligands bounded nearby [17-21]. Therefore, it is often used as a probe to investigate the binding properties of drugs with HSA.
Qualitative analysis of chemical binding to HSA can be detected by fluorescence spectra. The excitation wavelength, the emission wavelength, and the fluorescence intensity are the main three parameters used to study the synthetic information of the samples. In addition, the curve spectra can also provide important information. If there is any shift in the excitation or emission wavelength of the spectra, it could be an indication of HSA conformational changes [22].
Fluorescence quenching is formed by either dynamic or static quenching. Dynamic quenching is produced by intermolecular collision between a quencher and fluorescent molecules at an excited state, at which effective collision and the quenching constant should increase with increasing temperature. Usually dynamic quenching does not affect the structure and bioactivity of protein. Static quenching is caused by the intramolecular interaction of quenchers with fluorescent molecules at a ground state, which forms a new complex with changed structures. In static quenching, the constancy of new complexes decreases with the increase in temperature, since high temperatures contribute to molecular diffusion and the detachment of weakly bound complexes. Accordingly, dynamic quenching and static quenching can be distinguished by the impact of temperature change [23].
A considerable amount of scientific research has proven a strong connection between band positions of the IR spectra and changes to the secondary structure of the studied proteins. The energy associated with the observed absorption bands in several proteins are linked to certain molecular vibrations in the secondary structures, such as α helix or β -sheet structures [23-25]. The vital functions of each protein are dependent on the three dimensional structures of its components of peptides and polypeptide.
There are nine IR bands, named amide A, amide B and amides (I -VII), in the order of decreasing frequency [23,24]. Amide I band (1600 -1700) cm-1 with its large intensity, is the most useful for the analysis of the secondary structure of proteins. This band involves mainly C=O stretching vibration [26,27]. The amide II band (1480 1600) cm-1 and amide III band (1220-1320) cm-1 contribute greatly to studies despite of the complex nature of their compositions and can be used for secondary structure prediction [28-30]. The spectra in the region from about (1300-500) cm-1 arise due to complicated combinations of (C-C, C-O, C-N) stretching and bending vibration. This range, referred to as the fingerprint region, is important because each compound produces its unique pattern of peaks.
The aim of the present work is to study the interaction between procaine and HSA. The importance of the study comes from the fact that procaine shows a short duration of action and adverse side effects. It is thus highly important for pharmaceutical sciences to clarify the structure, function, and properties of HSA- procaine complexes. Therefore, procaine’s storage and transportation by proteins in the blood plasma becomes an important issue which requires investigations of the interaction mechanisms and determining the binding constant between procaine and HSA. In order to attain these objectives, UV-Vis absorption spectroscopy, fluorescence spectroscopy and FTIR spectroscopy were employed to carry out detailed investigation of procaine-HSA association.
Material and Methods
Materials
HSA (fatty acid free) and Procaine hydrochloride in powder form, were purchased from Sigma Aldrich chemical company and were used without any further purifications.
Preparation of stock solutions
HSA was dissolved in phosphate buffered saline (80 mg/ml or 1.2 mM). The concentration of HSA in the buffer solution was calculated using its listed molecular weight of 66.5 kDa. Procaine hydrochloride, with the molecular weight of (272.77 g/mol) [28], was dissolved in double distilled water to prepare the following concentration (0.6, 0.8, 1.0, 1.2, 2.0, 2.4, and 4.80) mM. In the final step, each drug solution was added to an equal volume of the protein solution to attain the desired drug concentrations of (0.3, 0.4, 0.5, 0.6, 1.0, 1.2 and 2.4) mM. The solutions of procaine and HSA were incubated for 2 h at 20°C [31] before any further preparations for spectroscopic measurements.
UV-Vis absorption spectra
The absorption spectra were obtained by the use of a Nano Drop ND-100 spectrophotometer. The absorption spectra were recorded for 5 - 10 μL liquid samples of free HSA (40 mg/ml or 0.6 mM) and for its complexes with procaine solutions with the following concentrations (0.3, 0.4, 0.5, 0.6, 1.0, 1.2, and 2.4) mM. Repeated measurements were taken for all the samples and no significant differences were noticed. The UV-absorption spectra of procaine-HSA complex are obtained at the wavelength of 280 nm.
Fluorescence
The following concentrations of procaine-HSA complex (0.3, 0.4, 0.5, 0.6, 1.0, 1.2, and 2.4) mM were prepared for the fluorescence study. The fluorescence measurements were performed by a Nano Drop ND-3300 Fluorospectrometer at 25°C. The excitation source comes from one of three solid-state light emitting diodes (LED's) with excitation source options include: UV LED with maximum excitation 365 nm, Blue LED with excitation 470 nm, and white LED from 500 to 650 nm excitation. A 2048-element CCD array detector covering 400-750 nm, is connected by an optical fibre to the optical measurement surface. The excitation is performed at the wavelength of 360 nm and the maximum emission wavelength is at 440 nm.
FTIR spectroscopic measurements
The FTIR spectra were measured by a Bruker IFS 66/S spectrophotometer equipped with a liquid nitrogen-cooled MCT detector and a KBr beam splitter. The spectrometer was continuously purged with dry air during the measurements. Samples in the form of thin films are prepared after 2 h of incubation of HSA with procaine solution at room temperature, 30 μl of the complex sample were placed on a certain area on a silicon window plate and left to dry in a closed chamber at room temperature. The dehydrated films were formed on one side of a silicon window with different concentrations of procaine keeping the same protein content in all samples. The obtained absorption spectra were kept in the range of (400-4000) cm-1. Each spectrum was obtained by taking the average of 60 scans to enhance the signal to noise ratio, and the spectral resolution was at 4 cm-1. The aperture setting remained at 8 mm during all measurements, because it gave the best signal to noise ratio.
Baseline correction, normalization and peak areas calculations were done for all the obtained spectra by using OPUS software. The peak positions were determined using the second derivative of the spectra and the use of Fourier self-deconvolution technique. The infrared spectra of HSA and the procaine-HSA comple were recorded for the region of (1200-1700) cm-1. The FTIR spectrum of free HSA was acquired by subtracting the absorption spectrum of the buffer solution from the spectrum of the protein solution. For the net interaction effect, the difference spectra {(HSA-procaine)-(HSA)} were generated using the featureless region of the spectra at (1800-2200 cm)-1 as an internal standard [27]. The accuracy of this subtraction method is tested using several control samples with the same protein and drug concentrations, which resulted in a flat base line formation as it should.
The obtained spectral differences were used here, to investigate the nature of the drug-HSA interaction. Silicon windows (NICODOM Ltd) were used as spectroscopic cell windows, 30μl of each sample of HSA-procaine at the following concentrations of (0.15, 0.3, 0.6, 0.7, 0.9) mM was spread on silicon window using spin coater to obtain equal thickness of each sample, and then incubator was used to evaporate the solvent in order to obtain transparent thin film on the silicon window. All solutions were prepared at the same time at room temperature and were stored at the same closed chamber.
Results
UV-Vis absorption spectroscopy
UV-Vis absorption spectroscopy is one of the most common and effective experimental techniques used in calculating binding constants for several drug-protein complexes [32-34]. A complex has formed by the interaction of procaine with HSA as shown from the absorption spectra in Figure 2. The intensity of UV absorption of HSA increased with increasing concentrations of procaine indicating formation of procaine-HSA complex. A small red shift of the absorption peak at 280 is noticed with the increase of procaine concentration most likely due to the complex formation of procaine with HSA.
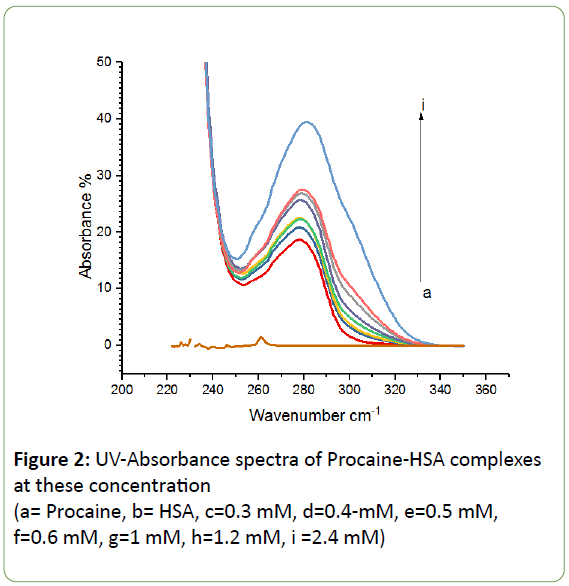
Figure 2: UV-Absorbance spectra of Procaine-HSA complexes at these concentration
(a= Procaine, b= HSA, c=0.3 mM, d=0.4-mM, e=0.5 mM, f=0.6 mM, g=1 mM, h=1.2 mM, i =2.4 mM)
Procaine + HSA ↔ Procaine: HSA (1)
 (2)
(2)
The absorption data were treated using linear reciprocal plots based on the following equation [35].
 (3)
(3)
Where A0 corresponds to the initial absorption of protein at 280 nm in the absence of ligand, A∞ is the final absorption of the ligated protein, and A is the recorded absorption at different procaine concentrations (L). The double reciprocal plot of 1/(AA0) versus 1/L is linear (Figure 3) and the binding constant (K) can be calculated from the ratio of the intercept to the slope, which is found to be 1.115 × 10³ M-1. This binding constant value shows a relatively weak procaine-HSA interaction in comparison to other drug-HSA complexes with binding constants in the range of 105 and 106 M-1 [35-37]. The reason for the weak formation can be attributed to the presence of mainly hydrogen-bonding interaction between protein donor atoms and the procaine polar groups or an indirect drug-protein interaction through water molecules [38].
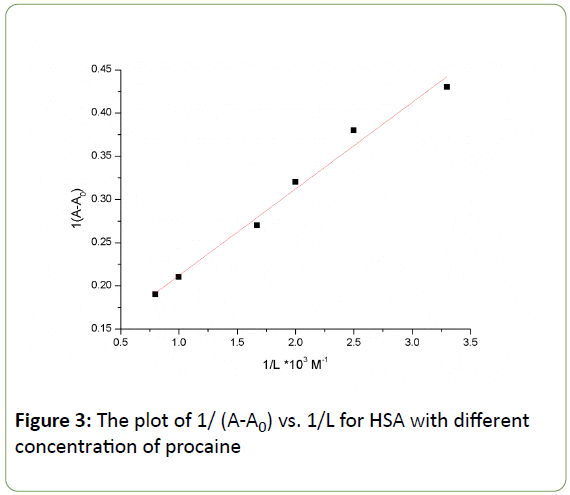
Figure 3: The plot of 1/ (A-A0) vs. 1/L for HSA with different concentration of procaine
Fluorescence Spectroscopy
Fluorescence quenching refers to any mechanism which reduces the fluorescence intensity of a fluorophore. Fluorescence quenching of HSA results from the tryptophan, tyrosine, and phenylalanine residues. The intrinsic fluorescence of HSA is almost due to the contribution of tryptophan alone, because phenylalanine has very low quantum yield and the fluorescence of tyrosine is almost totally quenched if it is ionized or near an amino group, a carboxyl group, or a tryptophan residue [22]. However, in fluorescence spectra studies on protein- drug interactions, the fluorescence intensity of proteins are usually sensitive to interference by ligands or newly produced complexes which exhibit significant fluorescence at or near the chosen excitation or emission wavelengths [39]. The ligand-binding process during protein-ligand complex is mainly governed by four types of weak, noncovalent forces including hydrogen bond, van der Waals force, electrostatic, and hydrophobic interactions [40].
When HSA is excited at 280 nm, it emits strong intrinsic fluorescence at 440 nm which is shown in Figure 4. This phenomenon is due to Trp residue located at the 214th position of the chain and the Try residues in HAS [41,42]. Further, the fluorescence intensity of HSA decreases due to the increase of procaine concentration, while the peak position shows little or no change at all.
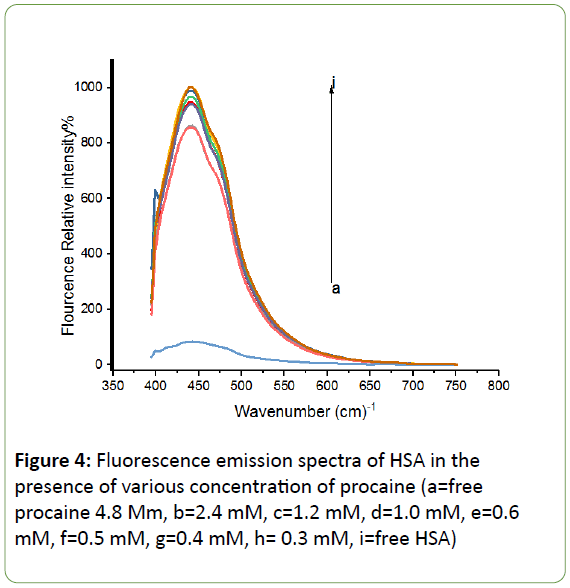
Figure 4: Fluorescence emission spectra of HSA in the presence of various concentration of procaine (a=free procaine 4.8 Mm, b=2.4 mM, c=1.2 mM, d=1.0 mM, e=0.6 mM, f=0.5 mM, g=0.4 mM, h= 0.3 mM, i=free HSA)
The intrinsic fluorescence of HSA is highly sensitive to any slight changes in the local environment of HSA, and becomes obviously weakened by the following factors such as protein conformational transition, bio-molecule binding, and denaturation [43].
The mechanisms of fluorescence quenching are either dynamic quenching or static quenching. Dynamic and static quenching are caused by different means, namely diffusion for dynamic quenching and ground state complex formation for static quenching [38]. In addition, it is known that higher temperatures increase diffusion coefficients leading to an increase in dynamic quenching constants. In contrast, the rise of temperature can decrease the stability of a complex which leads to a decrease in the static quenching constant.
In order to confirm the nature of the quenching mechanism, the fluorescence quenching can be analyzed by the Stern- Volmer equation [44]
 (4)
(4)
Where F and F0 are the fluorescence intensities with and without quencher, kq is the quenching rate constant of the biomolecule, Ksv is the Stern Volmer quenching constant, (L) is the concentration of procaine, and τ0 is the average life time of the molecule without quencher 10-8 s.
The value of Ksv (0.00566 × 10³ Mol-1) is equal to the slope of a best fit straight-line analysis as shown in Figure 5. The quenching rate constant Kq, can be calculated using the fluorescence life time of 10-8 s for HSA [45]. The obtained value for K is 5.66 × 10⁸ Mol-1 s-1, which is two orders of magnitude smaller than the maximum scatter collision quenching constant for various quenchers with biopolymer 2×10¹⁰ Mol-1 s-1 [46]. This indicates that procaine has low binding affinity with HSA, and the binding is weak and can be easily reversed. Other low binding constants within similar range of 103 Mol-1 have also been reported [47]. Usually, low binding to HSA results in a shorter life time or poorer distribution of drugs in the plasma, whereas the strong binding reduces the levels of free plasma [48]. Therefore, the binding is weak and can be attributed to combinations of static and dynamic quenching, Lineweaver-Burk equation, is used [49,50]
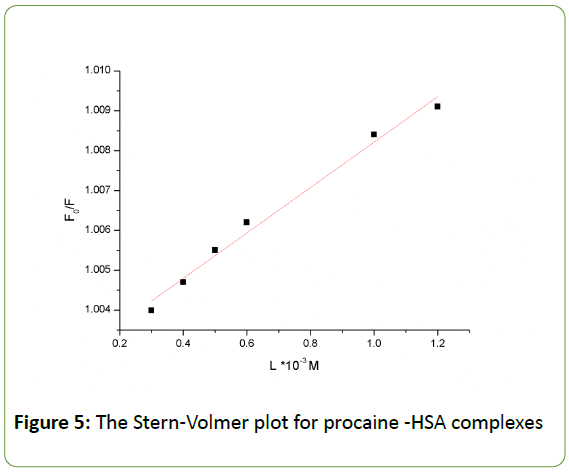
Figure 5: The Stern-Volmer plot for procaine -HSA complexes
 (5)
(5)
Where K is the static quenching constant with the unit of L mol-1, which describes the binding efficiency of micro molecules to biological macromolecules at ground state [51]. The value of K can be determined from the slope and the intercept in Figure 6. The value of K is 1.156 × 10³ Mol-1, which agrees well with the value obtained earlier by UV spectroscopy. The weak quenching constant in this case has led to a lower value of binding constant between the drug and HSA due to an effective hydrogen bonding between procaine and HSA. The interaction of procaine molecules with HSA is initiated by electrostatic forces, but subsequently the hydrophobic interactions play the major role in procaine-HSA interactions. The low value of the binding constant showed that procaine quenched the intrinsic fluorescence of HSA through dynamic quenching mechanism. Furthermore, hydrophobic interaction played a major role in the binding process. Using fluorescence and UV absorption spectroscopy showed that procaine induces protein structural changes. The red shift in Figure 2, and the good linearity in the Stern-Volmer equation imply the role of static quenching by procaine [52].
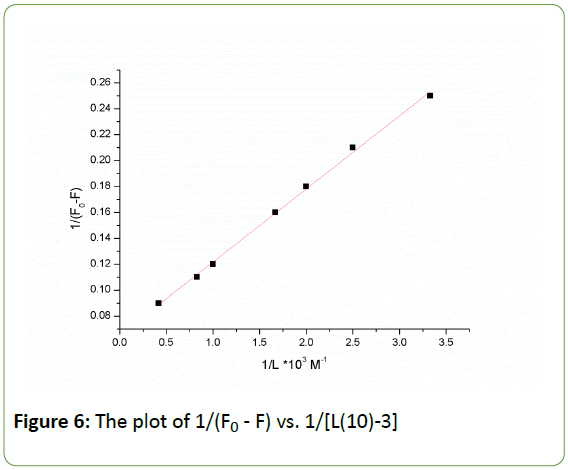
Figure 6: The plot of 1/(F0 - F) vs. 1/[L(10)-3]
FTIR Spectroscopy
The absorption spectra of HSA free and HSA-procaine complex are presented in Figure 7 showing the major amide bands (I, II, III) and the fingerprint region. All major peaks have been identified by taking the second derivative of the spectra and by applying Fourier self-deconvolutions (FSD) to the spectra as shown in Figure 8.
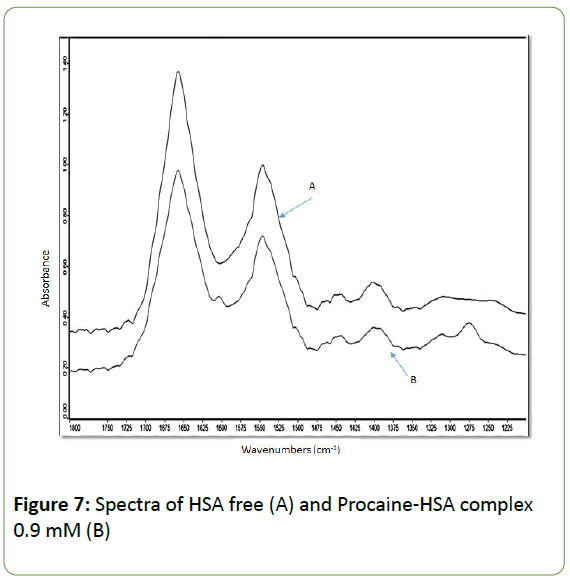
Figure 7: Spectra of HSA free (A) and Procaine-HSA complex 0.9 mM (B)
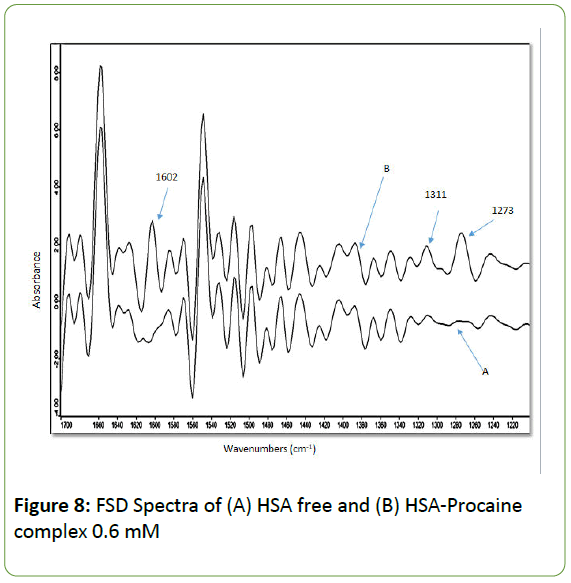
Figure 8: FSD Spectra of (A) HSA free and (B) HSA-Procaine complex 0.6 mM
The peak positions for the spectra of the protein and its complex with procaine are listed in Table 1. Infrared spectra of proteins exhibit a number of amide bands, which represent different vibrations of the peptide moiety. The FSD analysis of the absorption spectra for HSA in the amide I region (1600 -1700) cm-1 reveals the separate components of the band. The peaks of these bands correspond to the C-O stretching vibrations of the amide I group, coupled to the C-N stretching and C-C-N deformation mode [51]. The individual components of amide II (1600-1480) cm-1 are mainly due to out of phase combination of N- H in-plane bending and C-N stretching vibration modes [53]. As for amide III (1220=1320) cm-1, the absorption bands are caused by in-phase combination of the NH bending and the C-N stretching vibration with some contributions from the C-O in-plane bending and the C-C stretching vibration [53,54].
| Bands |
Range (cm-1) |
Free HSA |
concentrations |
| Amide I |
1700-1600 |
0 |
0.15 mM |
0.3 mM |
0.6 mM |
0.7 mM |
0.9 mM |
| Β-sheets |
|
---- |
----- |
1603 |
1603 |
1603 |
1603 |
| |
|
1613 |
1612 |
-- |
-- |
-- |
-- |
| |
β-sheets |
1627 |
1628 |
1626 |
1626 |
1626 |
1627 |
| |
Random |
1640 |
1641 |
1640 |
1640 |
1641 |
1641 |
| |
α-helix |
1657 |
1658 |
1658 |
1657 |
1659 |
1659 |
| |
Turns |
1679 |
1678 |
1678 |
1679 |
1679 |
1679 |
| |
β-sheets |
1694 |
1694 |
1694 |
1694 |
1694 |
1694 |
| Amide II |
1600-1480 |
|
|
|
|
|
|
| |
β-sheets |
1498 |
1498 |
1498 |
1498 |
1498 |
1498 |
| |
β-sheets |
1515 |
1516 |
1515 |
1515 |
1516 |
1516 |
| |
Random |
1532 |
1532 |
1532 |
1532 |
1532 |
1532 |
| |
α-helix |
1549 |
1549 |
1549 |
1549 |
1549 |
1549 |
| |
Turn |
1569 |
1569 |
1569 |
1569 |
1569 |
1569 |
| |
β-sheets |
1585 |
1585 |
1585 |
1584 |
1584 |
1584 |
| Amide III |
1320-1220 |
|
|
|
|
|
|
| |
β-sheets |
1224 |
1224 |
1224 |
1224 |
1224 |
1224 |
| |
β-sheets |
1244 |
1244 |
1244 |
1244 |
1244 |
1244 |
| |
Random |
1267 |
1267 |
|
|
|
|
| |
|
|
|
1273 |
1273 |
1273 |
1273 |
| |
Random |
1277 |
1277 |
|
|
|
|
| |
Turns |
1295 |
1295 |
1295 |
1295 |
1295 |
1295 |
| |
α-helix |
1309 |
1309 |
1309 |
1310 |
1310 |
1310 |
Table 1: Absorption peak positions in Wave numbers (cm-1) for Procaine-HSA at different concentrations.
The component bands of amide I were attributed according to the well-established assignment criterion [55,56]. The bands range (1615-1637) cm-1 and (1680-1700) cm-1 are generally assigned to β-sheets, (1638-1648) cm-1 are assigned to random coil, (1649 -1660) cm-1 to α -helix and (1660-1680) cm-1 to β- turn structure. The amide II components are assigned in the following order (1488-1504) and (1585-1600) cm-1 to β=sheets, (1504-1527) cm-1 to random coil, (1527 -1560) cm-1 to α- helix and (1564-1585) cm-1 to turn structure [57]. The component bands of Amide III have been assigned as follows: α-helix (1330-1290) cm-1, β-turn (1290-1270) cm-1, random coil (1270-1250) cm-1 and β-sheets (1250-1220) cm-1[56].
The peak positions of amide I bands in HSA spectrum stayed about the same as shown in Table 1. The only noticeable change is the disappearance of the small peak at 1612 cm-1 and the rise of a new peak at 1602 cm-1 with higher concentration of procaine. The amide II bands did not show any major changes in their peak positions with the different concentrations of HSAProcaine complexes. As for amide III, the following peaks (1310, 1294, 1243, and 1224) cm-1 maintain their positions, while the two weak bands at 1277 and 1243 cm-1 have been over shadowed by a new peak at 1273 cm-1. The two new peaks at 1602 and 1273 cm-1 are due to C=C (aromatic) stretching mode and C-O and C-N stretching mode of procaine, respectively [58-60]. Their dominant effect appears to be due to the presence of unbound procaine molecules within the HSAprocaine complex which is related to the weak binding constant between procaine and HSA.
The relative intensities of all component bands of amide I, amide II, and amide III were calculated and listed in Table 2. The following bands showed major increase in their intensities with increasing procaine concentration in the complex (1603, 1309, and 1273) cm-1, while these bands (1627, 1548) cm-1 showed very small increase in their relative intensities. On the other hand, the following bands (1657, 1531, and 1294) cm-1 show little or no decrease in their intensities. The bands at (1613, 1277, and 1266) cm-1 disappeared due to overlapping by neighboring bands and the rest of the bands showed no change in their intensities.
| Bands |
Range (cm-1) |
Intensity % |
Intensity % |
Intensity % |
Intensity % |
Intensity % |
Intensity % |
| Amide I |
1700-1600 |
0 |
0.15 mM |
0.3mM |
0.6mM |
0.7mM |
0.9mM |
| β-sheets |
1606-1620 |
3 |
5 |
|
|
|
|
| β-sheets |
1620-1633 |
5 |
7 |
7 |
9 |
17 |
14 |
| Random |
1633-1647 |
8 |
8 |
9 |
9 |
10 |
8 |
| α-helix |
1649-1670 |
46 |
40 |
40 |
46 |
25 |
39 |
| Turns |
1672-1686 |
18 |
19 |
20 |
18 |
21 |
18 |
| β-sheets |
1687-1700 |
20 |
21 |
24 |
18 |
26 |
21 |
| Amide II |
1600-1480 |
|
|
|
|
|
|
| β-sheets |
1487 1506 |
12 |
12 |
13 |
13 |
14 |
14 |
| β-sheets |
1506-1523 |
14 |
13 |
13 |
14 |
11 |
13 |
| Random |
1523-1539 |
11 |
15 |
11 |
10 |
10 |
9 |
| α-helix |
1541- 1558 |
23 |
25 |
23 |
25 |
20 |
24 |
| Turns |
1560-1585 |
19 |
19 |
19 |
20 |
21 |
21 |
| β-sheets |
1585-1600 |
21 |
16 |
21 |
18 |
24 |
19 |
| Amide III |
1320-1220 |
|
|
|
|
|
|
| β-sheets |
1222-1256 |
51 |
41 |
42 |
34 |
30 |
29 |
| Random |
1259-1287 |
15 |
21 |
30 |
40 |
43 |
45 |
| Turns |
1288--1302 |
5 |
6 |
5 |
5 |
5 |
5 |
| α-helix |
1302-1319 |
29 |
32 |
23 |
21 |
22 |
21 |
Table 2: Relative intensity of absorption bands for Procaine-HSA at different concentrations.
The difference in FSD spectra [(HSA+ procaine)-(HSA)] were obtained to investigate the intensity variations and the results are shown in Figure 9. The strong negative features at 1601 and 1277 cm-1 were due to absorbance by free procaine. While the band at 1309 cm-1 formed by double contributions from free procaine and procaine-HSA complex. The positive peaks shown at 1657 and 1554 cm-1 represent the decrease in intensity of the α-helix bands of the amide I and amide II respectively. This decrease is attributed to the unfolding of the protein in the presence of procaine as a result of the H-bonding formation with protein C=O and C-N groups [61]. As for any possible changes in the intensity of α-helix in the amide III region, it could not be determined due to the overlapping by the procaine band at 1309 cm-1. In general these changes of the peak positions, intensities and peak shapes are considered to be overwhelming evidences of secondary structure changes have occurred as a result of procaine interaction with HSA.
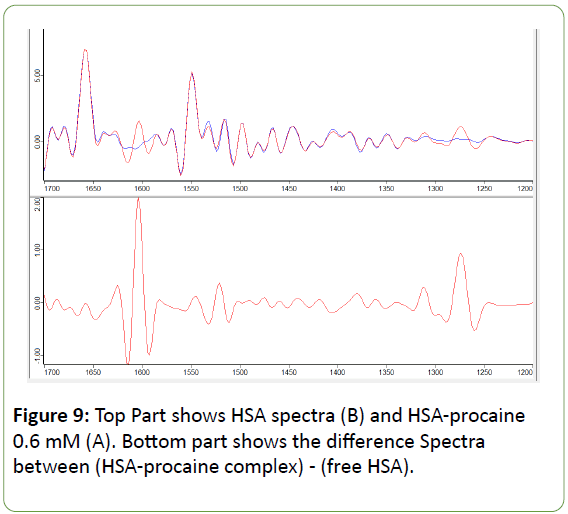
Figure 9: Top Part shows HSA spectra (B) and HSA-procaine 0.6 mM (A). Bottom part shows the difference Spectra between (HSA-procaine complex) - (free HSA).
Conclusions
In this paper, the interaction between procaine and HSA was investigated by fluorescence spectroscopy, UV-Vis absorption and FTIR spectroscopy. The results indicate that the fluorescence quenching mechanism of HSA by Procaine binding indicate contributions from both a static and dynamic quenching process. The binding reaction of procaine with HSA showed a binding constant is in the range of (1.115-1.156) × 103 M-1. The experimental results pointed to contributions from different interaction mechanisms between procaine and HSA. It seems that, the complexation of procaine molecules with HSA is initiated by electrostatic forces, but subsequently the hydrophobic interaction played a major role in this complexation.
The infrared spectroscopic results show that drug- protein binding occurs with the participation of the tryptophan residues and some conformation of the protein secondary structure. The variations in the relative intensities of the absorption bands showed a slight decrease in α-helical contents and a minor increase in β-sheet contents.
22972
References
- Hosseinzadeh R, Gheshlagi M, Tahmasebi R, Hojjati F (2009) spectrophotometric study of interaction and solubilization of procaine hydrochloride in micellar systems. Cent Eur J Chem 7: 90-95
- Lazdunski C, Baty D (1979) Procaine, a local anesthetic interacting with the cell membrane, inhibits the processing of precursor forms of periplasmic proteins in Escherichia coli. Eur J Biochem 96: 49-57
- Sawaki K, Kawaguchim M (1984) Some Correlations between procaine-induced convulsions and monoamides in the spinal cord of rats. Jpn J Pharmacol 51: 369-376
- Madrakian T, Bagheri H, Afkhami A, Soleimani M (2014) Spectroscopic and molecular docking techniques study of the interaction between oxymetholone and human serum albumin. J lumin 155: 218-225
- Carter DC, He XM, Munson SH, Twigg PD, Gernert KM, et al. (1994) Three-dimensional Structure of Human Serum Albumin. Science 244: 1195-1198
- He XM, Carter DC (1998) Atomic structure and chemistry of human serum albumin. Nature 358: 209-215
- Yang F, Zhang Y, Liang H (2014) Interactive Association of Drugs Binding to Human Serum Albumin. Int J Mol Sci 15: 3580-3595
- Kragh-Hansen U (1981) Molecular aspects of ligand binding to serum albumin. Pharmacol Rev 33: 17
- Zhang YZ, Zhou B, Liu YX, Zhou CX, Ding XL et al. (2008) Fluorescence study on the interaction of bovine serum albumin with p-aminoazobenzene. J Fluoresc 18: 109-118
- Kragh-Hansen U (1990) Structure and ligand binding properties of human serum albumin. Dan Med Bull 37: 57-84
- Cheger SI (1975) Transport Function of Serum Albumin, The academy of sciences, Bucharest,178
- Sudlow G, Birkett DJ, Wade DN (1975) The characterization of two specific drug binding sites on human serum albumin. Mol Pharmacol 11:824-832
- Haque SJ, Poddar MK (1984) Interactions of cannabinoids with bovine serum albumin. Biosci Rep 4: 239-243
- Purohit G, Sakthivel T, Florence AT (2003) The interaction of cationic dendrons with albumin and their diffusion through cellulose membranes. Int J Pharm 254: 37-41
- Mazoit JX, Cao LS, Samii K (1996) Binding of bupivacaine to human serum proteins, isolated albumin and isolated alpha-1-acid glycoprotein. Differences between the two enantiomers are partly due to cooperativity. J Pharmacol Exp Ther 276: 109-115
- S.S. Krishnakumar, D. Panda (2002) Spatial Relationship between the Prodan Site, Trp-214, and Cys-34 Residues in Human Serum Albumin and Loss of Structure through Incremental Unfolding. Biochemistry 41: 7443
- Il’ichev YV, Perry JL, Simon JD (2002) Interaction of Ochratoxin A with Human Serum Albumin. Preferential Binding of the Dianion and pH Effects J Phys Chem B 106: 460
- Yasseen Z J, Ghossain ME (2016) Studies on Binding of Widely used Drugs with Human Serum Albumin at Different Temperatures and PHs. J Biomedical Sci 5:3
- Alanazi AM, Abdelhameed AS (2016) A spectroscopic approach to investigate the molecular interactions between the newly approved irreversible ErbB blocker “Afatinib” and bovine serum albumin. PLoS ONE, e0146297
- Darwish SM,Sharkh SEA,Teir MMA,Makharza SA,Abu-hadid MA (2010) Spectroscopic investigations of pentobarbital interaction with human serum albumin. J Mol Struct 963: 122-129
- Guowen Z, Qingmin Q, Junhui P, Jinbao G (2018) Study of the interaction between icariin and human serum albumin by fluorescence spectroscopy. Journal of Molecular Structure 881: 132-138
- Elliot A, Ambrose EJ (1950) Structure of Synthetic Polypeptides. Nature 165: 921-922
- Miyazawa T (1967) in Poly-a-amino Acids, ed. Fasman, G.D.(Marcel Dekker, Inc., NewYork), 69-103
- Krimm S, Bandekar J (1986) Vibrational spectroscopy and conformation of peptides, polypeptides, and proteins. Adv Protein Chem 38: 181-364
- Byler DM, Susi H (1986) Examination of the secondary structure of proteins by deconvolved FTIR spectra. Biopolymer, 25: 469−487
- Surewicz WK, Mantsch HH, Chapman D (1993) Determination of Protein Secondary Structure by Fourier Transform Infrared Spectroscopy: A Critical Assessment. Biochemistry 3: 389-394
- Xie MX, Liu Y, Studies on amide III infrared bands for the secondary structure determination of proteins. Chem J Chin Univ-Chinese 24: 226-231
- Cai S, Singh BR (1999) Identification of ß-turn and random coil amide III infrared bands for secondary structure estimation of proteins. Biophys Chem 80: 7-20
- Cai S, Singh BR, (2004) A distinct utility of the amide III infrared band for secondary structure estimation of aqueous protein solutions using partial least squares methods. Biochemistry 43:2541-2549
- Galenko-Yaroshevskii P, Fistunenko PN, Dukhanin AS (2005) Kinetics of Interaction of Local Anesthetics with Human Serum Albumin. Bull Exp Biol Med 140
- J.J. Stephanos (1996) Drug-protein interactions: two-site binding of heterocyclic ligands to a monomeric hemoglobin. J Inorg Biochem 62: 155
- I.M. Klotz, (1982) Numbers of receptor sites from Scatchard graphs: facts and fantasies. Science 217: 1247-1249
- Zhong W, Wang Y, Yu JS, Liang Y, Ni K, et al. (2004) The interaction of human serum albumin with a novel antidiabetic agent--SU-118. J Pharm Sci 93: 1039
- Stephanos J, Farina S, Addison A (1996) Biochem. Biophys. Acta 1295: 209
- Colmenarejo G, Alvarez-Pedraglio A, Lavandera JL (2001) Cheminformatic Models To Predict Binding Affinities to Human Serum Albumin. J Med Chem 44: 4370-4378
- Valko K, Nunhuck S, Bevan C, Abraham MH, Reynold DP (2003) Fast Gradient HPLC Method to Determine Compounds Binding to Human Serum Albumin. Relationships with Octanol/Water and Immobilized Artificial Membrane Lipophilicity 92
- Purcell M, Neault JF, Tajmir-Riahi HA (2000) Biochim Biophys Acta 1478: 61
- Xie LX, Wu LH, Kang C, Xiang SX, Yin XL, Gu HW et al. (2015) Quantitative Investigation of the Dynamic Interaction of Human Serum Albumin with Procaine Using a Multi-way Calibration. Anal Methods 7: 6552
- Maiti TK, Ghosh KS, Debnath J, Dasgupta S (2006) Binding of all-trans retinoic acid to human serum albumin: fluorescence, FT-IR and circular dichroism studies. Int J Biol Macromol 38: 197-202
- Shahrakia S, Shiria F, Mansouri-Torshizib H (2016) Biophysical and Molecular Docking Studies of Human Serum Albumin Interactions with a Potential Anticancer Pt(II) Complex. Biomacromol J 2: 65-77
- Ranjbar S, Shokoohinia Y, Ghobadi S, Bijari N, Gholamzadeh S, et al.(2013) Studies of the Interaction between Isoimperatorin and Human Serum Albumin by Multi spectroscopic Method: Identification of Possible Binding Site of the Compound Using Esterase Activity of the Protein. Scientific World Journal 1-13
- Nanda RK, Sarkar N, Banerjee R (2007) Probing the interaction of ellagic acid with human serum albumin: a fluorescence spectroscopic study. J Photochem Photobiol A Chem 192: 152-158
- Tian JN, Liu JQ, Zhang JY, Hu ZD, Chen XG (2003) Fluorescence Studies on the Interactions of Barbaloin with Bovine Serum Albumin. Chem Pharm Bull 51: 579
- Chen GZ, Huang XZ, Xu JG, Zheng ZZ, Wang ZB (1990) Method of Fluorescence Analysis, Science Press, Beijing, ch 4
- Vaughan WM, Weber G (1970) Oxygen quenching of pyrenebutyric acid fluorescence in water: a dynamic probe of the microenvironment. Biochemistry 9:464-473
- Cheng TG, Li QL, Zhou ZG, Wang YL, Bryant SH (2012) Structure-Based Virtual Screening for Drug Discovery: A Problem-Centric Review. AAPS J 14: 133-141
- Chen YC, Wang HM, Niu QX, Ye DY, Liang GW (2016) Binding between Saikosaponin C and Human Serum Albumin by Fluorescence Spectroscopy and Molecular Docking. Molecules 21: 153
- Yan CN, Zhang HX, Liu Y, Mei P, Li KH, Tong JQ (2005) Fluorescence spectra of the binding reaction between paraquat and bovine serum albumin. Actachim. Sinica 63: 1727-1732
- Yan CN, Zhang HX, Liu Y, Mei P (2005) Study on binding reaction between flucytosine and bovine serum albumin. Chin J chem 23: 1151-1156
- Dukor RK, Chalmers JM, Griffiths PR (2001) Vibrational Spectroscopy in the Detection of Cancer, Handbook of Vibrational Spectroscopy, 5: Ch 3
- Chen YC, Wang HM, Niu OX, Ye DY, Liang GW (2016) Binding between Saikosaponin C and Human Serum Albumin by Fluorescence Spectroscopy and Molecular Docking, Molecules 21: 153
- Sirotkin VA, Zinatullin AN, Solomonov BN, Faizullin DA, Fedotov VD (2001) Calorimetric and Fourier transform Infrared Spectroscopic Study of Solid Proteins Immersed in Low Water Organic Solvents. Biochimicae Biophysica Acta, 1547: 359-369.
- Chirgadze YN, Fedorov OV, Trushina NP (1975) Secondary structure of Na+, K+-dependent adenosine triphosphatase. Biopolymers 14: 679-694
- Byler DM, Brouilette JN, Susi H (1986) Examination of the secondary structure of proteins by deconvolved FTIR spectra. Spectroscopy 1: 39
- Neault JF, Tajmir-Riahi HA (1998) Interaction of cisplatin with human serum albumin. Drug binding mode and protein secondary structure, Biochimica et Biophysica Acta 1384: 153-159
- Ivanov A I, Zhbankov R G, Korolenko E A, Korolik E V, Meleshchenko L A, Marchewka M, H. et al. 1994, J. Appl. Spectrosc. 60: 305-309
- Merine H, Tennouga L, Mesli A, Chafi N, Medjahed K (2013) Kinetic Study of the Controlled Release of Procaine Grafted in Monomer and Copolymer Supports in both Homogeneous and Heterogeneous Medium, AJPST 3: 99-106
- Brittain HG (1990) Analytical profiles of drug substances and excipients Academic press. 26 ISBN:0-12-260826-7
- Fuliaş A, Ledeţi I, Vlase G, Popoiu C, Hegheş A, et al. (2013) Thermal behavior of procaine and benzocaine Part II: compatibility study with some pharmaceutical excipients used in solid dosage forms. Chem Cent J 7: 7-140
- Darwish SM (2010) Spectroscopic study of propofol binding to human serum albumin. Biophys Rev Lett 5: 209-226




 (2)
(2) (3)
(3)

 (4)
(4)
 (5)
(5)


