Keywords
Depression; Suicidal tendency; Visibility graph; Speech; Emotion
Introduction
Suicide is the ultimate self-destructive step taken by a human being under ‘abnormal’ mental conditions. It is the act of taking one’s own life intentionally. In recent times suicidal tendency is a major health problem in western countries. The latest statistics available on it clearly depict the fact that the number of people affected by this dreadful ‘disease’ has been increasing day by day mostly in the time period from 2000 to 2006. According to 2007 data, suicide is the 11th leading cause of death in the United States and the number of suicides was twice that of homicides. More than 34000 suicides have been committed in one year which means 94 suicides in a day and on average one young person commits suicide in every two hours [1]. There are many reasons behind a suicide. All of the reasons are directly linked to psychiatry. Now, it has been estimated that nearly 50% of the people who committed suicide reached a certain depression level [2,3]. This corroborates the fact that this dreadful ‘disease’ is closely related to prolonged depression and depression in turn is related to the emotional well-being of human beings.
Emotions are the fundamental features of human behavior. Mental health is governed by emotions. Emotional fluctuations can be examined through the expressions of human beings like facial or gestural manifestations or perturbation in conversations or speech. Apart from the sociological generalizations, in the late thirties it was found scientifically that mental illnesses and psychiatric disorders affected the patient’s speech [4]. This was studied by recording spontaneous and non-spontaneous speech. Any speech is the composition of some emotions like fear, anger, sadness, happiness, surprise and disgust, defined as the Big Six Emotions by Cornelius [5]. So analysis of speech through emotions can lead to predictions of the depressed person’s behavior.
A person, having suicidal tendency, must have suffered from massive mental depression for a considerable period and from the above stated analysis it is evident that human speech should exhibit some mathematical features which could make it possible to predict a possible suicide. The works of Silverman [6] showed that there was a significant change in the tonal quality of people who had committed suicide. Campbell [7] made some advancement in speech analysis to measure suicidal risk. Fundamental frequency distributions were studied in the works. Further work on the same was mostly based on the power spectrum analysis of speech. [8]. The most notable finding in these works is that overall energy is lower in the speech of untreated patients than in the people who have gone through a proper psychological counseling [9]. Moore et al. [10] took prosody, formants, and glottal ratio/ spectrum as reckoning characteristics in their study to differentiate between depressed and non-depressed ‘patients’. Some amount of segregation was obtained with the exercise of glottal ratio/spectrum and formant bandwidths as differentiating characteristics.
Nowadays, commonly used suicidal risk assessment tools are made up of a series of questions and checklists with associated ratings which are evaluated by trained clinicians [11]. To summarize most of the speech classification techniques based on emotion depend on the stationary, frequency-domain methods like Fourier power spectrum. With regards to the non-stationary properties of signals, these methods have been strongly criticized. The spectrum of any signal that traverses a wide range of frequencies and quite a few number of harmonics are ignored when the signal undergoes Fourier analysis. Fourier analysis is mostly based on linear superpositions of trigonometric functions [12,13]. In most of the natural non-stationary time-series like speech signals, the extra harmonic components other than the ones detected in Fourier analysis of the original signal may produce a deformed wave profile. These deformations are the due to these nonlinear components of the signal. These nonlinear and non-stationary aspects contribute towards intricate changes in the complex dynamics of speech signals, which might arise out of depression, delimiting proper emotional expression. Not much work has been done in this area by the analysis of non-stationary aspects of speech signals. In this paper, we have used the method of complexity analysis without converting the non-stationary audio signals in frequency domain.
Recently a rigorous method and radically different conceptual approach named Visibility graph analysis was reported by Lacasa [14,15]. This method can be extensively used over a finite time-series data set and can produce reliable results in several domains. The information resulting from the Visibility Graph analysis of speech signals or any other natural signal is so detailed and rigorous that it cannot be realized with any physical system. Hence in this work we have extracted a summarized time-series retaining the non-stationary and nonlinear aspects of audio signals and have analyzed this timeseries with the Visibility Graph technique. The result is validated with another nonlinear analysis method named Detrended Fluctuation Analysis (DFA) [16] which is used for determining nonlinear scaling parameters and for detecting long-range correlations in time-series.
Here we propose a chaos-based, rigorous non-stationary methodology- Modified Visibility Graph (mPSVG) analysis, to analyze the dynamics of the acoustics of digitized audio signals and classify them emotion-wise, with a strong focus on possible definition of a precursor of suicidal tendency. As we have observed in the works on non-invasive detection of Alzheimer's disease [17], the control element calculated for speech delivered with anger and sadness emotions, has the highest resolution. Hence we have selected our test samples for these two emotions from the TESS collection [18], where the same words have been spoken and recorded with six emotions including sadness and anger. Then the speech samples are categorized and base-lined emotion-wise. Hence we term each of these samples as emotional non-spontaneous speech samples and treat each of them as a frame of reference for corresponding nascent emotions. We have used basic waveforms of the audio signals after de-noising them. Then we have done Modified Visibility Graph analysis of the samples and proposed the roadmap for a unique control system based on the emotions expressed by normal subjects and subjects diagnosed with depression and with or without medication.
This control system is modeled for the detection of suicidal tendency. The rationale behind this approach is to identify, essentially the severity of depression with the help of speech signals (spontaneous and non-spontaneous/suggested), since vocal features reflect the psychological states of human beings and can be used as indicators of suicidal tendency. These two kinds of speech signals for depressed patients are to be compared to those of normal persons using a quantitative parameter in the proposed control system. The effectiveness as well as the preciseness of the method has been tested. This work reports this in detail.
This paper is organized as follows: Section 2 describes the fractal and multifractal details with respect to speech analysis, both existing and proposed methods being described here. Section 3 describes the data and the process of analysis. In Section 4 the validation of the proposed method and the proposed model for detection of suicidal tendency are discussed and finally, the paper is concluded.
Method
Speech and fractals
The concept of fractals was introduced by Mandlebrot [19]. It comprises geometrical patterns repeating at different scales producing self-similar irregular surfaces or shapes which cannot be explained by Euclidean geometry. Natural objects such as a fern leaves, trees, snow-flakes and even clouds or galaxies in space show fractal structures, with self-similarity being their most important property. Any particular region of a fractal looks very similar to the entire region though not necessarily identical. This is called self-similarity. The calculation of fractal dimension that is measuring selfsimilarity is a major area in the field of study of chaos.
Speech production process is a fractal phenomenon. Speech is produced by the pulmonary pressure provided by the lungs [20]. Phonation in the glottis is generated by this process and eventually modified by the vowel tract into different vowels and consonants. When the consonants are spoken, quasi-static oscillations are generated in the vocal folds and the adjustment is done by the vocal tract. Both these processes are non-linear and the resultant speech signal waveform is both periodic and self-similar. There are several methods that have been proposed till date for measuring Fractal Dimension (FD). Most significant among them are De-trended Fluctuation Analysis (DFA), Multi-fractal De-trended Fluctuation Analysis (MF-DFA) and the latest advancement is being in PSVG or Power of Scale-freeness of a Visibility Graph.
DFA and MFDFA
If the time-series, say denoted by x(i) for, i = 1,2,…,N, shows long-range (power-law) correlation, the DFA [16] function, say denoted by F(s) follows a power-law relationship with the scale parameter, denoted by s as per the equation F(s) α sH. This exponent H is well known as Hurst exponent, very much related with the fractal dimension (FD), with the relationship FD = 2-H [21]. For this kind of analysis, it is also common to use an extended version of the DFA method called MF-DFA technique proposed by Kantelhardt [22], for its advantage of having the highest precision in scaling analysis. Different works have already been reported on basic fractal and multifractal dynamics of speech [23,24]. Recent works on muti-fractal analysis of speech and other signals of North Indian Classical Music(NICM) signals have analyzed their non-stationary, nonlinear aspects [25]. Quantifiable assessment of Heart Rate Dynamics during meditation by studying ECG-signal with multifractal analysis, as well as other works on human brain dysfunction using the same techniques have been reported supporting the concept and technique [26-30].
Although this Hurst exponent and MF-DFA parameter have been used extensively in all above works and have successfully identified long-range correlations for various time-series, they have some limitations. These parameters give most meticulous and accurate results for random processes like Brownian motion where time-series with an infinite number of data points are generated. However, in real-life situations we hardly get infinite number of data points, and end up using a finite time-series for estimation of the Hurst exponent or MF-DFA parameter. In this process the long-range correlations in the time-series are fractionally broken into a finite number of data points in the time-series and the local dynamics relating to a particular temporal window are definitely overestimated. Hence, the Hurst exponent or MF-DFA parameter calculated for finite sample size certainly deviates from its actual value and also the higher we make the sample size, the more accurate is the result of the analysis.
Visibility Graph Analysis
A rigorous method and radically different conceptual approach named Visibility Graph analysis was reported by Lacasa [14,15]. This method can be extensively used over finite time-series data sets even with 400 data points [31], and has obtained reliable results in various domains of science.
In this technique each node of the scale-free graph which is called the visibility graph represents a time sample of the time series, and an edge between two nodes shows the corresponding time samples that can view each other. The algorithm is a one-to-one mapping from the domain of time series X to its Visibility Graph. Let Xi be the ith point of the time series. Xm and Xn the two vertices (nodes) of the graph, are connected via a bidirectional edge if and only if the below equation is valid.
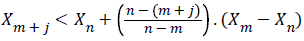
As shown in Figure 1, Xm and Xn can see each other, if the above is satisfied. With this logic two sequential points of the time series can always see each other hence all sequential nodes are connected together. The time series should be mapped to positive planes as the above algorithm is valid for positive x values in the time series.
Figure 1: Visibility graph.
As per the definition of the degree of a node according to graph theory, it is the number of connections or edges the node has with other nodes. If P(k) is the degree distribution of the overall network formed from the time series, and if there are a total of n number of nodes in the network and nk of them have degree k, then P(k) = nk/n . It is well known that two quantities satisfy the power law when one quantity varies as a power of another. The scale-freeness property of Visibility Graph states that the degree distribution of its nodes satisfies Power Law i.e., P(k) k-λ , where is a constant and it is known as Power of Scale-freeness in Visibility Graph (PSVG). PSVG, denoted by λ , which is calculated as the gradient of log2P(k) vs log21/k, corresponds to the amount of complexity and fractal nature of the time series indicating the Fractal Dimension (FD) of the signal [14,15,32]. It is also proved that there exists a linear relationship between the PSVG and the Hurst exponent of the associated time series [15].
Visibility graph for quantitative assessment of brain dysfunction has been reported [33] establishing the fact that this method can assess the degree of fractality accurately and reliably.
Proposed Method: Modified Visibility Graph Analysis
The main reasons for proposing the new method of analysis are as follows:
• Visibility Graph analysis produces most reliable and detailed information from the nonlinear and nonstationary properties of a time series with a finite number of points. However these intricate details cannot be perceived and realized with any physical system. Hence we need a realizable version of Visibility Graph.
• If the number of data points in the time series to be analyzed with Visibility Graph is increased, the computational cost and time is grossly increased. This makes the method a bit inefficient for real-time applications.
The proposed method is summarized in the following steps:
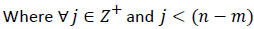
1. For each sample signal, time instants are along the x-axis and amplitudes are along the y-axis. Each sample is divided into a window of t seconds. For each t secondswide window the local maxima and minima are calculated with respect to the amplitude points. Figure 2 shows the original amplitude points in grey and the black bold line joins the points of maxima and minima values for each t seconds-wide window.
Figure 2: Local maxima and minima (black) over the original signal (grey).
2. In this process the modified signal, containing only sets of maxima and minima values, includes around 10-12% of the original number of data points. However, since we are not applying Fourier transform in this process of conversion, we are not losing the nonlinear and nonstationary properties of the original signal.
3. After this the Visibility Graph is constructed using the data points of the modified version of the signal. The method described in the Section 2 (Visibility Graph Analysis:) is followed here to construct the Visibility Graph and the calculation of where λ - PSVG. We would be denoting this PSVG as mPSVG (modified Power of Scale-freeness in Visibility Graph) going forward.
Results
Data
The TESS [18] collection from University of Toronto Psychology Department consists of 2800 voice samples of a 26 year old subject and a 64 year old subject where a set of 200 target words are spoken in English in the carrier phrase 'Say the word ----' by the two actresses (subjects). Each word is spoken in six ways along with the carrier phrase, eliciting all of the six emotions (anger, disgust, happiness, fear, neutral and sadness). For this project, two actresses were recruited from the Toronto area. Both of them spoke English as their first language, were university educated, and were trained in music. Audiometric testing has been done on the audio samples and the results indicated that the threshold for both of them is within the normal range. Also, as the speech set has been recorded recently- 21-Jun-2010, this adds more authenticity to the experiment. These samples are essentially treated as non-spontaneous or suggested speech. Depending on the severity of depression one can choose this precise emotional speech or spontaneous speech as the case demands.
The samples are of type mono (single channel) and in .wav format with sampling frequency of 24414 Hz. That means for each .wav audio file, there are 24414 number of digitized amplitude samples per second. Figure 2 shows digitized waveform of such .wav sample, where X-axis shows the time positions and Y-axis shows amplitude values. For our experiment we have used this amplitude waveform and converted it into text file having all the X, Y-axis values for the waveforms. The empirical mode decomposition method [34], has been used for noise removal from the original signal.
Analysis
The multifractal properties of these speech samples were explored for the purpose of non-invasive detection of Alzheimer's disease [17], and the anger and sadness emotions were found to show the highest resolutions. We have applied this new method of modified PSVG on the data for these two emotions for emotional speech-based modelling of depression. The results for the new method were validated by the existing method of DFA [16], with the trend of values of the Hurst exponents.
Discussion
Modified visibility graph analysis and Hurst exponent
The Hurst exponent and the mPSVG-s are calculated for the all the clips of anger and sadness emotions of the TESS [18] collection.
Hurst exponent and the mPSVG-s are calculated as per the method described in the Section 2. Software implementation is done in Java and Matlab.
1. Modified visibility graph is constructed for each of the speech samples. Figure 3 shows the k vs. P(k) plot generated from a sample signals of anger and sadness emotions and the power law relationship is evident here.
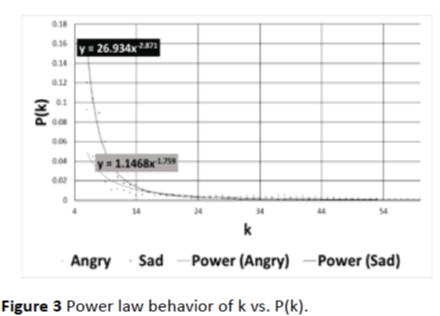
Figure 3: Power law behavior of k vs. P(k).
2. Then for each of the Visibility Graph-s constructed out of modified signal, mPSVG, is calculated as the gradient of log2P(k) vs log21/k. Figure 4 shows the plot of log2P(k) vs log21/k, of the same samples shown in Figure 3.
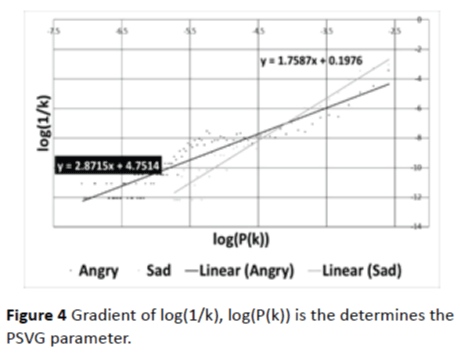
Figure 4: Gradient of log(1/k), log(P(k)) is the determines the PSVG parameter.
3. For each of the input files the Hurst exponent and the mPSVG values are compared for anger and sadness emotions.
4. Figure 5 shows the trend of Hurst exponents calculated for each of the sample speech signal spoken out of anger and sadness emotions. It is evident from the trend that for all of the samples the Hurst exponent is consistently higher for the sadness emotion than for the anger emotion.
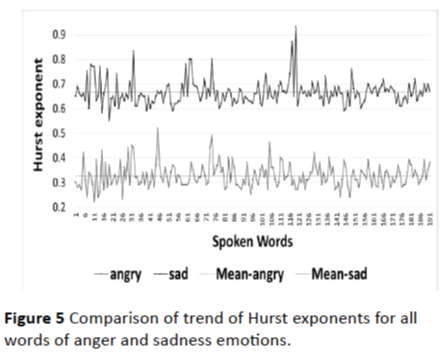
Figure 5: Comparison of trend of Hurst exponents for all words of anger and sadness emotions.
5. Figure 6 shows the trend of mPSVG-s calculated for each of the sample speech signals spoken out of anger and sadness emotions. It is evident from the trend that for all of the samples the mPSVG-s calculated with Modified Visibility Graph process is also consistently higher for the sadness emotion than for the anger emotion.
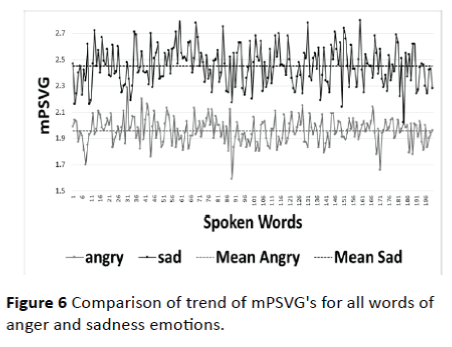
Figure 6: Comparison of trend of mPSVG's for all words of anger and sadness emotions.
6. This way we can confirm from this experiment that the same trend of values is observed for Hurst exponent and mPSVG. Also it should be noted that there exists a linear relationship between the PSVG and the Hurst exponent of the associated time series15.
7. Hence we can confirm here that the Modified Visibility Graph retains the nonlinear and non-stationary aspects of the original time series and makes it physically realizable and suitable for real-time applications.
Proposed model of the clinical tool for surveillance of suicidal tendency
We have already shown that mPSVG retains the nonlinear and non-stationary aspects of the original time series and quantitatively categorize anger and sadness emotions in a very distinctive manner. We have considered the test samples for young subjects in this model, as it has been said earlier that in the United States, on average, one young person commits suicide every two hours. Here we propose a model for a clinical tool for predicting suicidal tendency among the young adults, using the above parameters.
• Here we would consider two methods of clinical assessment of the subjects. One for spontaneous speech – like reading a passage, and another for non-spontaneous speech like the data generated in (TESS) [18] collection and used in this experiment.
• For non-spontaneous speech analysis, a set of control elements (anger and sadness) is derived from mPSVG-s calculated with Modified Visibility Graph analysis for the normal subjects.
• For the subjects to be diagnosed, angry and sad speeches are analyzed and deviation from the control elements is measured. Also the weekly rate of change of mPSVG-s calculated for the particular subject is measured.
• Any drastic ups and downs in this rate of change along with large deviation from the control elements, sets up the alarm.
• Similar kinds of analysis, definition of control elements and alarm-setting are done by analyzing non-spontaneous speech signals for the subjects diagnosed with depression and under medication.
• Similar clinical analysis is done for spontaneous speech also. However for spontaneous speech as there are no control elements, physicians should only check the rate of change of mPSVG-s.
• For subjects diagnosed with depression, if the depression is less severe, then clinical analysis should be done with both non-spontaneous and spontaneous speech and if less severe only spontaneous speech should be considered.
Figure 7 shows the workflow of the proposed model. Since the emotions have subjective attributes, in the proposed model we would be deriving a range of values and not the exact values for the control elements, from the mPSVG-s calculated for speech with anger and sadness emotions respectively. Apart from the specific emotional speech, spontaneous speech will also be explored using the same basic approach but changing the protocol person-wise. For in-house patients of depression the task is easy. Even for outdoor patients adequate follow-up and monitoring may easily be done by the person attending the patients following the doctor’s advice.
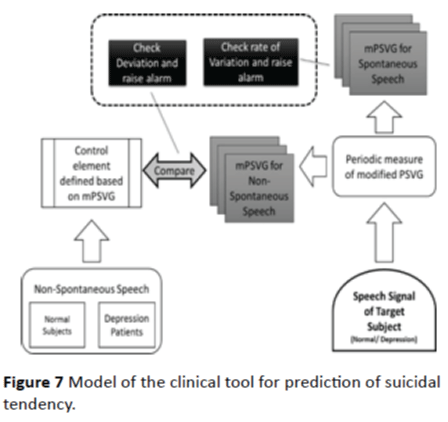
Figure 7: Model of the clinical tool for prediction of suicidal tendency.
We propose to extend this work to include the differences in dialects of various kinds of English (American, British etc.) and also other different languages, and then devise extended control parameters for the tool..
Conclusion
It is evident from the trend of values of the Hurst exponent, along with the mPSVG values, that Modified Visibility Graph analysis retains the nonlinear and non-stationary aspects of the original time series, yet is computationally efficient, making it suitable for real-time applications. It also retains the unique rigorousness and robustness of Visibility Graph analysis. Also from this trend we can confirm that mPSVG can distinctively classify speech signals spoken out of two elementary emotions namely ‘anger’ and ‘sadness’. Depression and suicidal tendency are very difficult to assess and detect due to their intricate clinical symptoms. Conventional assessment tools are mainly lists of questions with rating scales which are evaluated by the clinicians, thereby introducing subjective bias. As previous studies have shown that vocal features reflect the psychological states of human beings and can be used as indicators of suicidal tendency, in this work we have proposed a single parameter-mPSVG, which can even categorize anger and sadness emotions quantitatively from speech signals. This parameter is also sufficient to assess any possible mental dysfunction. One can apprehend about initial limitations of the method for application in extreme cases, as for example in the case of violent patients. But till date no method has been proposed or tried either, to tackle suicide-prone patients. As and when the situation will demand, the method can be suitably updated to accommodate varieties of patients. Finally we propose a model for a clinical tool to aid the physicians in clinical surveillance of suicidal tendency. Further we propose to validate the analysis using a larger database of various nonspontaneous speech signals from normal subjects as well as subjects diagnosed with depression. The present investigation happens to be the first of its kinds in the global scenario for addressing severe problems relating to mental health of the people, ranging from acute depression to suicidal vulnerability, with the latest state of the art of scientific methodology being adopted in tackling complex systems, in our case speech signals. This work will certainly stimulate further work across the globe aimed at reducing the number of loss of lives due to depression.
Acknowledgement
We thank the Department of Higher Education, Govt. of West Bengal, India for providing us the computational facilities to carry on this work.
Conflicts of Interest
The authors have reported no conflicts of interest.
9457
References
- Hasan WA, Sanadi WA (2011)Acoustic analysis of speech based on power spectral density features in detecting suicidal risk among female patients.Retrived from https://etd.library.vanderbilt.edu/available/etd03252011142343/unrestricted/Thesis_WanAhmadHasan.pdf.
- Joiner TE, Brown JS, Wingate LR (2005) The psychology and neurobiology of suicidal behavior. Annu Rev Psychol56:287-314.
- McGirr A, Turecki G (2008) What is specific to suicide in schizophrenia disorder? Demographic, clinical and behavioural dimensions. Schizophr Res98:217-224.
- Newman S, Mather VG (1938)Analysis of spoken language of patients with affective disorders. Am J Psychiatry94:913-942.
- Cornelius RR (1995) The science of emotion: Research and tradition in the psychology of emotion. Pearson.
- France DJ, Shiavi RG (2000) Acoustical properties of speech as indicators of depression and suicidal risk. IEEE Trans Biomed Eng47:829-837.
- Flint AJ, Black SE, Campbell-Taylor I, Gailey GF, Levinton C (1992) Acoustic analysis in the differentiation of Parkinson’s disease and major depression. J Psycholinguist Res 21:383-399.
- Hargreaves WA, Starkweather JA, Blacker KH (1965) Voice quality in depression. J AbnormPsychol70:218-220.
- Tolkmitt F, Helfrich H, Standke R, Scherer KR (1982) Vocal indicators of psychiatric treatment effects in depressives and schizophrenics. J CommunDisord15:209-222.
- Sun R, Moore E (2011) Investigating glottal parameters and teager energy operators in emotion recognition. In: D’Mello S, Graesser A, Schuller B, Martin JC, (eds). Lecture notes in Computer science (including subseries lecture notes in Artificial Intelligence and lecture notes in Bioinformatics). Vol 6975 LNCS. Berlin, Heidelberg: Springer Berlin Heidelberg 2011:425-434.
- Association TOH (2009) Suicide risk assessment guidebook: A resource for health care organizations. Retrived from https://www.oha.com/CurrentIssues/keyinitiatives/MentalHealth/Pages/SuicideRiskAssessmentGuidebook.aspx.
- Sarkar A, Barat P (2008)Effect of meditation on scaling behavior and complexity of human heart rate variability. Fractals16:199-208.
- Conte E, Khrennikov A, Federici A, Zbilut JP (2009) Fractal fluctuations and quantum-like chaos in the brain by analysis of variability of brain waves: A new method based on a fractal variance function and random matrix theory: A link with El Naschie fractal Cantorian space–time and V. Weiss and H. Weiss g. Chaos, Solitons& Fractals41:2790-2800.
- Lacasa L, Luque B, Ballesteros F, Luque J, Nuno JC (2008) From time series to complex networks: The visibility graph. ProcNatlAcadSci105:4972-4975.
- Lacasa L, Luque B, Luque J, Nuño JC (2009) The visibility graph: A new method for estimating the Hurst exponent of fractional Brownian motion. EPL EurophysicsLett 86:30001.
- Peng CK, Buldyrev SV, Havlin S, Simons M, Stanley HE, et al. (1994) Mosaic organization of DNA nucleotides. Phys Rev E49:1685-1689.
- Bhaduri S, Ghosh D (2016) Non-invasive detection of Alzheimer’s disease - Multifractality of emotional speech. J NeurolNeurosci 7: 84.
- Dupuis K, Pichora-Fuller MK (2015) Toronto emotional speech set (TESS) Collection. Retrived from https://www.alz.org/research/funding/global_biomarker_consortium.asp.
- Mandelbrot BB (1983) The fractal geometry of nature. Times BooksVol 51.
- Kantelhardt JW, Koscielny-Bunde E, Rego HH, Havlin S, Bunde A (2001) Detecting long-range correlations with detrended fluctuation analysis. Phys A Stat Mech its Appl295:441-454.
- Kantelhardt JW, Zschiegner SA, Koscielny-Bunde E, Havlin S, Bunde A, et al. (2002) Multifractaldetrended fluctuation analysis of nonstationary time series. Phys A Stat Mech its Appl316:87-114.
- Maragos P, Potamianos A (1999) Fractal dimensions of speech sounds: Computation and application to automatic speech recognition. J AcoustSoc Am105:1925.
- González DC, Luan Ling L, Violaro F (2012) Analysis of the multifractalnature of speech signals.2012:740-748.
- Bhaduri S, Ghosh D (2016) Speech Music and multfractality. CurrSci 110: 9.
- Dutta S, Ghosh D, Samanta S, Dey S (2014)Multifractal parameters as an indication of different physiological and pathological states of the human brain. Phys A Stat Mech its Appl396:155-163.
- Bhaduri A, Ghosh D (2016) Quantitative assessment of heart rate dynamics during meditation: An ECG based study with multi-fractality and visibility graph. Front Physiol 7.
- Dutta S, Ghosh D, Chatterjee S (2013)Multifractaldetrended fluctuation analysis of human gait diseases. Front Physiol 4: 274.
- Dutta S (2010)Multifractal properties of ECG patterns of patients suffering from congestive heart failure. J Stat Mech Theory Exp2010:P12021.
- Maity AK, Pratihar R, Mitra A (2015) Multifractaldetrended fluctuation analysis of alpha and theta EEG rhythms with musical stimuli. Chaos, Solitons& Fractals81:52-67.
- Jiang S, Bian C, Ning X, Ma QDY (2013) Visibility graph analysis on heartbeat dynamics of meditation training. ApplPhysLett102:253702.
- Ahmadlou M, Adeli H, Adeli A (2012) Improved visibility graph fractality with application for the diagnosis of Autism Spectrum Disorder. Phys A Stat Mech its Appl391:4720-4726.
- Bhaduri S, Ghosh D (2014) Electroencephalographic data analysis with visibility graph technique for quantitative assessment of brain dysfunction. Clin EEG Neurosci 2014:3-8.
- Huang NE, Shen Z, Long SR (1998) The empirical mode decomposition and the Hilbert spectrum for nonlinear and non-stationary time series analysis. ProcR Soc A Math PhysEngSci454:903-995.