Keywords
TP, RP-HPLC, Degradation studies.
Introduction
Trandolapril is chemically (2S, 3aR, 7aS) – 1 - [(S) – 2 -[[1 – Ethoxy carbonyl – 3 - phenylpropyl] amino] propanoyl] octahydro -1 H – indole – 2 - carboxylic acid. It is a potent non-sulfhydryl and dicarboxyl containing angiotensin converting inhibitor. Trandolapril is a mono ester prodrug and hydrolysed by esterases to its active dicarboxylic acid metabolite namely, trandolaprilat. The structures for both trandolapril and trandolaprilat are shown in Figure 1. It is a white to off white crystalline, odourless powder which melts in the range of 130-135?C [1].ACE is a peptidyl dipeptidase catalyzing the conversion of angiotensin I to the vasoconstrictor substance, angiotensin II, which stimulates aldosterone secretion by the adrenal cortex. Inhibition of conversion of the angiotensin I to the angiotensin II leads to a reduction in vasopressor activity and a decrease in peripheral vascular resistance [2, 3]. Trandolapril is approved for the management of hypertension, left ventricular systolic dysfunction and chronic heart failure [4]. Some of the undesirable effects very commonly reported for trandolapril include, dizziness, cough and headache.
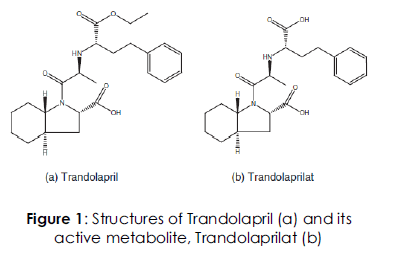
Figure 1: Structures of Trandolapril (a) and its active metabolite, Trandolaprilat (b)
Approximately 10% and 70% of oral dose of trandolapril is bioavailable as trandolapril and trandolaprilat respectively. Following absorption, oral trandolapril is rapidly and extensively hydrolysed to trandolaprilat. The mean t1/2of trandolapril is less than 1 h, and that of Trandolaprilat is, approximately, 75 h [5,6] .After single oral dose, the Cmax of trandolapril appeared to be dose proportional (0.83–0.86 ng/ml/mg) and occurred at 0.5–1 h. Trandolaprilat binding to human plasma proteins exceeds80%. The Cmax of trandolaprilat, after single oral doses, was also dose proportional (1.40–1.92 ng/ml/mg) with a Tmax of 4–8 h [7].
A literarure survey shows various methods developed with different detectors for quantification of trandoalpril. The methods for determination of trandolapril has been carried out by analytical methods such as HPLC [8,9] by Gumieniczek and Hopkala,LC-Mass spectrophotometry[10,11] by Constantinos Pistos et. al.,HPTLC [12] by D. Kowalczuk group, radioimmunoassay, spectrophotometry and potentiometry. But all the previous methods used were quite costly and complicated. The aim of present work was to develop a simple, economical and rapid HPLC stability indicating method with better detection range for estimation of trandolapril in bulk and formulations. Developed method was validated as per ICH guidelines [13].
Experimental
Materials and Methods
Chromatographic conditions: The analysis of the drug was carried out on a Waters HPLC system equipped with a reverse phase Xterra C18 column (100 mmx4.6mm; 3.5μm), a 2695 binary pump, a 20 μl injection loop and a 2487 dual absorbance detector and running on Waters Empower software.
Chemicals and Solvents: The reference sample trandolapril of was supplied by Sun Pharmaceutical Industries Ltd., Baroda. HPLC grade water and acetonitrile were purchased from E. Merck (India) Ltd., Mumbai.
Potassium dihydrogen phosphate and orthophosphoric acid of AR Grade were obtained from S.D. Fine Chemicals Ltd., Mumbai.
Preparation of phosphate buffer: Seven grams of KH2PO4 was weighed into a 1000 ml beaker, dissolved and diluted to 1000 ml with HPLC water. 2 ml of Triethylamine was added and pH adjusted to 3.0 with orthophosporic acid.
Preparation of mobile phase and diluents 300 ml of the phosphate buffer was mixed with 700 ml of acetonitrile. The solution was degassed in an ultrasonic water bath for 5 minutes and filtered through 0.45μ filter under vacuum.
Chromatographic conditions:
Mobile phase consist Conditions of ACNPhosphate buffer in the ratio of70:30 at a flow rate of 08 ml/min and pH of buffer was adjusted to 3.0 UV detection was performed at 225nm. The mobile phase was degassed by an ultrasonic water bath for 5 min. Filter through 0.45μ filter under vacuum filtration. The column was equilibrated for at least 30 min with the mobile phase flowing through the system.
Preparation of the Trandalopril Standard & Sample Solution:
Standard Solution Preparation:
Accurately weigh and transfer 10mg of Trandalopril Working standard into a 10 mL volumetric flask add about 7 mL of Diluent and sonicate to dissolve it completely and make volume up to the mark with the same solvent. (Stock solution)
Further pipette 0.4 ml of the above stock solution into a 10ml volumetric flask and dilute up to the mark with diluent. Mix well and filter through 0.45μm filter.
Sample Solution Preparation:
Weigh 5 Trandalopril Tablets and calculate the average weight. Accurately weigh and transfer the sample equivalent to 10 mg of Trandalopril into a 10 ml volumetric flask. Add about 7 ml of diluent and sonicate to dissolve it completely and make volume up to the mark with diluent. Mix well and filter through 0.45μm filter.
Further pipette 0.4 ml of the above stock solution into a 10ml volumetric flask and dilute up to the mark with diluent. Mix well and filter through 0.45μm filter.
Preparation of calibration graph:
The linearity of response for Trandalopril assay method was determined by preparing and injecting solutions with concentrations of about 20,30,40,50,60μg/ml of Trandalopril.
Validation of the Proposed Method
After chromatographic method development and optimization it was validated. The validation of an analytical method verifies that the characteristics of the method satisfy the requirements of the application domain. The proposed method was validated according to ICH guidelines for linearity, precision, sensitivity, and recovery. For linearity studies, working standard solutions equivalent to 20 to 60 μg/ml of Trandalopril were prepared with the mobile phase.
Precision & Accuracy
According to ICH, precision is the closeness of agreement (degree of scatter) between a series of measurements obtained from multiple sampling of the same homogenous sample under the prescribed conditions and may be considered at three levels: repeatability, intermediate precision and reproducibility. The intra-day and inter-day variations of the method were determined using five replicate injections and analyzed on the same day and different days.
The accuracy of an analytical method expresses the closeness between the theoretical value and experimental value. To ensure the reliability and accuracy of the method, the recovery studies were carried out to ensure the reliability and accuracy of the method. Accuracy was evaluated by injecting the Trandalopril about five times, at three different concentrations equivalent to 50, 100, and 150% of the active ingredient, by adding a known amount of Trandalopril standard to a sample of known concentration and calculating the recovery Trandalopril of for each concentration.
Detection and Quantification Limits
The limits of detection and quantification were calculated by the method based on standard deviation (�) and slope (S) of the calibration plot using the formula LOD = 3.2 σ/S and LOQ =9.9 σ/S.
Specificity
The specificity test of proposed method demonstrated that excipients from tablets do not interfere in the drug peak. Furthermore, well shaped peaks indicate the specificity of the method.
Assay
Twenty tablets were weighed and powdered equivalent to 10 mg Trandalopril of was accurately weighed and diluted up to 10 ml. Working dilution was prepared using same diluents and used for analysis.
Forced degradation studies
Acid Degradation:-
Accurately weigh and transfer 10mg Trandalopril of working standard into a 10mL volumetric flask add about 3 ml of 0.5N HCl and sonicated for 5minutes. Reflux under heat at 60 degrees in a heating mantle for 2 hours. Neutralize the sample solution using 0.5N NaOH and diluted up to the mark with diluents (Stock solution).
Further pipette 0.3 ml of the above stock solution into a 10ml volumetric flask and dilute up to the mark with diluent. Mix well and filter through 0.45μm filter.
Base Degradation:
Accurately weigh and transfer 10mg of Trandalopril working standard into a 10ml volumetric flask add about 3ml of 0.5N NaOH and sonicated for 5 minutes. Reflux under heat at 60 degrees in a heating mantle for 2 hours. Neutralized the sample solution using 0.5N HCl and diluted up to the mark with diluents (Stock solution).
Further pipette 0.3 ml of the above stock solution into a 10ml volumetric flask and dilute up to the mark with diluent. Mix well and filter through 0.45μm filter.
Thermo Degradation:
Accurately weigh and transfer 10mg of Trandalopril working standard into a 10mL volumetric flask and oven under heat at 105 degrees for 12 hours (Stock solution).
Further pipette 0.3 ml of the above stock solution into a 10ml volumetric flask and dilute up to the mark with diluent. Mix well and filter through 0.45μm filter.
Results and Discussion
In the proposed method, the retention time of Trandalopril was found to be 2.645 min. Quantification was linear in the concentration range of 20-60μg/ml. The regression equation of the linearity plot of concentration of Trandalopril over its peak area was found to be Y=69569.6+48442X (r2=0.999), where X is the concentration of Trandalopril (μg/ml) and Y is the corresponding peak area. The number of theoretical plates calculated was 2094.9, which indicates efficient performance of the column. The limit of detection and limit of quantification were found to be 0.024μg/ml and 0.08 μg/ml respectively, which indicate the sensitivity of the method. The use of phosphate buffer and acetonitrile in the ratio of 40:60v/v resulted in peak with good shape and resolution.
Calibration curve
These results indicate that the response is linear over the range of 20, 30, 40,50and 60μg/ml of Trandalopril with coefficient of regression, R2, value as 0.999 as shown in Table: 1. the value of correlation coefficient, slope and intercept were 0.999 48442.82 and 69569.6 respectively.
| S. No. |
Parameter |
Result |
| 1 |
Range (µg/ml) |
20-60 |
| 2 |
Detection wavelength (? max) |
210 |
| 3 |
Mean ‘R2’ value |
0.999 |
| 4 |
Slope (m). |
48442.82 |
| 5 |
Intercept (c) |
69569.6 |
| 6 |
Run time(min) |
5 |
| 7 |
Retention Time (min) |
2.645 |
| 8 |
Theoretical Plates (N) |
2094.9 |
| 9 |
Tailing Factor |
1.5 |
| 10 |
LOD |
0.024 |
| 11 |
LOQ |
0.08 |
Table 1: Regression characteristics of the Trandalopril for proposed HPLC method
Validation of the proposed method
The specificity, linearity, precision, accuracy and limit of detection, limit of quantification, robustness and system suitability parameters were: studied systematically to validate the proposed HPLC method for the determination of the diluent and the solution was filtered through a 0.45 μ membrane filter. This solution containing 40μg/ml of Trandalopril was injected into the column six times. The average peak area of the drug was computed from the chromatograms and the amount of the drug present in the tablet dosage form was calculated by using the regression equation obtained for the pure drug. The relevant results are furnished. The Solution containing 40 μg/ml of Trandalopril was subjected to the proposed HPLC analysis to check intra-day and inter-day variation of the method and the results are furnished in Table-2.
| Concentration of Trandalopril (µg|ml) |
Intra day |
Inter day |
| Injection-1 |
1977823 |
2020950 |
| Injection-2 |
2055023 |
2013520 |
| Injection-3 |
2007013 |
2012320 |
| Injection-4 |
2069758 |
2014048 |
| Injection-5 |
2002317 |
2016497 |
| Average |
2022387 |
2015467 |
| Standard Deviation |
38516.9 |
3421.6 |
| %RSD |
1.90 |
0.17 |
Table 2: Precision of the proposed HPLC method
The accuracy of the HPLC method was assessed by concentrated levels by the proposed method. The results are furnished in Table-3.
| %Concentrati on (at specification Level) |
Area |
Amou nt Added (mg) |
Amou nt Found (mg) |
% Recovery |
Mean |
| 50% |
1028170 |
5.1 |
5.13 |
100. 0% |
99.9% |
| 100% |
1979502 |
9.9 |
9.88 |
99.8% |
| 150% |
2977023 |
15.0 |
14.8 |
99.1% |
Table 3: Accuracy studies
Estimation of Trandalopril in tablet dosage forms:
Two commercial brands of tablets were chosen for testing the suitability of the proposed method to estimate Trandalopril tablet formulations 5 tablets were weighed and powdered. An accurately weighed portion of this powder equivalent to 10 mg of Trandalopril was transferred into a 10ml volumetric flask and dissolved in 7ml of a40:60 v/v mixture of phosphate buffer and acetonitrile. The contents of the flask were sonicated for 15 min and a further amount of the diluent was added, the flask was shaken continuously for 15 min to ensure complete solubility of the drug. The volume was made up with the diluent and the solution was filtered through a 0.45 μ membrane filter. This solution containing40μg/ml of as in Trandalopril injected into the column six times. The average peak area of the drug was computed from the chromatograms and the amount of the drug present in the tablet dosage form was calculated by using the regression equation obtained for the pure drug. The relevant results are furnished in table-5.
| S.No |
Condition |
Time (hrs) |
Assay of Trandalopril |
Retention time of Trandalopril |
%degradation |
| 1 |
No stress treatment |
- |
101.48 |
2.691 |
Nil |
| 2 |
Acid |
2 |
- |
- |
Nil |
| 3 |
Alkali |
2 |
- |
- |
Nil |
| 4 |
Thermal |
12 |
- |
- |
Nil |
Table 4: Stressed study data of Trandalopril
Stability- Indicating property
The stress studies were conducted and the data were depicted in Table: 4 .the chromatogram of no stress treatment of control and sample showed no additional peaks (Figure: 2 & 3)

Figure 2: The simple chromatogram of standard Trandalopril.
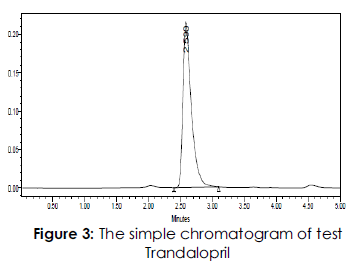
Figure 3:The simple chromatogram of test Trandalopril.
The retention time (RT) of standard and sample were 2.287min & 2.318min .The chromatogram of acid degraded sample showed no additional peaks (fig: 4). The chromatogram of alkali degraded sample showed no additional peaks (fig: 5). The chromatogram of thermal degraded sample showed no additional peaks (fig: 6). and the values were shown in Table 4.
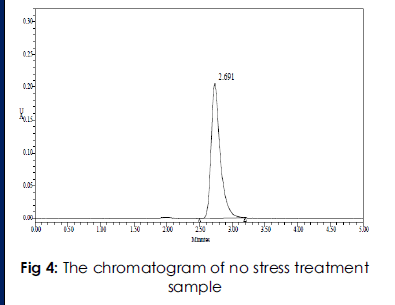
Figure 4:The simple chromatogram of test Trandalopril.
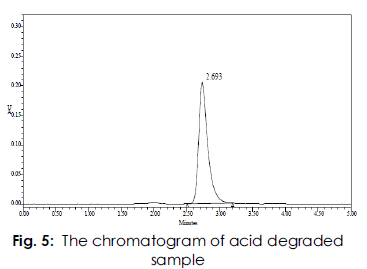
Figure 5:The chromatogram of acid degraded sample.
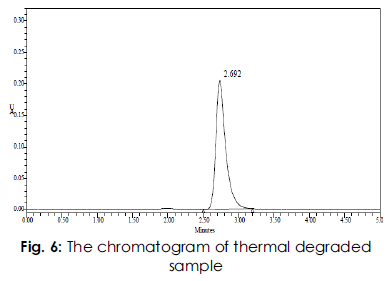
Figure 6:The chromatogram of thermal degraded sample.
Conclusion
The developed HPLC technique is precise, specific, accurate and stability?indicating. Statistical analysis proves that the method is suitable for the analysis Trandalopril of as bulk drug and in Pharmaceutical formulation without any interference from the excipients. This study is a typical example of a stability?indicating assay, established following the recommendations of ICH guidelines. The method can be used to determine the purity of drug available from various sources by detecting any related impurities. The method has been found to be better than previously reported methods, because of use of a less economical and readily available mobile phase, lack of extraction procedures, no internal standard, and use of the same mobile phase for washing of the column. All these factors make this method suitable for quantification of in bulk drugs and in pharmaceutical dosage forms. It can therefore be concluded that use of the method can save much time and money and it can be used in small laboratories with very high accuracy and a wide linear range.
Acknowledgements
The authors are thankful to M/s Sun Pharmaceutical Industries Ltd., Baroda for providing a reference sample of. Trandalopril
5751
References
- D. P. IP, G. S. Brenner, in: K. Florey (Ed.), Analytical Profiles of Drug Substances, Academic Press Orlando FL (1987) 207–243.
- D.N. Franz, A. R. Gennaro (Ed.), Remington: The Science and Practice of Pharmacy, vol. II, 19th ed., Mack Publishing Company, Pennsylvania (1995) 951.
- G. T. Warner, C.M. Perry, Ramipril: are view of its use in the prevention of cardiovascular outcomes, Drugs 200262(9) 1381-1405.
- https://www.medicines.org.uk/EMC/medicine/827 9/SPC/gopten/ accessed on30/05/10.
- A Patat, A Surjus, A Le Go, JGranier, Safety and tolerance of singleoral doses of trandolapril (RU 44.570), anew angiotensin converting enzymeinhibitor, Eu. J. Clin. Pharmacol. (1989)36(1) 17-23.
- F. De Ponti, C. Marelli, L. D'Angelo, M. Caravaggi, L. Bianco, S. Lecchini, G. M. Frigo, A. Crema, Pharmacological activity and safety of trandolapril (RU44570) in healthy volunteers, Eur J Clin Pharmacol Feb. (1991) 40 (2) 149.
- H. López, J. Francisco, O. Flores, N. López, M. José, M.J. Montero, R. Carrón, Antihypertensive Action of Trandolapriland Verapamil in Spontaneously Hypertensive Rats After Unilateral Nephrectomy, J. Cardiovasc. Pharmacol. Aug (1998) 32 (2) 284-290.
- A. Gumieniczek, H. Hopkala, Highperformanceliquid chromatographic assay of trandolapril in capsules, Actapoloniac Pharmaceutica- Drug research (2000) 57 253.
- A. Gumieniczek, H. Hopkala, Development and validation of a liquid chromatographic method for the determination of Trandolapril and verapamil in capsules, J. Liq. Chromat. Rel. Tech. (2001) 24(3) 393-400.
- C. Pistos, M. Koutsopoulou, I. Panderi, Liquid chromatographic tandemmass spectrometric determination oftrandolapril in human plasma, Anal. Chim. Act. (2005) 540 375–382.
- R. V. S. Nirogi, V. N. Kandikere, W. Shrivastava, K. Mudigonda, Quantification of trandolapril and itsmetabolite trandolaprilat in human plasma138 Dubey et al Research Article IJBR 1[3][2010]by liquid chromatography / tandem mass spectrometry using solid-phase extraction, Rapid Commun. Mass Spectrom (2006)20 3709–3716.
- D. Kowalczuk, Simultaneeous high performance thin-layer chromatography densitometric assay of Trandolapril andverapamil in combination preparation, J.AOAC inter. (2005) 88 1525-1529.
- The European Agency for the Evaluation of Medical/Products. ICH Topic Q2B Note for Guideline on Validation of Analytical Procedures: Methodology (1996) GPMP/ICH/281/95.


