Keywords
Gemifloxacin; First derivative; Derivative ratio; Dual wave length; Bivariate calibration; Ratio difference
Introduction
Gemifloxacin; chemically is 7-[(3-(aminomethyl)-4-(methoxyimino)- 1-pyrrolidinyl]-1-cyclopropyl-6-fluoro-1,4-dihydro-4-oxo-1,8- naphthyridine-3-carboxylic acid [1], Figure 1. It is an oral broadspectrum third generation fluoroquinolones antibacterial agent used in the treatment of acute bacterial exacerbation of chronic bronchitis and mild-to-moderate pneumonia. It is indicated for the treatment of respiratory and urinary tract infection [2]. Gemifloxacin (GEM) is rapidly absorbed from the gastrointestinal tract with an absolute bioavailability of about 71%. A peak plasma concentration is occurring 0.5 to 2 hours after an oral dose. It undergoes limited hepatic metabolism and has an elimination half-life of about 7 hours. It is excreted as unchanged drug and metabolites in the faeces and urine [3]. Several analytical techniques were widely described for the analysis of GEM. Some spectroscopic methods with different approaches including colorimetric [4-7], and fluorimetric [8] procedures were developed. GEM can also be determined by LC-tandem MS [8-12] and thin layer chromatography [13]. Different high performance liquid chromatographic [HPLC] methods were used for analysis of GEM in variable sample matrices [14-25]. But according to the literatures in hands, there is no direct stability indicating spectrophotometric method was developed for GEM quantification.
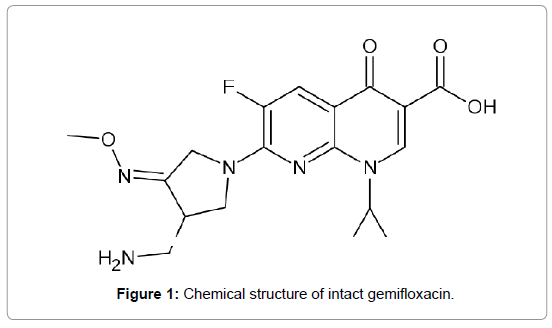
Figure 1: Chemical structure of intact gemifloxacin.
Experimental
Instrumentation
Dual-beam UV-visible spectrophotometer, UV-1650 PC (Shimadzu) with matched 1 cm quartz cells, connected to an IBM compatible personal computer (PC), software is UV Probe version 2.21.
Materials and reagents
• Gemifloxacin (GEM) pure sample: HIKMA Pharma, Giza-Egypt. Its purity was assessed to be 99.61 ± 0.579 % (n=6) according to a reported spectrophotometric method [4].
• Factive® tablets: Each tablet claimed to contain 426.39 mg gemifloxacin mesylate equivalent to 320 mg gemifloxacin, batch No. (BN) 005 , manufactured by HIKMA Pharma S.A.E-Egypt, under license of LG life science, Ltd, Seoul-Korea.
• Methanol: Spectroscopic grade (E. Merck, Darmstadt- FRG).
• Sodium hydroxide, 4M aqueous solution and hydrochloric acid, 3M aqueous solution (Adwic, Cairo-Egypt).
Standard solutions
Standard solution of gemifloxacin: A standard stock solution of GEM was prepared by transferring accurately 100 mg of pure drug into 100 mL volumetric flask, dissolving in 20 mL methanol and then the volume was completed to the mark with the same solvent to provide standard stock solution containing 1mg mL-1.
Working solution of gemifloxacin: GEM working solution was prepared by transferring 10 mL of the standard stock solution into100 mL volumetric flask and then the volume was completed to the mark with methanol to obtain standard working solution containing 0.1 mg mL-1 of GEM, and then further dilution was applied to reach final concentration of 10 μg mL-1.
Stock solution of acid degraded GEM: Accurately weighed 100 mg of pure GEM was transferred to a 250 mL round bottomed flask and 25 ml of 3N HCL was added, and then refluxed with continuous magnetic stirring for 10 hours. The solution was neutralized to pH 7 with 4N NaOH, concentrated nearly to dryness and cooled to room temperature. The residue was dissolved with least amount of methanol, and then filtered, the filtrate was collected into 100 ml measuring flask and the volume was made up with methanol. Complete acid degradation of GEM was confirmed by TLC-fractionation on silica gel F 254 plates using ethyl acetate:methanol:ammonia (8:4:3 by volumes as a developing solvent, visualization was carried under UV-lamp 254.0 nm [14]. Then the degradation products were elucidated by mass spectrometry.
Aliquot portion of this solution was diluted with distilled water to prepare working stock solution of 10 μg mL-1.
Procedures
Construction of calibration curves: Accurately measured volumes of intact GEM working solution (0.1 mg mL-1) were transferred into a series of 10 mL volumetric flasks and diluted to the mark with methanol to obtain concentrations from 2 to 12 μg mL-1. These prepared concentrations were used to construct the calibration curve for each theory as follows:
For D1 spectrophotometric method: The D1 spectra of each solution was recorded using Δλ=4 and scaling factor=20. For determination of GEM in presence of its acid degradation products, calibration curve was obtained by plotting the peak amplitudes of D1 at 254.6 nm (corresponding to zero-crossing of the degradation products) versus the corresponding drug concentrations, and regression equation was computed.
For (DD1) spectrophotometric method: The absorption spectra of these solutions were divided by the absorption spectrum of 8 μg mL-1 of the acid degradation products (as divisors). The obtained ratio spectra were then differentiated with respect to wavelength using Δλ=4 and scaling factor=1. The peak amplitudes at peak 273.0 nm and trough 284.0 nm were recorded for the determination of GEM in presence of its acid degradation products. The calibration curves representing the relationship between the measured amplitudes and the corresponding concentrations of the drug were constructed and the regression equations were computed.
For dual wave length method: The zero-order spectrum of each dilution was recorded against methanol as blank. The absorbance difference of GEM was measured between the selected wavelength pair (271.8 nm and 325.0 nm) for each dilution separately, and then the obtained differences were plotted against the corresponding concentrations of the drug and the regression equation was then computed.
For ratio difference spectrophotometric method: The zero order spectra of the prepared concentrations of GEM were divided by the spectra of 8 μg mL-1 GEM acid degradation product, the difference in the peak amplitudes at the ratio spectra was measured at 355.0 and 270.0 nm (ΔP). Calibration graph relating ΔP at the chosen wavelength couples to the corresponding concentrations of GEM was constructed, and the corresponding regression equation was computed.
For bivariate spectrophotometric method: A concentration series of the acid degradation products was prepared as well. Accurately measured volumes from its working solution were transferred separately into a series of 10 mL volumetric flasks and diluted to the mark with methanol to obtain concentrations from 2 to12 μg mL-1. The zero-order spectrum of each dilution was recorded against methanol as blank. The absorbance of GEM and its acid degradation products were measured at 255.0 nm and 277.0 nm for each dilution separately, and then the absorbance at the selected wavelengths were plotted against the corresponding concentrations and the regression equations were then computed.
Laboratory prepared mixtures: Laboratory synthetic mixtures containing GEM and different percentages of its degradation product were prepared by transferring aliquot portions (1-9 mL) of the GEM working solution in a concentration of (10 μg mL-1) into a series of 10 mL measuring flasks. Different portions of the acid degraded solution its concentration is 10 μg mL-1 were also added to prepare different mixtures containing 10-90% of the degradation products then the volumes were made up with methanol.
Application to pharmaceutical preparation: Ten Factive® tablets were powdered finely, a weight equivalent to ~100 mg GEM was transferred accurately into a 100 mL volumetric flask and sonicated for ~20 min with about 50 mL methanol, followed by filtration through filter paper then the volume was completed with methanol to 100 mL. Further dilutions were applied with methanol in order to reach the linearity rang. The general procedures were followed and the concentration of GEM was calculated from its corresponding regression equations.
Results and Discussion
The focus of the present work was to develop accurate, specific, and sensitive stability indicating methods for the determination of GEM in pure form and in pharmaceutical formulation in presence of its potential acid degradation products. Although chromatographic methods are more sensitive but spectrophotometry is still the technique of choice for its simplicity and reproducibility. In addition, it does not need sophisticated programs or solvents with special grades. So, it is the most economic and reliable analytical technique with highest possible accuracy.
Separation and identification of degradation products
Accelerated stability studies were applied to GEM to explore its inherent stability characteristics and it was found that GEM is susceptible to hydrolysis under acidic conditions. The expected scheme of acid degradation of gemifloxacin may be illustrated as shown in Scheme 1. The structure of the acid-induced degradation products was confirmed using mass spectral analysis as shown in Figure 2. The zeroorder absorption spectra of GEM and its acid degradation products show sever overlapping, Figure 3, which interferes with the direct determination of GEM. This problem suggested that these proposed methods are suitable method for the simultaneous determination of GEM in presence of its acid degradation products.

Scheme 1: The expected scheme of acid degradation of gemifloxacin.

Figure 2: Chromatogram of LC/MS determination of GEM in presence of its acid degradation products, (a) for pure GEM, (b) for degradation product (I) and (c) for degradation (II).
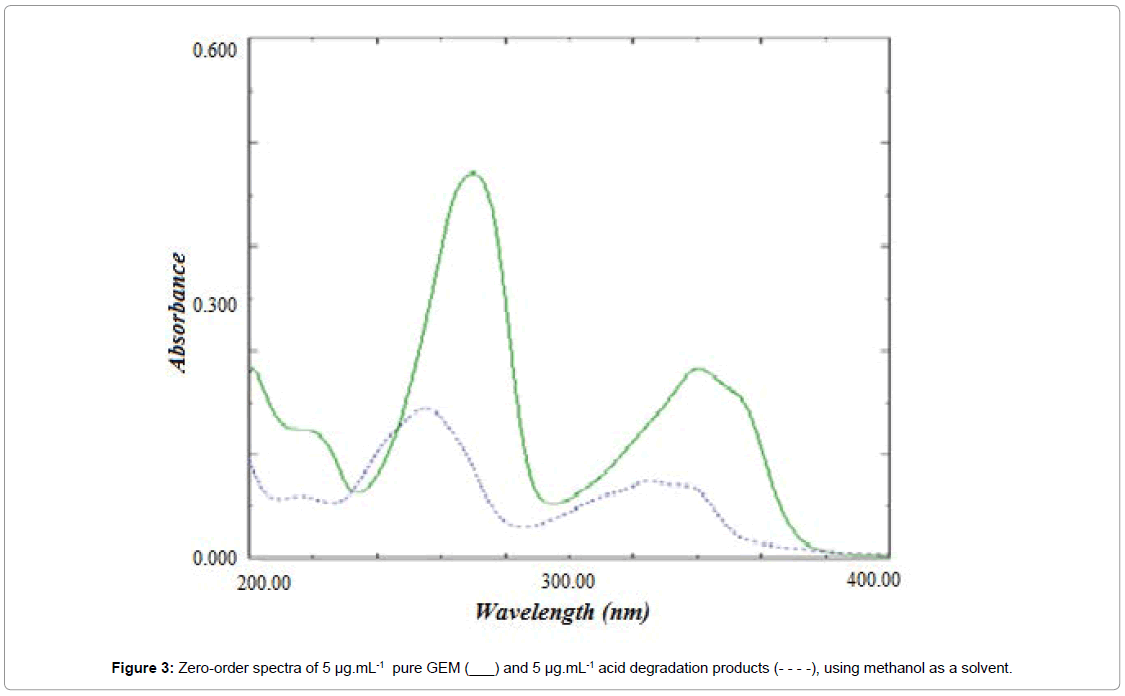
Figure 3: Zero-order spectra of 5 μg.mL-1 pure GEM (___) and 5 μg.mL-1 acid degradation products (- - - -), using methanol as a solvent.
D1 method
The obtained spectra showed good resolutions allowing clear determination of GEM at 254.6 nm without any contribution of its degradation products that show zero crossing at the selected wavelength, Figure 4. Linear calibration curves were obtained for the suggested method in concentration range of (2-12 μg mL-1). The regression equation was calculated and found to be:

Figure 4: First derivative absorption spectra of GEM (____) and acid degradation products (- - - -), concentration of each is 6 μg mL-1 using methanol as a solvent.
1DGEM=0.0585 C+0.014(r=0.9997).
1D: Peak amplitude of first derivative; C: Concentration (μg mL-1); r: Correlation coefficient.
1DD method
1DD values showed good linearity and reproducibility at a peak 273.0 nm and a trough 284.0 nm without interference from its acid degradation products Figure 5. Linearity of the peak amplitudes of the 1DD curves at both wavelengths was obtained in the range of 2-12 μg mL-1 and the regression equations were computed as shown below:

Figure 5: 1DD-Ratio spectra of intact GEM (A) and GEM acid degradation products (B) using a spectrum of 8 μg mL-1 of its degradation product as a divisor, concentration of each is 6 μg mL-1.
1DD=0.0767 C-0.0629 (r=0.9994) (273.0 nm)
1DD=0.1014 C-0.0656 (r=0.9996) (284.0 nm)
Where,
1DD: peak amplitude of first derivative of the ratio spectra.
C: Concentration (μg mL-1); r: Correlation coefficient.
Dual wavelength method
Dual wavelength method copes with the level of interference when the spectra as strongly overlapped as shown in Figure 3, it uses the analytical signal data at two accurately selected wavelengths, thus appropriate selection, thus appropriate selection of wavelength pair is very important. To select the appropriate wavelength pair, the following principles were applied: at the selected wavelengths, the difference in analyte signals had to be linear while the difference in interferent signal is remaining zero with changing the concentration. In addition, the analytical signal obtained from a mixture of the analyte and the interferent should be equal to the sum of the individual signals of the two species. Also, the difference in absorbance due to the analyte signal at the two selected wavelengths should be as large as possible in order to reach good accuracy and sensitivity [26].
To optimize the method, different pairs of wavelengths were selected and tried to show zero absorbance difference for the GEM acid degradation products with maximum difference in absorbance due to GEM, 271.8 nm and 325.0 nm were selected for the determination of GEM, where the acid degradation product shows the same absorbance. A linear Calibration curve was obtained in the range (2-12 μg mL-1) relating the difference between the absorbance at the two selected wavelengths 271.8 nm and 325.0 nm to the corresponding drug concentrations in presence of acid degradation product and the regression equation was calculated and found to be:
ΔPGEM=0.0581 C-0.0253 (r=0.9998)
Where, ΔP: Absorbance difference at the two selected wavelengths (271.8 and 325.0 nm).
C: Concentration (μg mL-1); r: Correlation coefficient.
Ratio difference spectrophotometric method
A smart ratio-difference method has been developed recently with the advantages of minimal data processing and wide range of application, in addition to the advantages of ratio spectra manipulation [27], Figure 6. The linear regression data for the calibration curve showed a good linear relationship over a concentration range of 2-12 μg mL-1 and the regression equation was computed and found to be:

Figure 6: The ratio spectrum of 5 μg mL-1 intact GEM (__), 8 μg mL-1 GEM acid degradation products ( ) and a mixture containing 5 μg mL-1 intact GEM and 5μg mL-1 acid degrades (- - - -) using a divisor of 8 μg.mL-1 degrades in methanol.
ΔP=0.7113 C+0.0927 (r=0.9996) Where,
ΔP: Absorbance difference at the two selected wavelengths.
C: Concentration (μg mL-1); r: Correlation coefficient.
Bivariate calibration method
GEM was also determined and resolved from its acid degradation products by using bivariate calibration spectrophotometric method, which is based on a simple mathematical algorithm. The method has been successfully applied to resolve different binary mixtures [28,29], in which the data is used derives from four linear regression calibration equations, two calibrations for each component at two wavelengths selected using the method of Kaiser [30], which was used for the selection of optimum wavelength set which assured the best sensitivity for the quantitative determination of the studied drug. In order to apply this method, the signals GEM and its acid degradation products located at six wavelengths: 255.0, 270.0, 277.0, 310.0, 320.0, and 340.0 nm were selected.
for the quantitative determination of the studied drug. In order to apply this method, the signals GEM and its acid degradation products located at six wavelengths: 255.0, 270.0, 277.0, 310.0, 320.0, and 340.0 nm were selected.
Method validation
Method validation is an integral part of the analytical procedure; therefore full validation study was done for each proposed method. Analytical figures of merits were applied in agreement with ICH guidelines [31] by measuring range, accuracy, precision, repeatability, interday precision, linearity, application of dosage form, application of standard addition technique and specificity. Results obtained are depicted in Tables 3-5.
| ?1/?2 |
255.0 |
270.0 |
277.0 |
310.0 |
320.0 |
340.0 |
| 255.0 |
0 |
1353.56 |
1563.48 |
-27.84 |
87.02 |
524.82 |
| 270.0 |
|
0 |
538.98 |
-520.26 |
-531.05 |
-217.23 |
| 277.0 |
|
|
0 |
-589.86 |
-648.06 |
-459.9 |
| 310.0 |
|
|
|
0 |
44.37 |
206.19 |
| 320.0 |
|
|
|
|
0 |
191.94 |
| 340.0 |
|
|
|
|
|
0 |
Table 1: Application of the method of Kaiser for the selection of the wavelength set for the determination of GEM.
| Proposed Method |
Calibration equations |
| 1D |
1D=0.0585 C+0.0140 |
(r =0.9997) |
| 1DD |
273.0 nm |
1DD=0.0767 C-0.0629 |
(r =0.9994) |
| 284.0 nm |
1DD=0.1014 C-0.0656 |
(r=0.9996) |
| Dual-wavelength |
?P =0.0581 C–0.0253 |
(r=0.9998) |
| Ratio-difference |
?P=0.7113 C+0.0927 |
(r=0.9996) |
| Bivariate |
|
GEM |
Degradates |
| |
?1=255.0nm |
A=0.0500C+0.0163, r=0.9992 |
A=0.0234C+0.0151, r=0.9992 |
| ?2=277.0nm |
A=0.0822C-0.0378, r=0.9992 |
A=0.0072C+0.0041, r=0.9997 |
1D: Peak amplitude of first derivative.
1DD: Peak amplitude of first derivative of the ratio spectra.
?P: Absorbance difference at the two selected wavelengths.
A: Absorbance at the selected wavelength.
C: Concentration in µg mL-1; r: Correlation coefficient.
Table 2: Linear regression calibration formulae used for the determination of gemifloxacin by the proposed methods in concentration range of (2-12 µg mL-1).
| Validation parameters |
D1-method 254.6 nm |
1DD-method |
Dual wavelength method |
Ratio difference method |
Bivariate method |
| 273.0 nm |
284.0 nm |
255.0 nm |
277.0 nm |
| Accuracy ( mean ± % RSD) |
99.67 ± 0.799 |
99.91 ± 0.829 |
100.01 ± 0.304 |
100.29 ± 1.107 |
99.97 ± 0.637 |
99.87 ± 1.254 |
| Specificity ± %RSD |
99.67 ± 0.689 |
100.32 ±0.796 |
99.75 ± 0.730 |
99.53 ± 0.399 |
101.23 ± 1.360 |
100.14 ± 1.533 |
| Precision |
Repeatability* |
0.381 |
0.276 |
0.720 |
0.215 |
0.562 |
1.102 |
| Intermediate Precision** |
0.714 |
1.072 |
0.924 |
0.326 |
1.247 |
1.241 |
| LOD (µg.mL-1)*** |
0.282 |
0.425 |
0.348 |
0.253 |
0.355 |
?1=0.356, ?2=0.355 |
| LOQ (µg.mL-1)*** |
0.853 |
1.288 |
1.053 |
0.765 |
1.076 |
?1=1.078, ?2=1.076 |
*The intra-day (n=9), average of three different concentrations repeated three times within the day.
**The inter-day (n=9), average of three different concentrations repeated three times in three successive days.
***Limit of detection and quantitation are determined via calculations, LOD=(SD of the response/slope) × 3.3; LOQ=(SD of the response/slope) × 10
Table 3: Results of validation parameters of the responses and the regression equations obtained by the proposed methods.
| Sample |
D1-method (n=6)b |
1DD-method |
Dual wavelength Method (n=6)b |
Ratio difference method (n=6)b |
Bivariate calibration method (n=8)b |
| |
|
273 nm (n=8)b |
284 nm (n=7)b |
| L.P. mixtures (Mean ± SD) |
99.67 ± 0.687 |
100.32 ± 0.799 |
99.75 ± 0.728 |
99.53 ± 0.397 |
101.23 ± 1.363 |
100.14 ± 1.535 |
| Factive® tablet BN:005 (Mean ± %RSD) |
100.21 ± 1.178 |
100.10 ± 1.941 |
100.29 ±1.917 |
99.03 ± 0.893 |
99.15± 1.349 |
99.73 ±1.895 |
| Standard addition (Mean ± %RSD) |
100. 66 ± 1.010 |
99.51 ± 1.221 |
100.04 ± 1.131 |
99.96 ± 1.116 |
100.21±1.593 |
99.40 ± 0.817 |
bSets each of 3 replicates
Table 4: Determination of the studied drug in the laboratory prepared (L.P.) mixtures with its degradation products and in tablets by the proposed methods.
Conclusion
The proposed methods are accurate, precise and reproducible. They are stability-indicating methods. These methods complied with the validation guidelines of the International Conference on Harmonization and could be used for purity testing, stability studies, quality control, and routine analysis of GEM either in its bulk powder or in dosage form without noticeable interference from other common dosage form additives. The obtained results were statistically nonsignificant when they have been compared with those of the reference method
6633
References
- (2006) Merck index, an encyclopedia of chemicals, drugs and biological, (14thedn), USA.
- David S Wishart, DrugBank: a knowledgebase for drugs, drug actions and drug targets
- Sweetman SC, Martindale (2011) (The complete drug reference), (37thedn), The pharmaceutical press, London.
- Ambadas RR, Sunita PP (2010) Validated UV-Spectrophotometric Methods for Determination of Gemifloxacin Mesylate in Pharmaceutical Tablet Dosage Forms. J Chem 7: S344-S348.
- El-Didamony AM, Abo-Elsoad MO (2013) Kinetic spectrophotometric method for the determination of some fourth generation fluoroquinolones in bulk and in pharmaceutical formulations. Journal of Saudi Chemical Society.
- Paim CS, Fuhr F, Miron DS, Steppe M, Schapoval EES (2014) Highly Selective Colorimetric Method to Determine Gemifloxacin Mesylate in the Presence of a Synthetic Impurity. J AOAC Int 97: 94-98.
- Gouda AA, Amin AS, El-Sheikh R, Yousef AG (2014) Spectrophotometric Determination of Gemifloxacin Mesylate, Moxifloxacin Hydrochloride, and Enrofloxacin in Pharmaceutical Formulations Using Acid Dyes. J Anal Methods Chem 286379.
- Zhong WY, Wang Y, Huang B, Shu C, Fenxi GYG (2012) The quantification of gemifloxacin by fluorescence quenching method using chitosan-coated CdTe quantum dots. Guang Pu Xue Yu Guang Pu Fen Xi 32: 1570-1574.
- Roy B, Das A, Bhaumik U, Sarkar AK, Bose A, et al. (2010) Determination of gemifloxacin in different tissues of rat after oral dosing of gemifloxacin mesylate by LC–MS/MS and its application in drug tissue distribution study. J Pharm Biomed Anal 52: 216-226.
- Doyle E, Fowles SE, McDonnell DF, McCarthy R, White SA (2000) Rapid determination of gemifloxacin in human plasma by high-performance liquid chromatography–tandem mass spectrometry. J Chromatogr B Biomed 746: 191-198.
- Szultka M, Krzeminski R, Walczak J, Jackowski M, Buszewski B (2014) Pharmacokinetic study of amoxicillin in human plasma by solid-phase microextraction followed by high-performance liquid chromatography–triple quadrupole mass spectrometry. Biomed Chromatogr 28: 255-264.
- Raju B, Ramesh M, Borkar RM, Padiya R, Banerjee SK, et al. (2012) Development and validation of liquid chromatography–mass spectrometric method for simultaneous determination of moxifloxacin and ketorolac in rat plasma: application to pharmacokinetic study. Biomed Chromatogr 26: 1341- 1347.
- Robledo VR, Smyth WF (2008) A study of the analytical behaviour of selected new molecular entities using electrospray ionisation ion trap mass spectrometry, liquid chromatography, gas chromatography and polarography and their determination in serum at therapeutic concentrations. Analytica Chimica Acta 623: 221-230.
- Rote AR, Pingle SP (2009) Reverse phase-HPLC and HPTLC methods for determination of gemifloxacin mesylate in human plasma. J Chromatogr B Analyt Technol Biomed Life Sci 877: 3719-3723.
- de Araujo BV, Laureano JV, Grunspan LD, Costa TD, Tasso L (2013) Validation of an efficient LC-microdialysis method for gemifloxacin quantitation in lung, kidney and liver of rats. J Chromatogr B Analyt Technol Biomed Life Sci 919- 920: 62-66.
- Rao RN, Naidu CG, Prasad KG, Padiya R, Agwane SB (2012) HPLC Group, Analytical Chemistry Division, Discovery Laboratory Indian Institute of Chemical Technology. Biomed Chromatogr 26: 1534-1542.
- Grunspan LD, Kaiser M, Hurtado FK, Costa TD, Tasso L (2012) Laboratorio de Famacologia e Fisiologia, Curso de Farmacia Universidade de Caxias do Sul. Chromatographia 75: 253-262.
- Kaiser M, Grunspan LD, Costa TD, Tasso L, Curso Farm (2011) Lab. Fisiol. Farmacol. UCS, 95020-972, Caxias do Sul, RS, Brazil. J Chromatogr B Analyt Technol Biomed Life Sci 879: 3639-3644.
- Rao RN, Naidu CG, Prasad KG, Narasimha R, (2011) Development and validation of a RP-HPLC method for stability-indicating assay of gemifloxacin mesylate including identification of related substances by LC-ESI-MS/MS, 1H and 13C NMR spectroscopy. Biomed Chromatogr 25: 1222-1229.
- Al-Hadiya BMH, Khady AA, Mostafa GAE (2010) Validated liquid chromatographic-fluorescence method for the quantitation of gemifloxacin in human plasma. Talanta 83: 110-116.
- Ranjane PN, Gandhi SV, Kadukar SS, Bothara KG (2010) Stability Indicating RP-LC Method for the Determination of Gemifloxacin Mesylate. Chromatographia 71: 1113-1117.
- Hyun MH, Han SC, Cho YJ, Jin JS, Lee WJ (2002) Liquid chromatographic resolution of gemifloxacin mesylate on a chiral stationary phase derived from crown ether. Biomedical Chromatography 16: 356-360.
- Lee W, Hong CY (2000) Direct liquid chromatographic enantiomer separation of new fluoroquinolones including gemifloxacin. J Chromatogr 879: 113-120.
- Hyun MH, Han SC (2002) Liquid chromatographic separation of the enantiomers of fluoroquinolone antibacterials on a chiral stationary phase based on chiral crown ether. J Biochem Biophys Methods 54: 235-243.
- Choi HJ, Cho HS, Han SC, Hyun MH (2009) HPLC of fluoroquinolone antibacterials using chiral stationary phase based on enantiomeric (3,3-diphenyl-1,1-binaphthyl)-20-crown-6. J Sep Sci 32: 536-541.
- Campins-Falco P, GoMez BF, Bosch-Reig F (1998) The H-point and generalized H-point standard additions methods for flow injection procedures. Talanta 47: 193-202.
- Elzanfaly ES, Saad AS, Abd Elaziz B. Abd Elaleem (2012) A smart simple spectrophotometric method for simultaneous determination of binary mixtures. J Pharm Anal 2: 382-385.
- Lopez-Martinez L, Lopez-de-Alb PL, Creda-Martin V (2001) Bivariate Calibration as an Alternative for Zero-Crossing Technique in the Resolution of Binary Mixtures by Derivative Spectrophotometry. Anal Lett 34: 2563-2863.
- Lopez-de-Alba PL, Wrobel K, Lopez-Martinez L, Yepez-Murrieta ML, Amador- Hernandez J (1997) Rapid and simple determination of methamphetamine and amphetamine in blood by simultaneous extraction-derivatization. J Pharm Biomed Anal 16: 349-352.
- Massart DL, Vandeginsite BGM, Deming SN, Michotte Y, Kaufman L (1988) Chemometrics: a textbook, Elsevier, Amsterdam. 124.
- International Conference on Harmonization (ICH) (2005) ICH Harmonized Tripartite Guideline. Topic Q2(R1). Validation of Analytical Procedures: Text and Methodology. Geneva, Switzerland.