Hesham A El-Beshbishy1,2*, Hesham M El-Refaey3, Hasan S Al-Amry4, Rabab A Ali5,6,7, Mohammed A Hassanien7,8 and Ramadan A Saad9,10,11
1Medical Laboratory Sciences Department, Fakeeh College for Medical Sciences, Jeddah, Saudi Arabia
2Biochemistry Department, Al-Azhar University, Nasr City, Cairo, Egypt
3Pharmacology and Toxicology Department, Al-Azhar University, Nasr City, Cairo, Egypt
4Psychaitry Department, King Khalid University, Abha, Saudi Arabia
5Clinical Laboratories Sciences Department, College of Applied Medical Sciences, Taibah University, Madina, Saudi Arabia
6Genetic Unit, Children Hospital, Mansoura University, Egypt
7Biochemistry Department, Mansoura University, Egypt
8Director of MBBS program, Fakeeh College for Medical Sciences, Jeddah, Saudi Arabia
9Medical Biochemistry Department, College of Medicine, Tanta University, Egypt
10Physiology Department, Ain Shams University, Abbassia, Cairo, Egypt
11Physiological Sciences Department, Fakeeh College for Medical Sciences, Jeddah 21461, Saudi Arabia
Corresponding Author:
Prof. Hesham A. El-Beshbishy
Medical Laboratory Sciences Department
Fakeeh College for Medical Sciences
Jeddah 21461, Saudi Arabia
Tel: +966 50 876 1883
E-mail: hesham_elbeshbishy@hotmail.com
Received Date: Dec 18, 2018; Accepted Date: Dec 30, 2018; Published Date: Jan 05, 2019
Citation: El-Beshbishy HA, El-Refaey HM, Al-Amry HS, Ali RA, Hassanien MA, et al. (2019) Targeting Mitochondrial Biogenesis in Rat Brain for Treatment of Depression. J Biomedical Sci Vol.8 No.1:1. doi:10.4172/2254-609X.100097
Copyright: © 2019 El-Beshbishy HA, et al. This is an open-access article distributed under the terms of the Creative Commons Attribution License, which permits unrestricted use, distribution, and reproduction in any medium, provided the original author and source are credited.
Keywords
Antidepressants; Brain; Dynamin-related protein (Drp-1); Fission-1 protein (Fis-1); Brain-derived neurotrophic factor (BDNF); Tyrosine kinase-B (Trk-B) receptor
Introduction
Targeting mitochondrial mechanisms are implicated for studying psychiatric disorders [1]. The Brain-Derived Neurotrophic Factor (BDNF), Dynamin-Related Protein-1 (Drp-1), Tyrosine Kinase Receptor-B Protein (Trk-B), and Fission-1 Protein (Fis-1) proteins are neurotrophins that share common target gene of antidepressant treatment via regulation of synaptic plasticity [2]. Antidepressant effect of BDNF is due to the discharge of BDNF into midbrain of depressed animals, through binding with its receptor, Trk-B protein [3].
Mitochondria function is remodeled by fission of individual mitochondria and the fusion of different mitochondria [4]. The Drp-1 is present in the cytoplasm and includes GTPase and GTPase effector domains. Fis-1 is existed in outer mitochondrial membrane and composed of 6 antiparallel helices protein with 4 central helices containing 2 tandem tetratricopeptide repeats motifs [4]. Patients with depression exhibited decreased mitochondrial ATP production rate associated with a decrease in mitochondrial proteins and increased mtDNA mutations [5].
We were interested in studying mitochondria involvement in pathogenesis and treatment of depression through investigating the molecular link between depression, mitochondrial activity, and mitochondrial biogenesis and thereby correlating outcomes to effects of antidepressant drugs towards a molecular link between neurotrophic factors and changes in mitochondrial biogenesis in rat pre-and post-antidepressant treatments.
Materials and Methods
ATP percentage production was estimated using bioluminescent somatic cell assay kit (Sigma Aldrich®-USA). Antibodies and protease inhibitor cocktail were purchased from Santa Cruz Biotechnology® (USA) and Roche® (Switzerland); respectively. β-actin gene and anti-actin antibodies were purchased from TIBMOLBIOLs® (Germany). Protein assay kit and semi-dry gel transfer system (Bio-Rad® laboratories- USA) were used. The BDNF quantitative EIA kit was supplied by Quantikine® (R and D systems, USA). The Drp-1, Trk-B receptor and Fis-1 quantitative EIA kits were purchased from MyBiosource® (USA). Total Antioxidant Status (TAS) kit was purchased from Randox® (UK). This study was conducted in accordance with local research ethics committee of Taibah University, Saudi Arabia under number TUCDREC/20110068 and regulations stated in the declaration of Helsinki.
To induce Learned Helplessness (LH) depression model; rats were exposed to inescapable electrical shocks and placed in one side of clear plexiglass restraining tubes shuttle box supplied with electrified floor grid (MedAssociates, USA) divided into 2 equal rooms by rigid plastic divider [6]. Restriction brackets made of wire racks coated with plastic that set in place 2 cm above rat dorsal surface to movement though limiting frequency of jumping when rat placed inside the room. The shock was delivered from constant-current shock generators (1.0 mA) to electrodes provided with electrode paste to the rat's tail. Each shock had duration of 15 sec with interval periods between 30 and 90 sec over a period of 3 hrs. The inescapable shock session comprised 100 5-secs, A 1.0 mA shocks delivered on 1-min interval schedule. At the start of each shuttle box session, rats were exposed to a 5 min habituation period in the same chamber where Inescapable Shock (IS) or Escapable Shock (ES) was applied, followed by 30 escape trials in which gate separating the two halves of the shuttle box opened 5 sec prior to shock onset. Randomized foot shocks were transmitted at an intensity of 0.6 mA for 30-sec duration of escape latency.
Sixty-four healthy adult male Sprague-Dawley rats weighing 180 ± 20 gm were housed singly in polyethylene cages and transferred to clear plexiglass restraining tubes during the experiment. Rats were divided into 8 groups (n=8). Group 1: Control rats received 0.2 ml 0.9% saline (i.p.) for 2 weeks; Group 2: Rats received 0.2 ml 0.9% saline (i.p.) for 2 weeks and exposed to chronic inescapable shock in clear plexiglass restraining tubes for 1 hr/day over 2 weeks and then tested for LH model. These rats are nominated as depressed (DEP)-rats; Group 3, 4, 5: Rats received 20 mg/kg/day fluoxetine (FLX), imipramine (IMP) or citalopram (CTL); respectively in normal saline (i.p.) for 2 weeks without stress and Group 6, 7, 8: DEPrats received FLX, IMP or CTL; respectively and tested for LH model. At end, rats were under food deprivation overnight prior to sacrifice and were decapitated 24 hours after last dose and brain was isolated, get mitochondrial homogenate for biochemical analysis, %ATP production, Lipid Peroxides (LPOs) expressed as Thiobarbituric Acid Reactive Substance (TBARS), TAS, BDNF, Drp-1, Fis-1 and Trk-B receptor proteins. Protein expression of brain BDNF, Drp-1, Fis-1 and Trk-B for different groups were estimated.
The gray matter was homogenized according to protocol [7]. Protein concentration was ~20-45 ng/ml and stored at 4°C for only 4 days to ensure mitochondria activity. Estimation of rat mitochondrial brain enzymes; Succinate Dehydrogenase SDH (nmol formazan formed/min/mg protein) [8], Malate Dehydrogenase (MDH), Isocitrate Dehydrogenase (IDH) (nmol NADH oxidized/min/mg protein) [9,10] and monoamine oxidase MAO (nmol benzaldehyde formed/min/mg protein) [11], were measured.
Estimation of rat brain mitochondrial percentage ATP production was carried out [12]. %ATP production=ATP sample (moles) × ATP standard (moles)/light emitted by both sample and standard-light emitted by the sample.
Measurement of rat brain mitochondrial LPOs (nmol TBARS/mg brain mitochondrial protein) was done [13]. Superoxide dismutase SOD (U/mg mitochondrial protein) [14] and brain mitochondrial TAS was measured [15].
Rat brain mitochondrial BDNF (pg/ml), Drp-1 (ng/ml), Trk-B (pg/ml) and Fis-1 (ng/ml) proteins were measured according to manufacturer protocol. Protein expression of BDNF, Drp-1, Fis-1, and Trk-B were determined using Western blotting analysis. The apparent molecular weights of ~13, 82, 17 and 100 KDa, for BDNF, Drp-1, Fis-1, and Trk-B; respectively, were estimated. Actin was used as a control. Blots were probed with a β-actin antibody (1:300) as an internal control.
Statistical significance determined by ANOVA test (P=0.05 or lower were considered statistically significant) using GraphPad Prism 5 software (USA). Linear regression analysis was made between different parameters.
Results and Discussion
We generated LH depression model in rats. Rats were treated with CTL, IMP or FLX and exposed to non-escapable shock showed increase mean escape latencies. Mean escape latency time for 5 FR-1 (fixed ratio-1) trials and 25 FR-2 trials were showed in Tables 1 and 2. FR-2 mean latencies decreased significantly in rats received non-escapable shock after treatment with IMP, FLX or CTL (Table 1). Analysis of FR-1 means escape latencies of tested animals showed insignificant differences among treated rats, suggesting that treatment with FLX, IMP or CTL had no effect on mean escape latency times (Table 1). The FR-2 means were used to screen rats whether LH or NLH after they received tail shock stress. Rat received an electric shock and elicited mean FR-2 escape latency more than 2 standard deviations (SDs) higher than control FR-2 escape latency average was considered as helpless. NLH rats had a mean FR-2 escape latency records that were less than 1 SD from the average FR-2 means of control (Table 2). Rats elicited FR-2 mean escape latency records that lied between 1 and 2 SDs greater than control were omitted from statistical analysis of achieved data due to the difficulty to classify rats as LH or NLH (Table 3). The order of decreasing number of LH was:- CTL>IMP>FLX (Table 3). The rats received FLX and IMP were considered helpless indicated that two-week treatment was not enough to ameliorate helpless behaviour (Table 3). Similarly, other investigator reported that not all animals that undergo non-escapable shock associated with high mean escape latencies became LH [16].
| Treatment |
Average FR-1 mean (sec) |
SD |
Average FR-2 mean (sec) |
SD |
| Saline |
11 |
8 |
24.2 |
7.1 |
| FLX |
9.8 |
7.4 |
10.8* |
7.4 |
| IMP |
9.3 |
7.2 |
12.3* |
8.1 |
| CTL |
9.6 |
7.5 |
15.6** |
7.8 |
Note: *p<0.05, **p<0.01, significant change difference in average FR-1 or FR-2 means compared with control
Table 1: Learned helplessness (LH) depression model-Mean FR-1 and FR-2 latencies (seconds) of rats (n=8) exposed to nonescapable tail chock.
| Treatment |
Average FR-1 mean (sec) |
Average FR-2 mean (sec) |
SD |
Classification |
| |
|
|
|
LH |
NLH |
| Saline |
4.1 |
7.1 |
0.4 |
>7.5 |
<6.9 |
| FLX |
3.1 |
6.5 |
0.7 |
>8.5 |
<7.0 |
| IMP |
2.6 * |
5.9 |
0.5 |
>9.2 |
<8.5 |
| CTL |
2.2** |
5.4 |
0.3 |
>7.7 |
<6.8 |
Note: *p<0.05, **p<0.01, significant change difference in average FR-1 or FR-2 means compared with control
Table 2: Learned helplessness (LH) depression model- Mean FR-1 and FR-2 times of tested rats (n=8) for determination of LH and non-learned helplessness (NLH) behaviour.
| Group treatment |
No. of LH rats |
No. of NLH rats |
No. of rats between 1 and 2 SD |
Total rats number |
| Saline |
12 |
1 |
3 |
16 |
| FLX |
8 |
10 |
1 |
19 |
| IMP |
6 |
8 |
1 |
15 |
| CTL |
4 |
6 |
1 |
11 |
Table 3: Learned helplessness (LH) depression model-LH and NLH numbers for each tested rat (n=8) received a non-escapable shock and treated with saline, fluoxetine (FLX), imipramine (IMP) or citalopram (CTL).
SDH showed a significant decline by -22.4% in case of DEPrats. CTL DEP-rats showed a significant increase in SDH by +27.7%. Neither intake of FLX nor IMP to DEP-rats produced a significant change in SDH (Figure 1A). MDH showed a significant decline by -42.7% in case of DEP-rats. FLX, IMP or CTL intake to DEP-rats showed significant increase in MDH by +32.9%, +40.2% and +68.4%, respectively (Figure 1B). IDH showed a significant decline by -28.4% in case of DEP-rats. IMP or CTL intake to DEPrats showed a significant increase in IDH by +20.7%, +34.9%, respectively. FLX intake to the DEP-rats produced an insignificant change in IDH (Figure 1C). The NDH showed a significant decline by -39.1% in case of DEP-rats; p<0.0001. CTL DEP-rats showed a significant increase in NDH by +50%. Neither intake of FLX nor IMP to DEP-rats produced significant changes in NDH (Figure 1D). NDH showed a significant decline by -59% for DEP-rats. CTL DEP-rats showed a significant increase in MAO by +110%. Neither intake of FLX or IMP to DEP-rats produced any significant change in MAO (Figure 1E). These findings confirmed the fact that, psychiatric symptoms have been recorded in subjects with mitochondrial diseases [17]. CTL DEP-rats showed a significant increase in SDH, MDH, IDH, NDH, and MAO. IMP DEP-rats showed a significant increase in MDH and IDH. Besides, FLX DEPrats showed an only a significant increase in MDH.
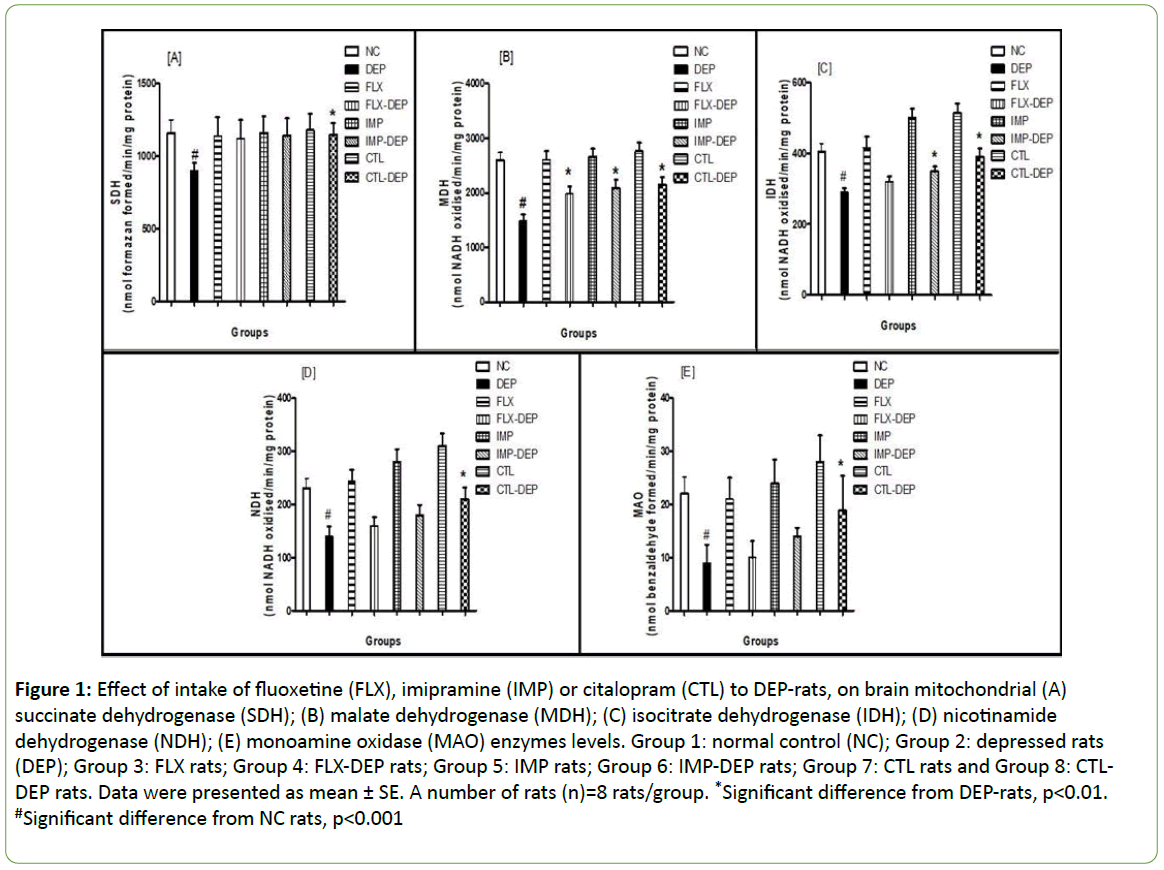
Figure 1: Effect of intake of fluoxetine (FLX), imipramine (IMP) or citalopram (CTL) to DEP-rats, on brain mitochondrial (A) succinate dehydrogenase (SDH); (B) malate dehydrogenase (MDH); (C) isocitrate dehydrogenase (IDH); (D) nicotinamide dehydrogenase (NDH); (E) monoamine oxidase (MAO) enzymes levels. Group 1: normal control (NC); Group 2: depressed rats (DEP); Group 3: FLX rats; Group 4: FLX-DEP rats; Group 5: IMP rats; Group 6: IMP-DEP rats; Group 7: CTL rats and Group 8: CTLDEP rats. Data were presented as mean ± SE. A number of rats (n)=8 rats/group. *Significant difference from DEP-rats, p<0.01. #Significant difference from NC rats, p<0.001
The percentage ATP production showed significant decrement by -40%, -35% and -33%, in P+M (pyruvate+malate), G+M (glutamate+malate) and S (succinate) substrates; respectively in case of DEP-rats. Intake FLX or IMP to DEP-rats showed a significant increase in brain %ATP production level by +16.6% and +14.8%; respectively using P+M substrate. Intake of CTL to DEP-rats resulted in increase in % ATP production by +63.3%, +30.7% and +22.4%, in P+M, G+M and S groups; respectively (Figure 2A). The intake of IMP and FLX enhanced ATP synthase activity [18], and thereby increased ATP production. The order in enhancing %ATP production levels after intake of antidepressants to DEP-rats was: FLX
LPOs level elicited significant increment by +343.7% among DEP-rats. Administration of FLX, IMP or CTL to DEP-rats showed a significant decline in TBARS by -18.2%, -27.3% and -45.5%, respectively (Figure 2B), that was in congruence with the fact that, oxidative damage may be linked to depression [19]. LPOs increment in DEP-rats reflects enrollment of oxidative damage and disruption of mitochondria [20]. LPOs increase among DEPrats subsequently initiates reactive oxygen species production, because the mitochondrial membrane is rich in polyunsaturated fatty acids and their configuration is facilitated by SOD [21]. Intake of antidepressants declines LPOs [22]. The order in decreasing LPOs after intake antidepressants to DEP-rats was: FLX
The SOD showed a significant decrease by -43% in the case of DEP-rats. Intake of IMP or CTL to DEP-rats showed a significant increase in SOD by +34% and +48.8%. Intake of FLX to DEP-rats produced no significant change in SOD (Figure 2D). It was reported that SOD was declined among depression patients and thereby strengthens oxidative damage of mitochondrial membrane due to the accumulation of superoxide radicals, which in turn inhibit antioxidant enzymes [23]. Administration of either IMP or CTL to DEP-rats showed significant increment in brain SOD.
The TAS showed a significant decline by -40% in case of DEPrats. However, TAS (mmol/L) elicited significant increment by +33.3%, +38.5% and +51.3%, for FLX-DEP, IMP-DEP and CTL-DEP, respectively (Figure 2C). TAS elicited significant increment in FLXDEP, IMP-DEP and CTL-DEP rats. It was reported that low levels of antioxidants and high LPOs were prominent in depression [24]. The order in decreasing SOD levels due to the intake of antidepressants to DEP-rats was: IMP

Figure 2: Effect of fluoxetine (FLX), imipramine (IMP) or citalopram (CTL) to DEP-rats, on (A) percentage of ATP production using (a) pyruvate+malate (b) glutamate+malate or (c) succinate; (B) thiobarbituric acid reactive substance (TBARS); (C) total antioxidant status (TAS); (D) SOD levels in rat brain mitochondria. Group 1: normal control (NC), Group 2: depressed rats (DEP), Group 3: FLX rats, Group 4: FLX-DEP rats, Group 5: IMP rats, Group 6: IMP-DEP rats, Group 7: CTL rats and Group 8: CTL-DEP rats. Data were presented as mean ± SE. The result is a duplicate/group. * A significant difference from DEP-rats, p<0.05. ** Significant difference from DEP-rats, p<0.01. # Significant difference from NC rats, p<0.05.** A significant difference from DEP-rats, p<0.05. ## Significant difference from NC rats, p<0.01.
The DEP-rats showed a significant decline in BDNF level by -45.7%. BDNF level elicited significant increment by +15%, +26%, and +63%, for FLX-DEP, IMP-DEP and CTL-DEP; respectively (Figure 3A). The low BDNF levels are linked with depression [25]. Meta-Analysis research studied BDNF during depression episodes concluded that BDNF in depression was significantly lower than control. Other mechanism showed that BDNF could be declined before the start of a depression attack [26]. On contrary, we showed that BDNF elicited significant increment for FLX-DEP, IMP-DEP and CTL-DEP rats. Similarly, elevation of BDNF after use of antidepressants was reported [27]. However, other study declared that impairment BDNF expression does not lead to depression, but affect the efficacy of antidepressants [28].
The Drp-1 showed a highly significant decline by -90% in the case of DEP-rats. Drp-1 elicited significant increment by 4, 5 and 7 folds, for FLX-DEP, IMP-DEP, and CTL-DEP; respectively (Figure 3B). Trk-B receptor showed a significant decline by -93% in the case of DEP-rats. However, Trk-B receptor elicited significant increment by 10 folds in the case of FLX-DEP (Figure 3C). Fis-1 significantly declined by 5 folds in the case of DEP-rats. Fis-1 elicited significant increment by 4, 3.3 and 4.8 folds, in the case of FLX-DEP, IMP-DEP, and CTL-DEP; respectively (Figure 3D). The results obtained from our study showed significant increment in Drp-1 and Fis-1 in FLX-DEP, IMP-DEP and CTL-DEP groups, however, Trk-B was significantly increased in the case of FLX-DEP rats. In agreement with our results, depression resulted in a significant decline in BDNF, Drp-1, Fis-1, and Trk-B. Mitochondrial fission is mediated by Drp-1 and Fis-1 proteins to regulate apoptosis through the removal of injured mitochondria [28].
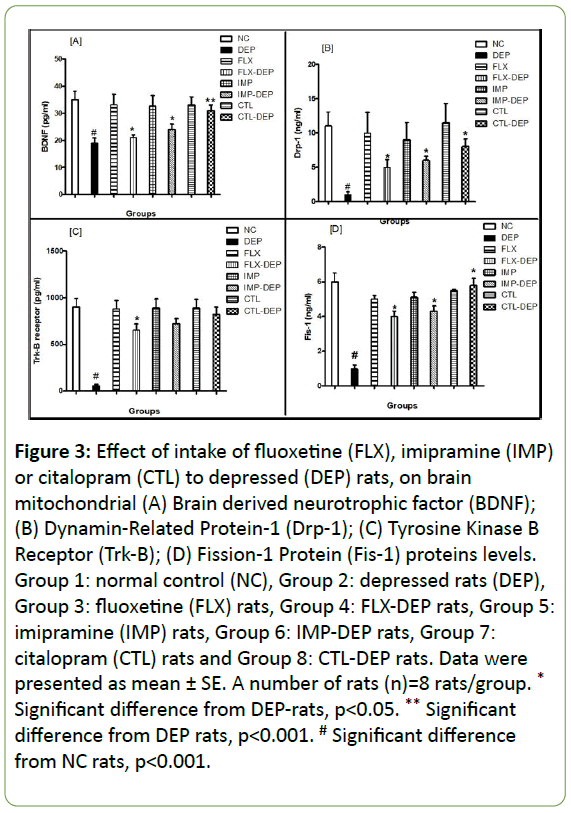
Figure 3: Effect of intake of fluoxetine (FLX), imipramine (IMP) or citalopram (CTL) to depressed (DEP) rats, on brain mitochondrial (A) Brain derived neurotrophic factor (BDNF); (B) Dynamin-Related Protein-1 (Drp-1); (C) Tyrosine Kinase B Receptor (Trk-B); (D) Fission-1 Protein (Fis-1) proteins levels. Group 1: normal control (NC), Group 2: depressed rats (DEP), Group 3: fluoxetine (FLX) rats, Group 4: FLX-DEP rats, Group 5: imipramine (IMP) rats, Group 6: IMP-DEP rats, Group 7: citalopram (CTL) rats and Group 8: CTL-DEP rats. Data were presented as mean ± SE. A number of rats (n)=8 rats/group. * Significant difference from DEP-rats, p<0.05. ** Significant difference from DEP rats, p<0.001. # Significant difference from NC rats, p<0.001.
In vitro expression of mitochondrial fission, genes lead to mitochondrial apoptosis, whereas expression of fusion genes protects cells from apoptosis [28]. Induction of depression in rats resulted in a significant decline in BDNF expression by -75% (Figure 4A and 4B). FLX, IMP or CTL intake significantly increased BDNF expression by +67%, +100% and +333%; respectively (Figure 4B). DEP-rats produced a non-significant decline in protein expression of Drp-1 by -70% (Figure 5A and 5B). Intake of FLX, IMP or CTL significantly increased Drp-1expression by +33%, +33% and +62.5%; respectively (Figure 5B). DEP-rats resulted in a significant reduction in protein expression of Fis-1 in rat brain by -60.5% (Figure 6A and 6B). Intake of FLX, IMP or CTL significantly increased Fis-1 expression by +20%, +40% and +60%; respectively (Figure 6B). DEP-rats resulted in a nonsignificant decline in protein expression of Trk-B by 15 folds (Figure 7B). Intake of FLX, IMP or CTL resulted in non-significant changes in rats Trk-B expression. Intake of FLX, IMP or CTL significantly increased Trk-B expression by 2.5, 2 and 3.5 folds; respectively (Figure 7A and 7B). Reduced levels of Drp-1 and Fis-1 proteins among DEP-rats were in accordance with another study [29].
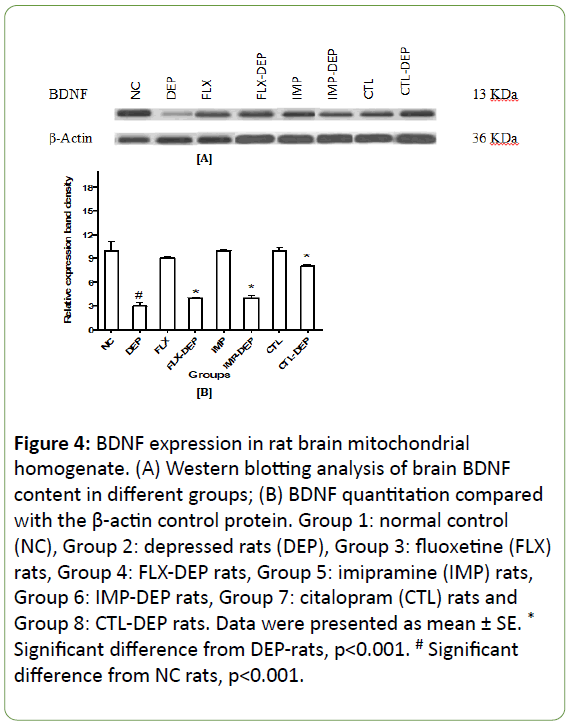
Figure 4: BDNF expression in rat brain mitochondrial homogenate. (A) Western blotting analysis of brain BDNF content in different groups; (B) BDNF quantitation compared with the β-actin control protein. Group 1: normal control (NC), Group 2: depressed rats (DEP), Group 3: fluoxetine (FLX) rats, Group 4: FLX-DEP rats, Group 5: imipramine (IMP) rats, Group 6: IMP-DEP rats, Group 7: citalopram (CTL) rats and Group 8: CTL-DEP rats. Data were presented as mean ± SE. * Significant difference from DEP-rats, p<0.001. # Significant difference from NC rats, p<0.001.
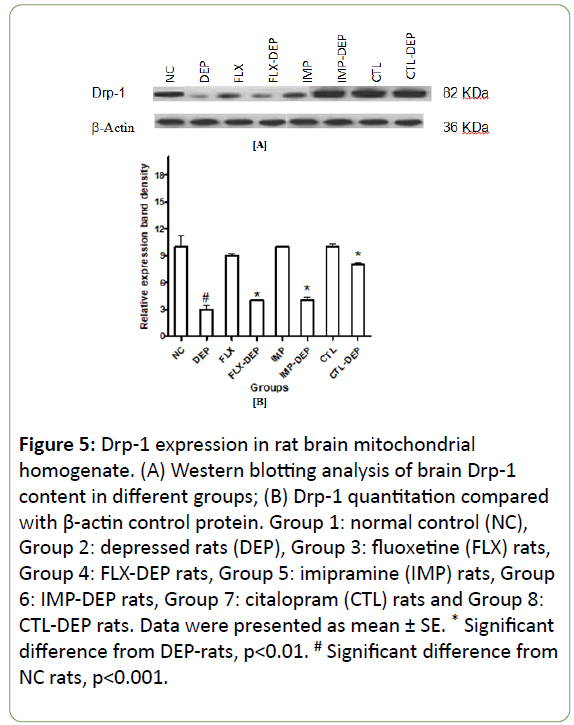
Figure 5: Drp-1 expression in rat brain mitochondrial homogenate. (A) Western blotting analysis of brain Drp-1 content in different groups; (B) Drp-1 quantitation compared with β-actin control protein. Group 1: normal control (NC), Group 2: depressed rats (DEP), Group 3: fluoxetine (FLX) rats, Group 4: FLX-DEP rats, Group 5: imipramine (IMP) rats, Group 6: IMP-DEP rats, Group 7: citalopram (CTL) rats and Group 8: CTL-DEP rats. Data were presented as mean ± SE. * Significant difference from DEP-rats, p<0.01. # Significant difference from NC rats, p<0.001.
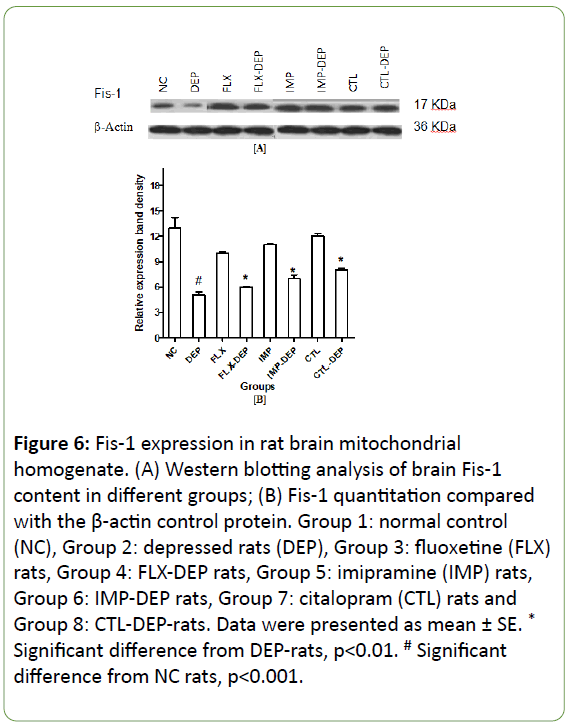
Figure 6: Fis-1 expression in rat brain mitochondrial homogenate. (A) Western blotting analysis of brain Fis-1 content in different groups; (B) Fis-1 quantitation compared with the β-actin control protein. Group 1: normal control (NC), Group 2: depressed rats (DEP), Group 3: fluoxetine (FLX) rats, Group 4: FLX-DEP rats, Group 5: imipramine (IMP) rats, Group 6: IMP-DEP rats, Group 7: citalopram (CTL) rats and Group 8: CTL-DEP-rats. Data were presented as mean ± SE. *Significant difference from DEP-rats, p<0.01. # Significant difference from NC rats, p<0.001.
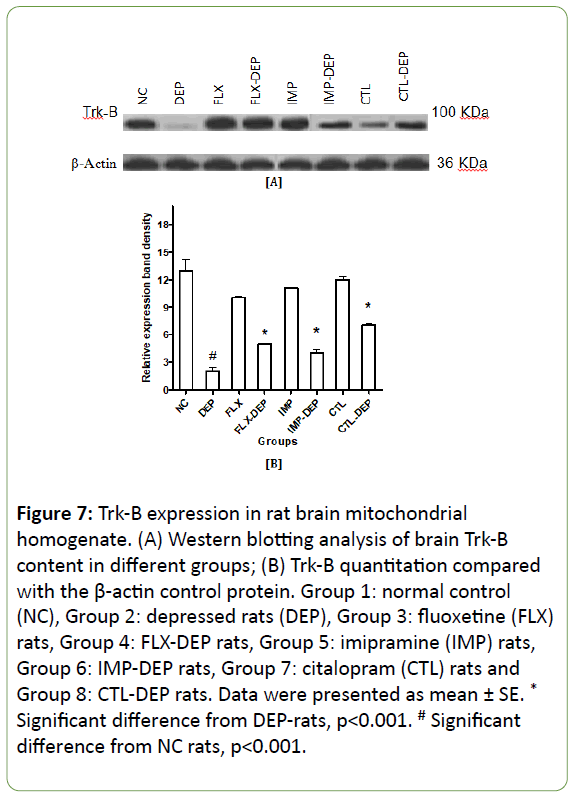
Figure 7: Trk-B expression in rat brain mitochondrial homogenate. (A) Western blotting analysis of brain Trk-B content in different groups; (B) Trk-B quantitation compared with the β-actin control protein. Group 1: normal control (NC), Group 2: depressed rats (DEP), Group 3: fluoxetine (FLX) rats, Group 4: FLX-DEP rats, Group 5: imipramine (IMP) rats, Group 6: IMP-DEP rats, Group 7: citalopram (CTL) rats and Group 8: CTL-DEP rats. Data were presented as mean ± SE. *Significant difference from DEP-rats, p<0.001. # Significant difference from NC rats, p<0.001.
Figure 8, showed linear regression analysis of TAS and: (A) BDNF and Trk-B in DEP-rats (r2=+0.887 and +0.8277; respectively). (B) Drp-1 and Fis-1 in DEP-rats (r2=+0.5317 and +0.8101; respectively). (C) BDNF and Trk-B in DEP-FLX rats (r2= +0.8498 and +0.5823; respectively). (D) Drp-1 and Fis-1 in DEPFLX rats (r2= +0.8412 +0.9002; respectively). (E) BDNF and Trk-B in DEP-IMP rats (non-significant). (F) Drp-1 and Fis-1 in DEP-IMP rats (r2= +0.9297 and +0.932; respectively). (G) BDNF and Trk-B in DEP-CTL rats (non-significant). (H) Drp-1 and Fis-1 in DEP-CTL rats (r2=+0.7553 and +0.5833; respectively). Strong correlations were showed between TAS and above parameters in all groups except in case of Trk-B in DEP-IMP and DEP-CTL rats. Our data elucidated correlation between antioxidant status and activation of mitochondrial biogenesis during use of antidepressants in DEP-rats.
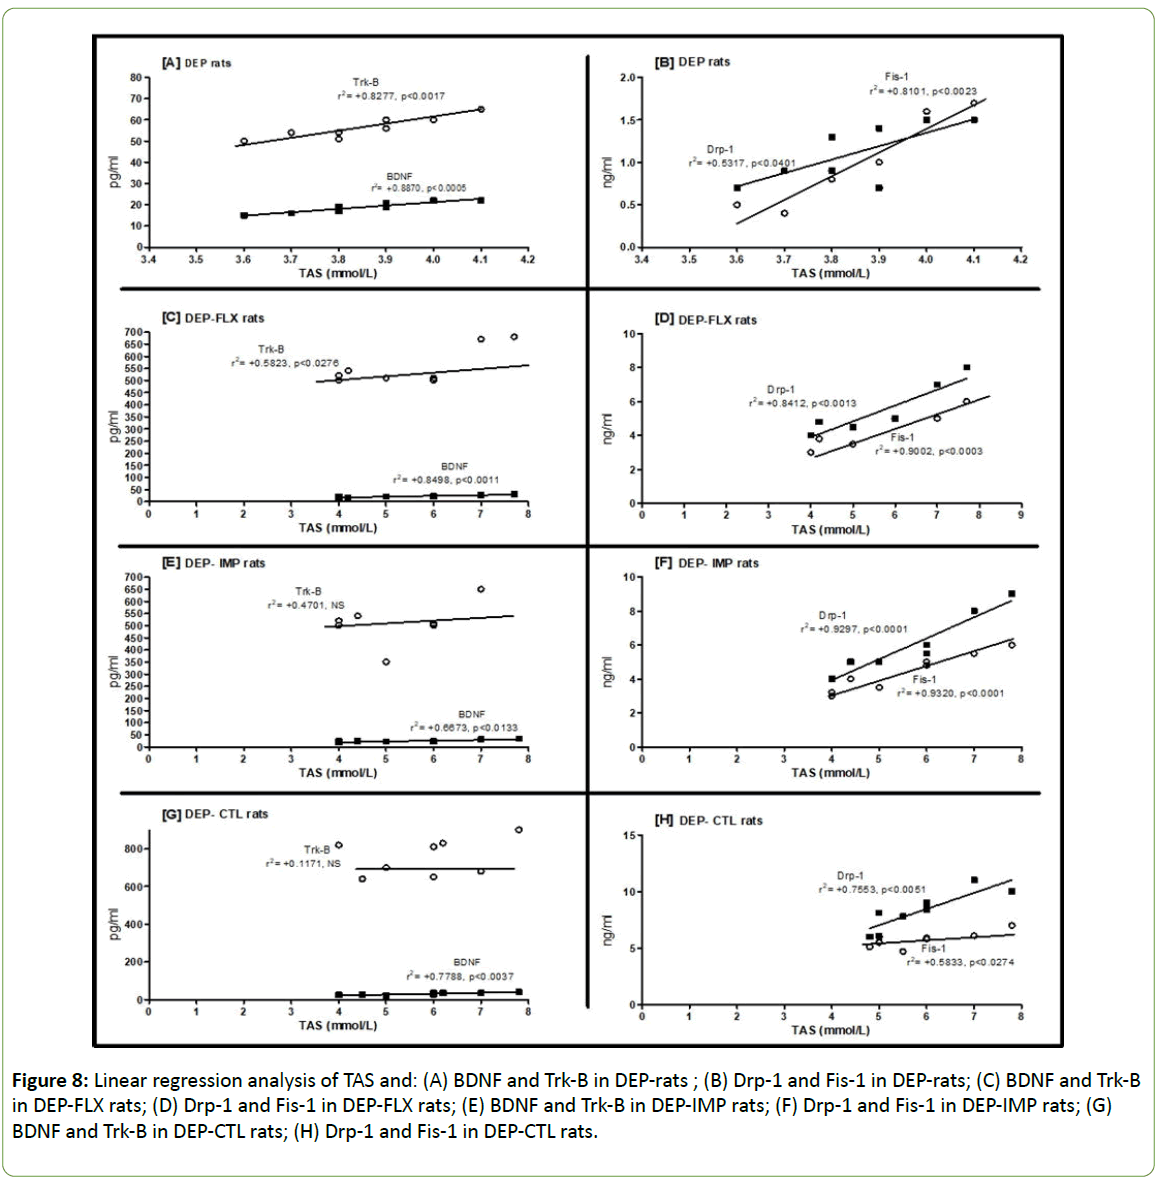
Figure 8: Linear regression analysis of TAS and: (A) BDNF and Trk-B in DEP-rats ; (B) Drp-1 and Fis-1 in DEP-rats; (C) BDNF and Trk-B in DEP-FLX rats; (D) Drp-1 and Fis-1 in DEP-FLX rats; (E) BDNF and Trk-B in DEP-IMP rats; (F) Drp-1 and Fis-1 in DEP-IMP rats; (G) BDNF and Trk-B in DEP-CTL rats; (H) Drp-1 and Fis-1 in DEP-CTL rats.
In conclusion, FLX, IMP or CTL alleviates depression in rats possibly via antioxidant mechanism and modulation of neurotrophins. We recommend studying the use of different antidepressants to gain insight density and distribution of mitochondria in brain regions.
Acknowledgment
This study was financed by a research grant (A-T-32- 90) awarded by the King Abdulaziz City of Science and Technology (KACST), Riyadh, Saudi Arabia.
23915
References
- Dietrich MO, Andrews ZB, Horvath TL (2008) Exercise-induced synaptogenesis in the hippocampus is dependent on UCP2-regulated mitochondrial adaptation. J Neuroscience 28: 10766-10771.
- Figurov A, Pozzo-Miller LD, Olafsson P, Wang T, Lu B (1996) Regulation of synaptic responses to high-frequency stimulation and LTP by neurotrophins in the hippocampus. Nature 381: 706-709.
- Dwivedi Y, Rizavi HS, Conley RR, Roberts RC, Tamminga CA, et al. (2003) Altered gene expression of brain-derived neurotrophic factor and receptor tyrosine kinase B in postmortem brain of suicide subjects. Arch Gen Psychiatry 60: 804-815.
- Berman SB, Pineda FJ, Hardwick JM (2008) Mitochondrial fission and fusion dynamics: The long and short of it. Cell Death Differ 15: 1147.
- Videbech P (2000) PET measurements of brain glucose metabolism and blood flow in major depressive disorder: A critical review. Acta Psychiatr Scand 101: 11-20.
- Vollmayr B, Henn FA (2001) Learned helplessness in the rat: improvements in validity and reliability. Brain Res Protoc 8: 1-7.
- Iglesias-González J, Sánchez-Iglesias S, Beiras-Iglesias A, Soto-Otero R, Méndez-Álvarez E (2013) A simple method for isolating rat brain mitochondria with high metabolic activity: Effects of EDTA and EGTA. J Neurosci Methods 213: 39-42.
- Srikantan TN, Krishnamurti CR (1995) Tetrazolium test for dehydrogenases. J Sci Indus Res 14: 206-209.
- Bergmeyer HU, Bernt E (1974) Methods of enzymatic analysis. (2ndedn), Verlag Chemie Weinheim and Academic Press, New York and London pp: 613-617.
- Carlier MF, Pantaloni D (1973) NADP-linked isocitrate dehydrogenase from beef liver: Purification, quaternary structure and catalytic activity. Eur J Biochem 37: 341-354.
- McEwen CM, Cohen JD (1963) An amine oxidase in normal human serum. J Lab Clin Med 62: 766-776.
- Marriage BJ, Clandinin MT, MacDonald IM, Glerum DM (2003) The use of lymphocytes to screen for oxidative phosphorylation disorders. Anal Biochem 313: 137-144.
- Buege JA, Aust SD (1978) Microsomal lipid peroxidation. Methods Enzymol 52: 302-310.
- Oynagui Y (1984) Reevaluation of assay methods and establishment of kit for superoxide dismutase. Anal Biochem 142: 290-296.
- Miller NJ, Rice-Evans C, Davies MJ, Gopinathan V, Milner A (1993) A novel method for measuring antioxidant capacity and its application to monitoring the antioxidant status in premature neonates. Clin Sci 84: 407-412.
- Malberg JE, Duman RS (2003) Cell proliferation in adult hippocampus is decreased by inescapable stress: reversal by fluoxetine treatment. Neuropsychopharmacol 28: 1562.
- Siciliano G, Tessa A, Petrini S, Mancuso M, Bruno C, et al. (2003). Autosomal dominant external ophthalmoplegia and bipolar affective disorder associated with a mutation in the ANT1 gene. Neuromuscul Disord 13: 162-165.
- Stork C, Renshaw PF (2005) Mitochondrial dysfunction in bipolar disorder: evidence from magnetic resonance spectroscopy research. Mol Psychiatry 10: 900.
- Yager S, Forlenza MJ, Miller GE (2010) Depression and oxidative damage to lipids. Psychoneuroendocrinology 35: 1356-1362.
- Milaneschi Y, Cesari M, Simonsick EM, Vogelzangs N, Kanaya AM, et al. (2013) Lipid peroxidation and depressed mood in community-dwelling older men and women. PLoS One 8: e65406.
- McDonald RJ, Berger EM, Repine JE (1991) Alveolar macrophage antioxidants prevent hydrogen peroxide-mediated lung damage. Am Rev Respir Dis 143: 01088-1091.
- Bilici M, Efe H, Köro?lu MA, Uydu HA, Bekaro?lu M, et al. (2001) Antioxidative enzyme activities and lipid peroxidation in major depression: Alterations by antidepressant treatments. J Affect Disord 64: 43-51.
- Russo AJ (2010) Increased serum Cu/Zn SOD in individuals with clinical depression normalizes after zinc and anti-oxidant therapy. Nutr Metabo Insights 3: 1-6.
- Bajpai A, Verma AK, Srivastava M, Srivastava R (2014) Oxidative stress and major depression. J Clin Diag Res 8: CC04-CC07.
- Rabie MA, Mohsen M, Ibrahim M, Mahmoud RES (2014) Serum level of brain derived neurotrophic factor (BDNF) among patients with bipolar disorder. J Affec Disord 162: 67-72.
- Fernandes BS, Gama CS, Ceresér KM, Yatham LN, Fries GR, et al. (2011) Brain-derived neurotrophic factor as a state-marker of mood episodes in bipolar disorders: A systematic review and meta-regression analysis. J Psychiatry Res 45: 995-1004.
- Watanabe K, Hashimoto E, Ukai W, Ishii T, Yoshinaga T, et al. (2010) Effect of antidepressants on brain-derived neurotrophic factor (BDNF) release from platelets in the rats. Prog Neuropsychopharmacol Biol Psychiatry 34: 1450-1454.
- Ranieri M, Brajkovic S, Riboldi G, Ronchi D, Rizzo F, et al. (2013) Mitochondrial fusion proteins and human diseases. Neurol Res Int.
- Manczak M, Reddy PH (2012). Abnormal interaction between the mitochondrial fission protein Drp1 and hyperphosphorylated tau in Alzheimer's disease neurons: Implications for mitochondrial dysfunction and neuronal damage. Hum Mol Genet 21: 2538-2547.


