Keywords
Doppler ultrasound; Hypertension; Visceral fat; Blood flow velocity; Velocity index
Introduction
Cardiovascular diseases (CVD) are mainly caused by hemodynamics dysfunction that prevents blood from flowing through cardiovascular system. This is because hemodynamics principally related to blood pressure (BP) and blood flow [1]. These BP and blood flow velocity (BFV) can be utilized for indicating an increased risk of developing CVD [2,3]. Because of BP studies are well-established compared to BFV, BP measurement devices are routinely used in hospital and healthcare facilities to assess the hemodynamics functions. Despite the reliability of BP measurements, organ health depends on sufficient oxygen delivery to all organ and that delivery depends on blood flow. Blood flow is currently measured for only a very small percentage of the patient population. Thus, BFV measurement gives additional information to evaluate health condition.
One of the well-recognized hemodynamics disorders is hypertension. Hypertension incidence has been linked to adiposity [4,5]. Obese individuals have significant adiposity, but some remain normotensive [4]. Healthy nonobese individuals with significant visceral fat (VF) were found to have hypertension [6,7]. Recently, extensive research in obesity when elucidating hypertension showed that site-specific fat accumulation is more important than total body fat [8,9]. Candra et al. demonstrated that hypertension is mainly influenced by VF accumulation compared to lower body fat and subcutaneous adipose tissue [4]. The VF is also linked to metabolic disturbances and resulting in increased risk for hypertension [8]. Excess VF are different in gender and accompanied by increasing age and changing in clinical features of metabolic variables including elevated triglyceride (TG), glucose (Glu) and reduced high density lipoprotein (HDL) [10,11]. Several studies have demonstrated that VF is associated with systemic arteriosclerosis in general population [12] and in haemodialysis patients [10]. Another study showed that high VF accumulation contributed to greater aortic stiffness in older adult as measured by pulse wave velocity [5].
Despite the acknowledgemet that VF associated to hypertension and arteriosclerosis, the extent to which VF accumulation may influence BFV measurements in particularly peak systolic (S1), second systolic (S2), insicura between systole and diastole (I), peak diastolic (D) and end-diastolic (d) velocities, velocity reflection index (VRI), vascular elastic recoil (VEI) and resistive index (RI) are not well documented. Differences of BFV in hypertensive subjects who have significant VF are also unclear. Therefore, the aim of present study is to investigate the impact of different VF level on BFV in common carotid artery (CCA) among normotensive and hypertensive subjects. We evaluated the difference between VF and blood flow features in velocity waveforms and its indices. The findings showed promising BFV reference for health assessment and early screening cardio-related health problem.
Methods
Subject characteristics
In this study, 125 subjects aged from 18 to 64 years were participated which involved 66 males and 59 females. All subjects had no medical history of hypertension and not under antihypertensive drugs. The subjects were classified into three groups according to their VF level: lower VF group (VF level < 4), middle VF group (4 ≤ VF level < 7) and higher VF group (VF level ≥ 7) based on the standard proposed in The Practical Guide Identification, Evaluation, and Treatment of Overweight and Obesity in Adult [13]. For the hypertension analysis, all subjects were further classified into three groups based on their systolic blood pressure (SBP) and diastolic blood pressure (DBP) measurements: normotensive (SBP ? 120 and DBP ≤ 80), prehypertension (120 ≤ SBP ? 140 or 80 < DBP ≤ 89) and hypertension (SBP ≥ 140 and DBP > 90) as described in the seventh report of the Joint National Committee on Detection, Evaluation, and Treatment of High Blood Pressure [14]. Exercise subjects were chosen due to their regularly aerobic exercise training (an average of 3 times/week and 1 hour/time). Subjects were recruited through various forms of advertisement. All subjects gave their written informed consent to participate. This study was reviewed and approved by the Ethics Committee of Tokushima University Hospital.
Measurement of anthropometric parameters
Body weight and VF level were measured using InnerScan body composition monitors (BC-610, Tanita, Japan). Height was measured to the nearest 0.5 cm using a stadiometer (THP-DA, Ogawa Iriki, Japan). The body mass index (BMI) was obtained by dividing the body weight by the square of the height (kg/m2). Waist circumference (WC) was measured to the nearest 0.5 cm using a 1 cm-wide measuring tape and measured in standing subjects. The CardioChek® PA cholesterol test system was used to determine lipid values including total cholesterol (TCho), low density lipoprotein (LDL), HDL, TG and Glu levels. This device was approved by United State Food and Drug Administration and Cholesterol Reference Method Laboratory Network. The SBP and DBP were measured for the left brachial artery using an automatic BP monitor (Tango, SunTech Medical, USA) in the sitting position. The mean blood pressure (MBP) and pulse pressure (PP) were calculated using DBP+(SBP-DBP)/3 and SBP-DBP respectively.
Real-time monitoring system of blood flow velocity measurement system
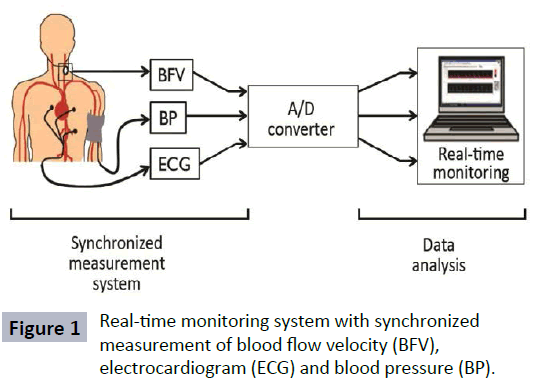
To measure BFV, we used the developed portable measurement system which consist of a probe, a Doppler signal discriminator (DSD), a transmitter, a receiver, an analog-digital converter (A/D Converter) and a personal computer [15]. This portable device has synchronized measurement system of BFV, electrocardiogram (ECG) and BP as shown in Figure 1. Blood flow velocities were determined from the Doppler-shift frequency of signals from the CCA. The signals, which included low frequency and harmonic noise, were filtered by a band-pass filter (0.1-5.0 kHz) installed in the DSD. Blood flow velocities were measured for frequencies in the same range as the band-pass filter.

Figure 1: Real-time monitoring system with synchronized measurement of blood flow velocity (BFV), electrocardiogram (ECG) and blood pressure (BP).
The velocity (Vd) was estimated from its Doppler shift frequency (fd) using Vd =c fd/ (2f0 cosθ), where c is the speed of acoustic waves in human tissue (1540 m/s), f0 is the irradiated ultrasound frequency (2.0 MHz) and θ is the Doppler insonation angle which is 50 degree. Data was transmitted using a 315-MHz FM/ FSK transmitter that have a transmission rate of 28.8 kbps and an output of ~0.5 mV/m. The data were converted into a digital signal with a sampling frequency of 10 kHz using an A/D Converter (Interface, CBI-360116TR) and then transferred to the computer for display and data analysis [15].
Characterization of velocity waveforms
The envelope waveform of the BFV was extracted using a threshold method and characterized using ensemble averaging technique. The averaged BFV waveforms were used to identify feature points in the blood velocity waveforms and calculate its indices. Blood velocities in CCA were characterized into 5 components of waveforms: S1, S2, I, D and d velocities [16]. These values were used to calculate the following velocity indices: the resistive index (RI=1-d/S1), the velocity reflection index (VRI=S2/S1-1) and the vascular elastic recoil (VEI=1-I/D) was originally used by Azhim et al. [17].
Statistical analysis
Data were expressed as mean ± standard error (SE). The differences between VF or hypertensive groups were analysed by one-way ANOVA. Correlation analysis (r-value) was performed to examine the relationship between visceral fat and age. A p-value less than 0.05 were considered statistically significant. Statistical analyses were performed using Statistical Package for the Social Sciences (SPSS) software (version 21.0, USA).
Results
The subjects were classified into three groups according to their VF measurements. Clinical characteristics of these groups are shown in Table 1. Those who have higher VF were older, commonly taller and had a greater weight compared to lower VF group. The VF had positive correlation with age (r=0.669). The average WC significantly different across the VF groups where the highest average WC (87.2 ± 6.9 cm) observed in higher VF group followed by middle VF and then lower VF group. BMI was significantly higher in the higher VF group than in the lower VF group. As the BMI increased, SBP, DBP and MBP also increased significantly (p=0.0001). In order to clarify the relationship between VF and metabolic disorders, clinical variables in the three groups were compared in Table 1. Glucose concentration and plasma triglycerides values were signi?cantly higher in the higher VF group than in the lower VF group. In contrast, the HDL was lower in the higher VF group than in the lower VF group.
Table 1: Subjects characteristics.
| Variable |
Lower VF |
Middle VF |
Higher VF |
| Age (years) |
27 ± 1 |
29 ± 2 |
43 ± 2* |
| Body mass data |
|
|
|
| Height (cm) |
161.9 ± 1.2 |
163 ± 1.1 |
169.5 ± 0.8*† |
| Weight (kg) |
51.1 ± 0.8 |
60.4 ± 0.9* |
71.4 ± 1.5*† |
| BMI (kg/m2) |
19.4 ± 0.2 |
22.6 ± 0.3* |
24.7 ± 0.4*† |
| WC (cm) |
69.6 ± 0.6 |
78.2 ± 0.8* |
87.2 ± 1.0*† |
| BP data (mmHg) |
|
|
|
| SBP |
109.8 ± 1.5 |
128.9 ± 2.6* |
147.6 ± 2.0*† |
| DBP |
68 ± 1.1 |
74.7 ± 1.6* |
85.3 ± 1.7*† |
| MBP |
109.8 ± 1.2 |
128.9 ± 1.8* |
147.6 ± 1.8*† |
| Metabolic variables (mmol/L) |
|
|
| Glu |
77.1 ± 1.9 |
78.7 ± 2.5* |
91.2 ± 2.6*† |
| TCho |
195.3 ± 7.5 |
184.4 ± 7 |
203.4 ± 6.2 |
| HDL |
78.4 ± 3.6 |
77.2 ± 8.3* |
55.6 ± 2.7*† |
| TG |
62.6 ± 4.8 |
79.4 ± 5.5* |
120 ± 10.4*† |
| LDL |
101 ± 4.9 |
92.4 ± 10.3* |
118.7 ± 4.9*† |
The data are presented as mean and SE. Tukey significances: *p<0.05 versus Lower VF group and †p<0.05 versus Middle VF group.
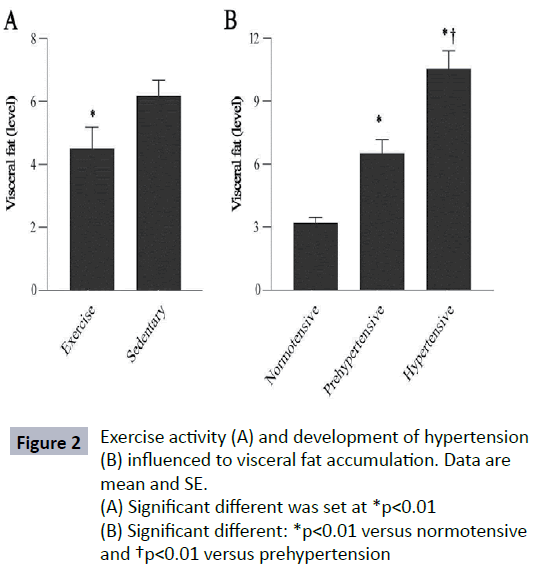
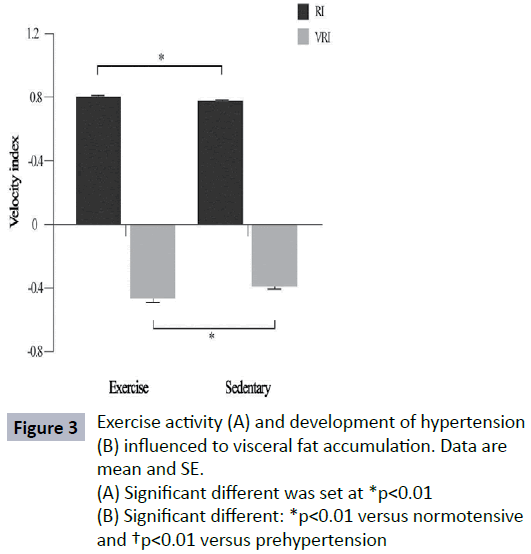
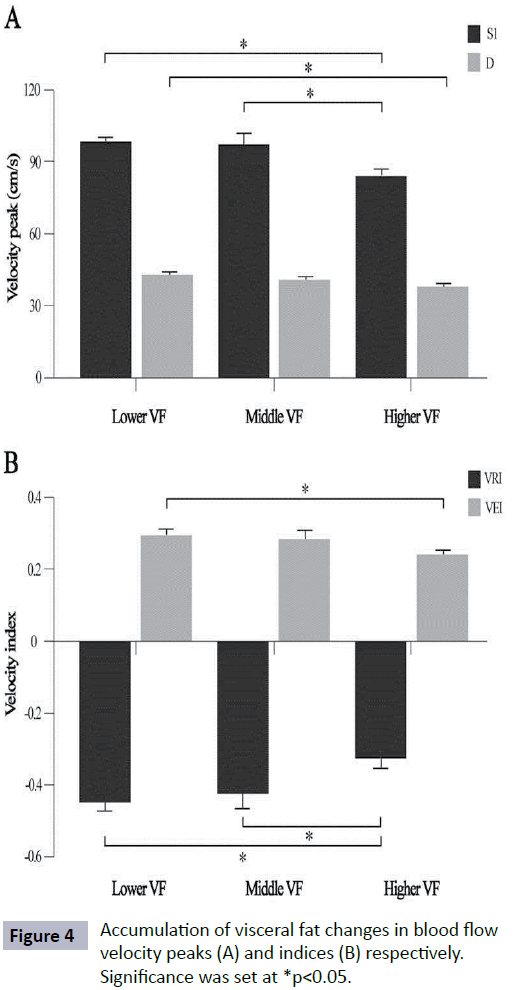
In this analysis, exercise reduced VF accumulation (p=0.01) where sedentary subjects showed higher VF level (7.2 ± 4.1) as shown in Figure 2A. The subjects who developed prehypertension and hypertension measured based on their BP status, had higher VF level than normotensive subjects (Figure 2B) (p=0.001). The RI value of subjects who did regular exercise and sedentary subjects was significantly different (p<0.01). Sedentary lifestyle contributed to significantly higher in VRI value (Figure 3) (p<0.01). There were differences noted in RI and VRI between hypertensive and normotensive subjects (Table 2). Velocity peaks, S1 and D were significantly lower in hypertensive subjects who had significant VF level (p<0.05). The velocity features in S1, D and VEI deteriorated significantly in higher VF group. In contrast, VRI was significant higher in higher VF group (Figure 4).

Figure 2: Exercise activity (A) and development of hypertension (B) influenced to visceral fat accumulation. Data are mean and SE.

Figure 3: Exercise activity (A) and development of hypertension (B) influenced to visceral fat accumulation. Data are mean and SE.

Figure 4: Accumulation of visceral fat changes in blood flow velocity peaks (A) and indices (B) respectively. Significance was set at *p<0.05.

Figure 4A: Effect of visceral fat on the gender related different. * represent significant difference at p<0.05.

Figure 4B: Correlation between level of visceral fat and aging in entire group (unpublished data).
Table 2: Differences between normotensive, prehypertension and hypertension in blood flow velocity.
| Variable |
Normotensive |
Prehypertensive |
Hypertensive |
| S1 |
99.4 ± 1.2 |
95 ± 3 |
78.5 ± 3.6* |
| D |
44.3 ± 1 |
41 ± 1 |
38.6 ± 1.9* |
| RI |
0.8 ± 0 |
0.8 ± 0 |
0.7 ± 0.1* |
| VRI |
-0.5 ± 0 |
-0.4 ± 0.0* |
-0.3 ± 0.0*† |
Significant different: *p<0.05 versus normotensive and †p<0.05 versus prehypertensive.
Discussion
This study highlights the BFV measurements are strongly correlated with VF accumulation and incidence of hypertension. Regular aerobic exercise could be recommended to reduce the level of VF as an early disease prevention step to improve their waveform pattern. Improvable screening of health problem can be achieved by monitoring the BFV together with BP measurements regularly to fully assessing hemodynamics function in circulatory system.
Specific fat distribution has become a growing attention when predicting hypertension incidence [4,5]. Multiple regression analysis suggested that VF was independent fat parameter associated with hypertension incidence while BMI, subcutaneous fat and lower body fat were not significant [4]. Our study extends this analysis to emphasize on relationship between level of VF and blood flow velocities. Similar to other study, subjects who developed hypertension had significantly higher VF level compared to normotensive subjects [4]. Specifically, as the level of VF increased, BP measurements including SBP, DBP and MBP also increased significantly (Table 1). We found that the velocity features in S1, D and VEI declined as level of VF increased. In contrast, VRI value higher in high VF group (Figure 4). The VF was signi?cantly correlated with VRI and VEI (p<0.05) respectively, but not BMI and WC (unpublished data).
Our findings showed that velocity peaks; S1 and D significantly lower in hypertensive group compared to normotensive group (Table 2). Mostly incidence of hypertension occurred in those classified as higher VF group based on the BP readings. This is because thickened artery wall caused by VF accumulation could induce high blood pressure [18]. Average age for this higher VF group was older indicating that aging factor itself influences the cardiac function and BFV. It is supported by other report where the average age for the hypertensive group was significantly older [19]. Hence, the S1 and D velocity peaks declined in hypertensive group might due to arterial stiffen with age [14] and have influenced by VF level itself [10]. Previous study suggested VRI was a reliable predictor of cardiovascular risk in diseased hypertension who under medication and had medical history of hypertension compared to control subjects [19]. We demonstrated that significant difference not only in VRI but also in RI value, between hypertensive group which not under antihypertensive drugs compared to normotensive group. The VRI is related to reflection of velocity components [14]. The RI is a well-recognized index for quantifying changes in the shape of velocity waveforms. This index widely used as an indicator of peripheral vascular resistance where the higher of RI value is, the higher its resistance and vice versa [20].
There are several proposed mechanisms to explain how VF promotes development of hypertension and affects blood flow velocity. Excess adipose tissues including VF required greater oxygen supply and result in increase of cardiac output. Increased in RI and/or cardiac output (CO) are directly proportional to high blood pressure (BP=CO x RI) [21]. Hence, this high-output state caused a decrease in RI among obese hypertensive individual. Besides, excess VF may dysregulate production of adipocytokines [22]. Lipocalin-2 and MCP-1 were adipocytokines which positively correlated with VF [23,24]. Both adipocytokines were reported to be associated with atherosclerosis [18,23]. This may link to hypertension as thickened artery wall induced high BP [18]. Furthermore, Yamauchi et al. reported VF accumulation may contribute to atherosclerosis as it was significantly correlated to plaque score and stiffness-ß [10]. A recent report showed the most significant association between VF and hypertension incidence was observed with retroperitoneal fat. This preliminary result suggested that fats surrounding the kidneys may influence hypertension incidence [4].
Despite total cholesterol was not associated with VF, the elements of cholesterol (i.e., HDL and TG) were significantly associated with increased VF. It was reported that the flow velocity has a negative correlation to level of TG and positive correlation with the level of HDL [15]. Our data support this finding, with HDL and TG showed significantly different in S1 and S2 respectively (p<0.05) (unpublished data). Previous studies had confirmed that people with high level of cholesterol in the blood, increases arterial thickness and resistance but decreases artery compliance [24]. In this study, LDL showed statistically significant between lower and higher VF groups. Farhoudi et al. reported formation of atheroma plaque is caused by inflammation of blood vessel where small LDL particles able to enter the intima media. Deposited LDL leads to narrowing of vessel lumen [25]. This increases blood vessel intima media thickness and vascular resistance [26].
Subjects who performed aerobic exercise regularly can significantly reduce the level of VF. Evidence for effect of regular exercise in reduction of VF level has been shown in other studies [27,28]. In addition, the regular aerobic exercise improved the BFV waveform where systolic velocity peak was higher and sharper, particularly in older subjects [17]. We also found that velocity index RI of subjects who regularly exercise is markedly higher than those who do not. While, subjects with a sedentary lifestyle contributed to the higher VRI value. The differences of velocity indices (i.e., RI and VRI) were due to improved stroke volume and lower heart rate after effectively training regular exercise [29].
The current findings of the study shows that BFV was affected by increased VF. Although the subject number is small, the data was significant when the subjects were classified based on level of VF and BP. Further studies are required to well-discriminate group between viscerally normotensive or hypertensive and nonviscerally normotensive or hypertensive subjects. As VF increase with aging, it is hard to collect data from same age of subjects as well as different level of VF. For further study, characteristic of subjects including age differences and gender must be taken into account when grouping them.
Conclusion
In conclusion, BFV waveforms and its indices are strongly associated with VF accumulation among normotensive and hypertensive subjects. The VF data provide additional information to the existing knowledge regarding modulating factors of blood flow velocity (i.e., age, gender, exercise, body height and weight). This study also suggests that incidence hypertension can be prevented not only by lowering BP, but also by reducing VF level through regular aerobic exercise.
Acknowledgments
This study was financially supported by International Sponsored Research Grant (SP15-079-0201). The authors are grateful to Tokushima University Hospital for greatly assisted in data collection.
Conflict of Interest
The authors do not have any conflict of interest.
8761
References
- Secomb TW, Pries AR (2007) Basic principles of hemodynamics, in: Baskurt OK, Hardeman MR Rampling MW (eds). Handbook of hemorheology and hemodynamics, IOS Press, 289-306.
- Nagatomo I, Nomaguchi M, Matsumoto K (1992) Blood flow velocity waveform in the common carotid artery and its analysis in elderly subjects. ClinAuton Res 2: 197-200.
- Prichard DR, Martin TR, Sherriff SB (1979) Assessment of directional Doppler ultrasound techniques in the diagnosis of carotid artery diseases. J NeurolNeurosurg Psychiatry 42: 563-568.
- Chandra A, Neeland IJ, Berry JD, Ayers CR, Rohatgi A, et al. (2014) The relationship of body mass and fat distribution with incident hypertension; observations from the Dallas heart study. J Am CollCardiol64: 997-1002.
- Sutton-Tyrrell K, Newman A, Simonsick EM, Havlik R, Pahor M, et al. (2001) Aortic stiffness is associated with visceral adiposity in older adults enrolled in the study of health, aging and body composition. Hypertension 38: 429-433.
- Mathieu P, Poirier P, Pibarot P, Lemieux I, Després JP (2009) Visceral obesity: the link among inflammation, hypertension, and cardiovascular disease. Hypertension 53: 577-584.
- Niemirska A, Litwin M, Feber J, Jurkiewicz E (2013) Blood pressure rhythmicity and visceral fat in children with hypertension. Hypertension 62: 782-788.
- Hubert HB, Feinleib M, McNamara PM, Castelli WP (1983) Obesity as an independent risk factor for cardiovascular disease: a 26-year follow-up of participants in the Framingham Heart Study. Circulation 67: 968-977.
- Lavie CJ, Milani RV, Ventura HO (2009) Obesity and cardiovascular disease: risk factor, paradox, and impact of weight loss. J Am CollCardiol 53: 1925-1932.
- Yamauchi T, Kuno T, Takada H, Nagura Y, Kanmatsuse K, et al. (2003) The impact of visceral fat on multiple risk factors and carotid atherosclerosis in chronic haemodialysis patients. Nephrol Dial Transplant 18: 1842–1847.
- Nichols WW, O'Rourke MF (2005) McDonald's blood flow in arteries: Theoretic experimental and clinical principles. (5th edn.), Hodder Arnold, London, United Kingdom.
- Matsuzawa Y, Funahashi T, Nakamura T (2011) The concept of metabolic syndrome: contribution of visceral fat accumulation and its molecular mechanism. J AtherosclerThromb 18: 629-639.
- National Institutes of Health (NIH) (2000) The Practical Guide Identification, Evaluation, and Treatment of Overweight and Obesity in Adult, NIH Publication, New York, United States.
- National Institutes of Health (NIH) (2004) The seventh report of the Joint National Committee on prevention, detection, evaluation, and treatment of high blood pressure (JNC VI), NIH Publication, New York, United States.
- Azhim A, Ueno A, Tanaka M, Masatake A, Kinouchi Y (2011) Evaluation of blood flow velocity envelope in common carotid artery for reference data. Biomed Signal Process Control 6: 209-215.
- Rutherford RB, Hiatt WR, Kreutzer EW (1977) The use of velocity wave form analysis in the diagnosis of carotid artery occlusive disease. Surgery 82: 695-702.
- Azhim A, Katai M, Akutagawa M, Hirao Y, Yoshizaki K, et al. (2007) Exercise improved age-associated changes in the carotid blood velocity waveforms. J Biomed Pharm Eng 1: 17-26.
- Harder C, Baumert J, Thorand B (2004) Chemokines and incident coronary heart disease: Results from MONICA/ KORA Augsburg case-cohort study. ArteriosclerThrombVascBiol 26: 2147-2152.
- Azhim A, Sakagami K, Ueno A, Kinouchi Y, Fukui Y (2013) Independent factors of flow velocity indices in common carotid artery. Proceedings of World Congress on Medical Physics and Biomedical Engineering, IFMBE 39: 445-448.
- Pourcelot L, Donald I, Levis S (1976) Diagnostic ultrasound for cerebral vascular disease. Present and future of diagnostic ultrasound, Rotterdam, Netherlands. 141-147.
- Kotsis V, Stabouli S, Papakatsika S, Rizos Z, Parati G (2010) Mechanisms of obesity-induced hypertension. Hypertens Res 33: 386-393.
- Hiuge-Shimizu A, Kishida K, Funahashi T, Okutsu M, Kametani R, et al. (2012) Coexistence of visceral fat and multiple risk factor accumulations is strongly associated with coronary artery disease in Japanese (The VACATION-J Study). J AtherosclerThromb 19: 657-663.
- Lee YH, Lee SH, Jung ES, Kim JS, Shim CY, et al. (2010) Visceral adiposity and the severity of coronary artery disease in middle-aged subjects with normal waist circumference and its relation with lipocalin-2 and MCP-1. Atherosclerosis 213: 592-597.
- Yang Y, Zhang X, Li R, Ren H, Wang Z, et al. (2010) Evaluation of coronary flow velocity reserve in homozygous familial hypercholesterolemia by transthoracic Doppler echocardiography and dual-source computed tomography. Ultrasound Med Biol36: 1756-1761.
- Farhoudi M, Mehrvar K, Aslanabadi N, Ghabili K, Baghmishe NR, et al. (2011) Doppler study of cerebral arteries in hypercholesterolemia. J Vasc Health Risk Manag7: 203-210.
- Power ML, Schulkin J (2008) Sex differences in fat storage, fat metabolism, and the health risks from obesity: possible evolutionary origins. Br J Nutr99: 931-940.
- Ismail I, Keating SE, Baker MK, Johnson NA (2012) A systematic review and meta-analysis of the effect of aerobic vs. resistance exercise training on visceral fat. Obes Rev 13: 68-91.
- Vissers D, Hens W, Taeymans J, Baeyens JP, Poortmans J, et al. (2013) The effect of exercise on visceral adipose tissue in overweight adults: A systematic review and meta-analysis. PloS8: 1-10.
- Couillard C, Despres JP, Lamarche B, Bergeron J, Gagnon J (2001) Effects of endurance exercise training on plasma HDL cholesterol levels depend on levels of triglycerides: Evidence from men of the health, risk factors, exercise training and genetics (HERITAGE) family study. ArteriosclerThrombVascBiol21: 1226-1232.


