Keywords
Zinc; Copper; Nickle; Bioaccumulation; Flatfish
Introduction
Due to, metals are non-biodegradable, have a remarkable ability to transfer through food chains and are potentially toxic for organisms (Chen and Chen 1999). Anthropogenic sources such as petrochemical wastewaters, mineral and agricultural runoff, oil transportation and urban effluents are the main routes for permeation of heavy metals in aquatic ecosystems (Karadede et al. 2004). Fish are one of the most widely distributed organisms in the aquatic environment, which faced with various discharged wastewater; especially heavy metals (Klaverkamp et al. 1984). They are usually occupies the last levels of aquatic food chains and considered as the main aquatic pathway for metals to be transferred into human body (Svensson et al. 1992). Size, sex, ecological needs, habitat, feeding habits and season are the major factors which influences on metals bioaccumulation and bioavailability in fish (Monikh et al. 2012).
The Persian Gulf is polluted by several human activities such as shipping and tanker traffic, industrial and agriculture development (Al-Saleh and Shinwari 2002; de Mora et al. 2004; Monikh et al. 2013). Bottom sediments also provide habitats and a food source for benthic fauna. Many contaminants such as hazardous and toxic metals are accumulated in sediments that can be extremely harmful for the aquatic environments (Miller et al. 2000; Wang et al. 2007; Usero et al. 2008; Nilin et al. 2013). Cynoglossus arel is a benthic species which is in direct contact with sediments, therefore, the contamination intensity in the sediment, has a huge impact on its toxicity.
Flatfish are good indicators for heavy metals in ecosystems because they live in the sediments where these elements concentrate (Glasby and Szefer, 1998; Szefer, 2002; França et al. 2005). They accumulate heavy metals in their body organs by filtering and feeding from sediments. The highest concentration of heavy metals founded in fish muscle (Evans et al.1993; Gaspic et al. 2002; Has-Schön et al.2008; Polak-Juszczak, 2010). In addition, heavy metals can permeate into skeleton from muscles.
The objectives of the present study are: (1) to assess the heavy metals contamination in sediments using a new index which formulated from Persian Gulf condition and (2) to assess the process of Zn, Cu and Ni accumulation along the chain sedimentsfish muscle-fish bone to determine bioaccumulation of these heavy metals in C. arel.
Materials and Methods
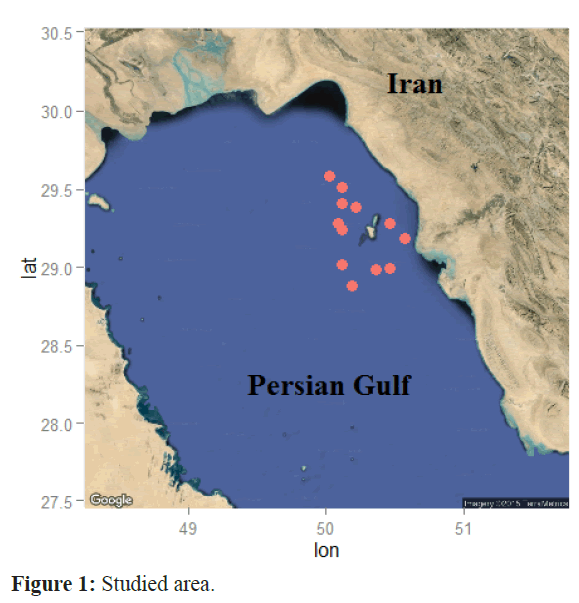
Two stations from Iranian coast of the Persian Gulf (Boushehr and Khouzestan coast) were chosen for studied area (Figure 1). Fish were caught by bottom trawl net and a Van veen grab were employed to sample from sediments in 2014. The samples were immediately transferred to the laboratory in icebox and then frozen at -20°C until dissection for further studies. Samplings were done in winter and summer of 2014. During the study period, 15 samples of fish muscle, fish bone and sediments were collected. Mean ± SD total lengths was 24.1 ± 0.77 cm and total weight was 76.52 ± 6.8 gr.

Figure 1: Studied area.
For analysis, sufficient amount of muscle and bone were dissected and oven-dried at 80°C for 24 hours. Sediments were filtered from the water and passed through a 63 μm sieve and dried at room temperature. 1 gm of dry muscle, bone and sediments were transferred into digestion flasks and 10 ml concentrated nitric acid (65%, Merck for muscle and bone and 30% for sediments) were added to the samples. Samples were kept on the hot plate until all the samples were dissolved (Moopam, 1999). Heavy metals content was determined with the atomic absorption spectrometer of GBC Scientific Equipment Pty. Ltd. (Dandenong, VIC 3175, Australia). Certified Reference Material (CRM) from National Research Council of Canada: Fish Protein was employed to check the accuracy of analytical procedures.
The new Contamination Severity Index (CSI) proposed by (Pejman et al. 2015) was used for investigating severity of heavy metal contamination in sediments. The structure of this index is based on the effects range-low (ERL) and effects range-median (ERM) values reported by Long et al. (1995) (Table 1) and the weight of heavy metals obtained from results of principal component analysis (PCA)/factor analysis (FA) as site-specific factor. The proposed formula as follows:
| Heavy metals |
ERL value (mg/kg) |
ERM value (mg/kg) |
| Cu |
34 |
270 |
| Zn |
150 |
410 |
| Ni |
20.9 |
51.6 |
Table 1: Sediment quality guidelines values reported by Long et al. (1995).
Where Wi is the weight of heavy metals, Ci is the concentration of heavy metal, ERLi and ERMi is effects range-low and effects range-median respectively, for each metal, n is the metals number. The weighted values for each metal (Wi), which is site-specific, are computed using the relationship below:
The proposed classification for CSI index is represented in Table 2.
| CSI value |
Contamination severity |
| CSI < 0.5 |
Uncontaminated |
| 0.5 ≤ CSI < 1 |
Very low severity of contamination |
| 1 ≤ CSI < 1.5 |
Low severity of contamination |
| 1.5 ≤ CSI < 2 |
Low to moderate severity of contamination |
| 2 ≤ CSI < 2.5 |
Moderate severity of contamination |
| 2.5 ≤ CSI < 3 |
Moderate to high severity of contamination |
| 3 ≤ CSI < 4 |
High severity of contamination |
| 4 ≤ CSI < 5 |
Very high severity of contamination |
| 5 ≤ CSI |
Ultra high severity of contamination |
Table 2: Classifications of CSI.
The transfer of heavy metals in fish from sediments is given as the Bioaccumulation Factor (BF) quotient. BF = concentration of each heavy metals in fish muscle-bone/concentration of each heavy metals in ecosystem/sediment. Values grater that 1 in BF calculations indicates bioaccumulation of each heavy metals (Rashed, 2001).
The concentration ratio in muscle, bone and sediments were tested by one-way ANOVA test to determine whether the measured quantities differed significantly. The criterion for significance was set at p<0.05. Principal component analysis (PCA) and factor analysis (FA) were performed for the data set to find loading and eigen values. Before PCA/FA analysis, Kaiser– Meyer–Olkin (KMO) and Bartlett’s tests were executed to check suitability of the data for PCA/FA. Data analyses were performed by R statistical software.The map provided by package “ggmap” (Kahle and Wickham, 2015).
Results
Heavy metal concentrations in the muscles, bone and sediments are presented in Table 3. The highest heavy metals contents were found in sediments, followed by bone and muscle. Heavy metals in muscle, bone and sediment sequence was as follows respectively: Zn>Cu>Ni, Zn>Cu>Ni and Cu>Ni>Zn. Muscle/Sediment (M/S) and Bone/Sediment (B/S) bioaccumulation analysis showed that heavy metals did not accumulated in these tissues, individually. However, BF values of Muscle+Bone/Sediment (MB/S) showed that Zn, Cu and Ni accumulated in body of C. arel (Table 3). ANOVA test revealed that Zn concentration was significantly differed in muscle, bone and sediment. Meanwhile, no significant differences found between muscle and bone for Cu and Ni (Table 3).
| Heavy metal |
Muscle |
Bone |
Sediment |
BF value M/S |
BF value B/S |
BF value MB/S |
| Cu |
25.85±2.84a |
27.26±3.9a |
170.86±18.51b |
0.151293 |
0.159546 |
26.00955 |
| Zn |
31.94±2.74a |
72.51±4.57b |
77.09±4.87c |
0.414321 |
0.940589 |
32.88059 |
| Ni |
4.3±0.88a |
4.49±1.15a |
87.8±13.34b |
0.048975 |
0.051139 |
4.351139 |
Table 3: Content of heavy metals in muscle, skeleton and sediment (mg/kg).
KMO calculated 0.781 which generally indicate compatibility of data for PCA/FA. PCA/FA was applied to develop the new pollution index in this study. FA performed on the PC and one factor analysis including loadings, eigenvalues and % variance are presented in Table 4. The coefficients were not strong enough (less that 0.7), but Factor 1 explained 81.7% of total variance with eigenvalue >1. According to loading and eigen values (Tale 4), the weighted values of heavy metals were computed (Table 5). Using results of PCA/FA and Wi the new index (CSI) were calculated. CSI calculated as 2.683 that reflected Moderate to high severity of contamination.
| |
Factor 1 |
| Cu |
0.58 |
| Zn |
0.59 |
| Ni |
0.56 |
| Eigenvalue |
2.67 |
| % of Total variance |
89% |
Table 4: The result of PCA/FA for entire data set.
| Metals |
Loading Value |
Weighted Value |
| Cu |
0.58 |
0.335 |
| Zn |
0.59 |
0.341 |
| Ni |
0.56 |
0.323 |
Table 5: The computed weighted values for each metal.
Discussion
Fish species obtained in this study are relatively of the same size and weight, therefore they were in constant to heavy metals identical. In General, the accumulation orders of metals in the were found to be sediments>skeleton>muscle in this study. Metals are taken up by fish from food and water, distributed throughout fish body by blood and eventually accumulated in target organs (Monikh et al. 2013). Atabak (2011) stated that benthic macroinvertebrates such as Amphipods, Crustacean, Bivalves, and Copepods are the main food sources for Juvenile C. arel. These findings showed that C. arel is directly in contact with sediments and feeds from benthic communities intensively, thus could absorb different substances from sediments, such as heavy metals.
Heavy metal concentration in the water column can be relatively low, but the concentration in the sediments may be elevated and long-term partitioning of heavy metals to the sediments could result in the accumulation of high loads (Martin and Whitfield, 1983; Karbassi and Bayati, 2005). Therefore, higher amounts of heavy metals in sediments are anticipated. The Persian Gulf is a semi-enclosed formation and heavy discharges of the surrounding industries especially oil-rich countries. Oil-related activities in these countries have the major contribute to sediment pollution in the Persian Gulf (Dadolahi Sohrab and Nazarizadeh Dehkordi, 2013). Karbassi and Bayati (2005) reported that Cu and Zn in Persian Gulf sediments (Boushehr coast) are originated from oil pollution sources. Furthermore, they declared that the percentile of anthropogenic portion of metals as: Mn (46%) > pb (40%) > Cu (18%) > Zn (12.8%) > Fe (2.4%) > Cr & Ni (0.03).
Results indicated that heavy metals accumulated in bone more than muscle. This might be due to high potential absorbent of fishbone to anchor heavy metals. Fishbone consists mainly of hydroxyapatite which is considered as adsorbent material by adsorption process via an ion exchange reaction with calcium ions on the bone (Zayed et al. 2013). Many researchers reported success of fishbone and hydroxyapatite as a sorbent source for various heavy metals (Dimovic et al. 2009; Smiciklas et al. 2009; Ozawa et al. 2003; Banat et al. 2000). Skeleton is surrounded by muscles in fish. Therefore it is feasible that bone absorb heavy metals from muscles. However, statistical analysis revealed that there were no significant differences between Cu and Ni amounts in muscle and bone (Table 3). In particular, Zn in more accumulated in skeleton than other tissues. These findings are in agreement with other literature in different fish (El-Nemr, 2003; Van Aardt and Erdman, 2004; Perugini et al. 2014). Furthermore, Monikh et al. (2012) studied on Distribution of Metals in the Tissues of C. arel in the northwest part of Persian Gulf (different areas from this study) and reported concentration of Cu and Ni in the muscles of this species. Comparison of results showed higher amount of Cu and Ni in the muscles of C. arel in this study (Table 6). Compared to the results of Monikh et al. (2012) and Pourang et al. (2005), generally, our results were much higher than their findings, except for Ni in Solea elongate. For as much as all these flatfish have similar habitat and feeding behavior, and collected from Persian Gulf, our results suggest high accumulation of heavy metals in C. arel. Furthermore, results of this study was compared with the maximum permissible limits (MPL) provided by WHO (1985) and FEPA (2003) in Table 4. Cu and Ni level was found to be within MPL of WHO and FEPA. However, Ni level was much closed to MPL. Zinc level in the muscle of C. arel was found to be higher than legal limits of FEPA.
| Location/Standard |
Species |
Cu (mg/kg) |
Zn (mg/kg) |
Ni (mg/kg) |
Reference |
| This study |
Cynoglossusarel |
25.85 |
31.94 |
4.3 |
|
| Persian Gulf |
Cynoglossusarel |
0.71 |
1.84 |
0.62 |
Monikh et al. (2012) |
| Persian Gulf |
Euryglossaorientalis |
0.28 |
1.82 |
0.88 |
Monikh et al. (2012) |
| Persian Gulf |
Soleaelongata |
|
|
6.69 |
Pourang et al. (2005) |
| Persian Gulf |
Psettodeserumei |
|
|
1.09 |
Pourang et al. (2005) |
| FEPA (2003) |
|
30 |
30 |
5 |
|
| WHO (1985) |
|
30 |
100 |
5 |
|
Table 6: Comparison of average concentration of the metals (mg/kg) in the muscle of the flatfish species collected from the Persian Gulf and some available standards.
The bioaccumulations of heavy metals were assessed by BF value in this study (Table 3). Results indicated that heavy metals were bioaccumulated from sediments into whole body of C. arel. Fish take up heavy metal from the environment they inhabit, thus from the water, sediments, and food (Polak-Juszczak, 2012). In addition, C. arel live in the benthic zone and feed from surface sediment. Therefore, one of the methods for assessing the degree of accumulation in an organism is to compare the concentration of heavy metals in this species to the sediment. In the present study, Cu, Zn and Ni bioaccumulation factor to the C. arel from the sediments was greater than 1 which indicates that this species collects mercury from the sediments. Results of this study were in agreement with Polak-Juszczak (2012). He studied on the bioaccumulation range of three flatfish species and reported that sequence for the BF of Hg in flatfish/sediments as follows: Scophthalmus maximus > Platichtys flesus> Pleuronectes platessa. He also suggested that these three species are suitable and costeffective to biomonitor environmental mercury pollution.
The new CSI index reveled that sediments have moderate degree of contamination in the studied area. Pejman et al. (2015) stated that comparison between results of MERMQ index and new index reveals that CSI have much more sensitivity. The CSI is without having to background values and having site-specific factor. Furthermore, this new index is modified based on the Persian Gulf conditions, therefore results are more validated than other indexes.
Conclusion
This study provides new information on the distribution of metals in the bone of C. arel from the northwest Persian Gulf. In general, the Cu, Zn and Ni showed a strong tendency to accumulate in the skeleton more than muscle. Zn concentration in edible part of the fish is above the proposed limit values for human consumption according to FEPA. BF results of the study indicated that the accumulation of heavy metals from sediment in flatfish body as follows Zn>Cu>Ni. The data obtained will be useful in assessing the quality of the study area. C. arel could be used successfully as biomonitors of Zn, Cu and Ni sediment content in the Persian Gulf because of their ability to accumulate these metals.
8224
References
- Atabak, N. (2011). Survey on natural feeding of Juvenile Cynoglossusarel and Soleaelongata fishes (Cynoglossidae and Soleidae) in the northwest of Persian Gulf coastal water. FisheriesResearch, 108(1), 9-14
- nBanat, F., Al-Asheh, S., &Mohai, F. (2000). Batch zinc removal from aqueous solution using dried animal bones. Separation and Purification Technology, 21, 155–164
- nChen, M. H, & Chen, C. Y. (1999).Bioaccumulation of sediment-bound heavy metal in grey Mullet, Lizamacrolepis.Marine Pollution Bulletin,39, 239–244
- nKahle, D., & Wickham, H. (2015).ggmap: Spatial Visualization with ggplot2. The R Journal, 5(1), 144-161. (https://journal.r-project.org/archive/2013-1/kahle-wickham.pdf)
- nDadolahiSohrab, A., &NazarizadehDehkordi, M. (2013).Heavy Metals Contamination in Sediments from the North of the Strait of Hormuz.Journal of the Persian Gulf, 4(11), 39-46
- nDimovic, S., Smiciklas, I., Plecas, I., Antonovic, D., &Mitric, M. (2009).Comparative study of differently treated animal bones for Co2+ removal.Journal of Hazardous Materials, 164, 279–287
- nEl-Nemr, A. (2003). Concentrations of certain heavy metals in imported frozen fish in Eygpt. Egyptian Journal of Aquatic Biology and Fisheries, 7, 139-154
- nEvans, D. W., Dodo, D. K., & Hanson, P. J. (1993). Trace elements concentrations in fish livers: implications of variations with fish size in pollution monitoring. MarinePollutionBulletin, 26, 329–334
- nFEPA (Federal Environmental Protection Agency (2003). Guidelines and Standards for Environmental Pollution Control in Nigeria, p. 238
- nFrança, S., Vinagre, C., Caçador, I., & Cabral, H. N. (2005). Heavy metal concentrations in sediment, benthic invertebrates and fish in three salt marsh areas subjected to different pollution loads in the Tagus Estuary (Portugal). MarinePollutionBulletin, 50, 993–1018
- nGaspic, Z. K., Znovaric, T., Vrgoc, N., Odzak, N., & Baric, A. (2002). Cadmium and lead in selected tissues of two commercially important fish species from the Adriatic Sea. WaterResearch,36, 5023–5028
- nGlasby, G. P., &Szefer, P. (1998). Marine pollution in Gdansk Bay, Puck Bay and the Vistula Lagoon, Poland: an overview. Science of the Total Environment, 212, 49–57
- nHas-Schön, E., Bogut, I., &Kralik, G. (2008).Heavy metal concentration in fish tissues inhabiting waters of ‘‘BuskoBlato’’ reservoir (Bosnia and Herzegovina).EnvironmentalMonitoringAssessment,144, 15–22
- nKaradede, H.L., Oymak, S.A., &Unlu, E. (2004). Heavy metals in mullet, Lizaabu, and catfish, Silurustriostegus, from the Ataturk Dam Lake (Euphrates), Turkey. EnvironmentalInternational,30, 183–188
- nKarbassi, A. R., &Bayati, G. R. N. B. I. (2005). Environmental geochemistry of heavy metals in a sediment core off Bushehr, Persian Gulf. Iranian Journal of Environmental Health Science & Engineering, 2(4), 255-260
- nKlaverkamp J. F., MacDonald, W. A., Duncan D. A., &Wagemann R. (1984). Metallothionein and accumulation to heavy metals in fish: a review. Contaminant Effects on Fisheries, edited by Cairns, VW Hodson, PV &Nriagu, JO, Wiley, New York, pp: 99-113
- nLong, E. R., MacDonald, D. D., Smith, S. L., & Calder, F. D. (1995). Incidence of adverse biological effects within ranges of chemical concentrations in marine and estuarine sediments. EnvironmentalManagement, 19, 81–97
- nMartin, J. M., & Whitfield, M. (1983). The significance of the river input of chemical elements to the ocean. In Trace metals in sea water (pp. 265-296). Springer US
- nMiller, B. S., & Pirie, D., Redshaw, C. J. (2000). An assessment of the contamination and toxicity of marine sediments in the holy loch, Scotland.MarinePollutionBulletin, 40, 22–35
- nMonikh, F. A., Peery, S., Karami, O., Hosseini, M., Bastami, A. A., &Ghasemi, A. F. (2012). Distribution of metals in the tissues of benthic, Euryglossaorientalis and Cynoglossusarel., and Bentho-Pelagic, Johniusbelangerii., fish from Three estuaries, Persian Gulf. Bulletin of environmental contamination and toxicology, 89(3), 489-494
- nMoopam, A. (1999). Manual of oceanographic observation and pollution analysis.regional or-ganization for the protection of Marine Environment (ROPME)
- nNilin, J., Moreira, L. B., Aguiar, J. E., Marins, R., Souza, D.M., Abessa, T., Cruz Lotufo, M., & Costa-Lotufo, L.V. (2013).Sediment quality assessment in a tropical estuary, the case of Ceará River, Northeastern Brazil.MarineEnvironmentalResearch, 90, 1–8
- nOzawa, M., Satake, K., & Suzuki, R. (2003). Removal of aqueous chromium by fish bone waste originated hydroxyapatite. Journal of materials science letters, 22(7), 513-514
- nPejman, A., Bidhendi, G. N., Ardestani, M., Saeedi, M., &Baghvand, A. (2015). A new index for assessing heavy metals contamination in sediments: A case study. Ecological Indicators, 58, 365-373
- nPerugini, M., Visciano, P., Manera, M., Zaccaroni, A., Olivieri, V., et al. (2014). Heavy metal (As, Cd, Hg, Pb, Cu, Zn, Se) concentrations in muscle and bone of four commercial fish caught in the central Adriatic Sea, Italy. Environmental monitoring and assessment, 186(4), 2205-2213
- nPolak-Juszczak, L. (2012). Bioaccumulation of mercury in the trophic chain of flatfish from the Baltic Sea.Chemosphere, 89(5), 585-591
- nPolak-Juszczak, L. (2010). Bioaccumulation and temporal trends of trace elements in flounder from the southern Baltic Sea for the 1996–2003 period.Journal of Toxicology and Environmental Health, Part A, 73(17-18), 1186-1193
- nPourang, N., Nikouyan, A., & Dennis, J. H. (2005). Trace element concentrations in fish, surficial sediments and water from northern part of the Persian Gulf. Environmental monitoring and assessment, 109(1-3), 293-316
- nSmiiklas, I., Dimovi, S., , I., & Mitri, M. (2006). Removal of Co 2+ from aqueous solutions by hydroxyapatite. Water Research, 40(12), 2267-2274
- nSvensson, B. G., Schütz, A., Nilsson, A., Åkesson, I., Åkesson, B., et al. (1992). Fish as a source of exposure to mercury and selenium.Science of the total environment, 126(1), 61-74
- nSzefer, P. (2002). Metal pollutants and radionuclides in the Baltic Sea-an overview.Oceanologia, 44(2)
- nUsero, J., Morillo, J., & El Bakouri, H. (2008). A general integrated ecotoxicological method for marine sediment quality assessment: application to sediments from littoral ecosystems on Southern Spain’s Atlantic coast. Marine Pollution Bulletin, 56(12), 2027-2036
- nVan Aardt, W. J., & Erdmann, R. (2004).Heavy metals (Cd, Pb, Cu, Zn) in mudfish and sediments from three hard-water dams of the Mooi River catchment, South Africa.WaterSa, 30(2), 211-218
- nWang, X. C., Feng, H., & Ma, H. Q. (2007).Assessment of metal contamination in surface sediments of Jiaozhou Bay, Qingdao, China.CLEAN–Soil, Air, Water, 35(1), 62-70
- nWHO (World Health Organization) (1985).Guidelines for Drinking Water Quality. Vol.1. Recommendation WHO: Geneva, p. 130
- nZayed, E. M., Sokker, H. H., Albishri, H. M., &Farag, A. M. (2013). Potential use of novel modified fishbone for anchoring hazardous metal ions from their solutions. Ecological Engineering, 61, 390-393.


