Keywords
Cytoprotection; Grey mullet; Heat shock proteins; Thioredoxin; Xenobiotics
Introduction
Xenobiotics are synthetic compounds that are foreign to the biological system which include halogenated hydrocarbon, polycyclic biphenyls (PCB), poly aromatic hydrocarbons (PAH) and lignin. These compounds are generated due to diverse activities and gain entry into the body by physical contact, inhalation, or ingestion (Jyoti et al. 2011). Aquatic environments are home to a vast diversity of organisms. Overloading of the estuaries with contaminants for a longer period has led to significant buildup of pollutants with a resulting impact on fish population (Agarwal, 2005). The grey mullet (Mugil cephalus) is capable of concentrating contaminants and is considered suitable for biomarker studies. Brain is an appropriate organ for the study of the effects of xenobiotics due to its morphological heterogeneity, metal accumulating capacity and susceptibility to histopathological damage by metals. The extent of contamination can be studied by comparing polluted and unpolluted estuaries. Hence in the present study Kovalam estuary was chosen as the control (unpolluted) site as it is surrounded by thick vegetation and it is free from industrial pollution and Ennore estuary was chosen as the test (polluted) site as a number of industries are situated in its immediate coastal neighbourhood. The ability of xenobiotics to damage cellular molecules is by the formation of reactive oxygen species (ROS) depend on their concentration and exposure time (Scoullos et al. 2007).
An imbalance between proxidant and antioxidant leads to altered cell viability and damage to biological macromolecules resulting in the developement of oxidative stress (OS). Enriched poly unsaturated fatty acid (PUFA) and lowered antioxidants and related enzymes makes the brain highly susceptable to free radical induced oxidative stress (FRIOS). Peroxidation of unsaturated lipids in cell membranes produce unstable lipid hydroperoxides which is further decomposed to highly reactive product that threaten cell integrity. In addition, these products are converted to free radicals that can initiate the destructive cycle of lipid peroxidation chain reactions (Genestra, 2007). These free radicals are quenched by an array of antioxidants which can be enzymatic or non- enzymatic. Thioredoxin (Trx) is one of the redox components of the cell that exists either in a reduced form with dithiol or in an oxidized form, with an intramolecular disulfide bridge (Powis et al. 2000). The redox activity by reversible oxidation of its active center dithiol to disulfide is essential for its functions such as cell growth, apoptosis.
Elevated levels of xenobiotics create hypoxia in aquatic environment (Rahman and Thomas, 2012). Hypoxia-inducible factors (HIF’s) are regulatory proteins consisting of two subunits namely HIF-1α and HIF-1β that display different responses to O2 concentrations: HIF-1β is a non-oxygen-responsive nuclear protein and is constitutively expressed; HIF-1α is an essential transcription factor which mediates the adaptation of cells to low oxygen tensions, is regulated precisely by hypoxia (Xiao et al. 2013). During normoxia HIF-1α is synthesized at a high rate, but is degraded immediately. Under hypoxic conditions it escapes ubiquitation as prolyl hydroxylase fails to oxidize HIF- 1α, resulting in a drastic increase of the protein (Elisabeth et al. 2008). This makes HIF-1α a strong biomarker of hypoxia. HSP70 is a widely distributed and evolutionally well-conserved protein family exerting a central role in cellular homeostasis. The expression of HSP70 is induced by a variety of stressors including hyperthermia, hypoxia, osmotic stress, heavy metal exposure and oxidative stress (Mu et al. 2013). Elevated expression of HSP70 serves to protect the organism against cellular damage (Taleb et al. 2008; Padmini and Usha Rani, 2008) and thus act as a suitable indicator to identify the effect on xenobiotics. Biotransformation of xenobiotics is carried out by a wide variety of inducible detoxifying enzymes like cytochromes P450 (CYPs) comprise a large gene superfamily encoding a diverse group of heme-thiolate monooxygenase enzymes. Cytochrome P450 1A (CYP1A) subfamily is commonly expressed in most animals that metabolically alters some chemical carcinogens and environmental contaminants. Hence in fish, CYP1A2 activities are often used as markers to determine the quantities of persistent organic pollutants (Havelkova et al. 2007). Apoptosis can be induced by a variety of stressors and culminate in the selfdestruction of a cell. Apoptosis signal-regulating kinase 1 (ASK1) is a 155- kDa is a mitogenactivated protein kinase (MAPK) that is under tight regulation at multiple levels. Trx indirectly binds to ASK- 1 and sequesters it in an inactive state in the cytoplasm (Zhou et al. 2004). It is preferentially activated by oxidative stress and inflammation via a redox-induced dissociation of Trx.
Fourier transform infrared (FTIR) spectroscopy is a nondisturbing technique that has been used extensively to probe structural changes in proteins and lipids (Akkas et al. 2007; Cakmak et al. 2006). The vibration of chemical bond absorbs radiation in the infrared spectroscopy (IR) region between 4000 and 400cm-1 (Corte et al. 2010). Each functional group in a molecule has characteristic absorption frequencies in the IR spectrum which is related to the change in dipole that occurs during the vibration. Consequently, vibrations that produce a large change in dipole (e.g. C=O stretch) result in a more intense absorption than those that result in a relatively modest change in dipole (e.g. C=C). Vibrations that do not result in a change in dipole movement (e.g. a symmetrical alkyne C triple bond C stretch) will show little or no absorption for this vibration. The intensities of the bands in the spectrum are proportional to concentration (Vlachos et al. 2006) and help to quantitate biomolecules in the biological samples.
The present study aimed at understanding the effect of xenobiotics on fish brain by assessing stress markers (LHP, Trx), signalling proteins (HIF1α, HSP70, CYP1A2 and ASK1) and changes in the biomolecular composition using Fourier Transform Infrared Spectroscopy (FTIR).
Materials and Methods
Study site
Two estuaries were chosen as the experimental sites for the present study. Kovalam estuary (12º47'16”N, 80º14'58”E) is situated on the east coast of India, about 35 km South of Chennai. It runs parallel to the sea coast and extends to a distance of 20 km. It was chosen as the unpolluted site as it is surrounded by high vegetation, free from industrial pollution. Ennore estuary (13º14'51”N, 80º19'31”E) also situated on the east coast of India, is about 15 km North of Chennai. It runs parallel to the sea coast and extends over a distance of 36 km, was chosen as the polluted site as in its immediate coastal neighbourhood are situated, a number of industries which include petrochemicals, fertilizers, pesticides, oil refineries, rubber factory and thermal power stations that discharge their effluents directly into this estuary (Padmini and Vijayageetha 2007a; 2007b; Vijayan et al. 2006).
Study animal and sampling
M. cephalus a natural inhabitant of the estuaries, identified by the use of Food and Agriculture Organization (FAO) species identification sheets (Fischer and Binachi, 1984) was chosen as the experimental animal for the study. Grey mullets with an average length of 30 cm were collected from both Kovalam (n=20) and Ennore (n=20) estuaries using baited minnow traps. Fish were collected from both estuaries and placed immediately into insulated containers filled with aerated estuarine water at ambient temperature (25-30°C) and salinity (24-29 ppt). Fish were maintained in the above specified conditions for 4–5 hrs until the start of the experimental procedure for the isolation of brain.
Protein estimation
Protein concentration was determined by the classical method of Bradford (Bradford 1976) with Coomassie brilliant blue G-250, using bovine serum albumin as a standard.
Estimation of lipid hydroperoxide (lhp)
The level of lipid hydroperoxides was determined according to the method of Jiang et al., (1992) using Fox reagent. To 0.2 ml of brain homogenate, 1.8 ml of Fox reagent was added. The contents were mixed well and allowed to stand for 30 minutes at room temperature and the colour developed was read at 560 nm. A blank containing 0.2 ml of water and a series of hydrogen peroxide standards (40-200 μmoles/ml) were processed similarly. The values were expressed as μmoles of H2O2/mg protein.
FTIR spectroscopic analysis
The isolated samples and potassium bromide (all dry solid state) were lyophilized in order to remove most bound water, which might interfere with the measurement of amide Æband. Sample was mixed with dried Kbr and subjected to a pressure of 5×10⁶ Pa and made into a clear pellet of 13 mm diameter and 1 mm thickness. The spectrometer was continuously purged with dry nitrogen. The absorption intensity of the peak was calculated using the base line method. Each observation was confirmed by taking at least three replicates. The spectra were recorded in the range of 4000-400 cm-1 using FTIR (PerkinElmer FTIR Spectrometer RX I). In the present study it is possible to directly relate the intensities of the absorption bands of the corresponding functional groups.
Immunoblot analysis
Extracts (50 μg/lane) were separated by 10% sodium dodecyl sulphate-polyacrylamide gel electrophoresis (SDS-PAGE) using dual cool mini-vertical PAGE electrophoretic system according to the protocol described by Laemmli (1970). Separated proteins were transferred to BioTrace polyvinylidene fluoride (PVDF) membrane of 0.45 μm pore size (Pall Corporation, East Hills, New York) at 15 V for 90 min using alkaline buffer (48 mM Tris, 39 mM glycine, 0.037% w/v SDS, 20% methanol v/v, pH 8.3) and a semi dry blotting units (Cleaver Scientific Ltd, Rugby, UK). The PVDF blots were blocked with TBST (10 mM Tris, 150 mM NaCl, 1.54 mM sodium azide, 0.05% v/v Tween- 20, pH 7.5) containing 5% w/v skimmed milk powder for three hours, followed by two 5 min washes with TBST-3X and three 5 min washes with TBST-1X buffer. The blots were stained with antibodies (Stressgen Bioreagents, Victoria, BC, Canada) against Trx (mouse monoclonal (MSA-150); 1:1000 dilution), HSP70 (rabbit polyclonal (SPA-812); 1:30,000 dilution) and ASK1 (rabbit polyclonal (AAP-480); 1:700 dilution) with an anti-β-actin antibody (rabbit polyclonal (CSA- 400); 1:1000 dilution) being used to assess equal loading for overnight at 4°C. The blots were then washed as described above and incubated for 1 hr in secondary anti-rabbit IgG antibodies coupled to alkaline phosphatase (GeNei, Bangalore, India) diluted 1:1000 in TBST buffer. The final detection of immunoblotted proteins was accomplished by exposing the blots to a solution of 3-bromo-4- chloro-indolyl phosphate-nitroblue tetrazolium (BCIP-NBT) substrate (BCIP at a concentration of 0.21 g/l and NBT at a concentration of 0.42 g/l in 0.1 M tris buffer) for 1–15 min. The band intensities were scanned with the HP scanners (hp psc 1310 series) and quantified using TotalLab image analysis software (Nonlinear dynamics, All Saints, UK). The results were expressed in terms of relative levels of western blotted proteins which indicated the ratio obtained from the density of the band of interested protein expression standardized with that of the β-actin protein expression level.
Quantification of Trx, HIF1α, CYP1A2, HSP70 and ASK1 using ELISA kit
The expression of Trx, HIF1α, CYP1A2, HSP70 and ASK1 were quantified using respective ELISA Kits (MBS009625, Mybiosource; CSB-E12112H, CUSA BIOTECh; 96 T; E93294Hu, Uscn Life Science Inc, China; MBS706016, Mybiosource; E91358Hu 96 T, Uscn Life Science Inc.) according to manufacturer’s instruction as outlined below.
Trx: This assay employs the quantitative sandwich enzyme immunoassay technique. Antibody specific for Trx was already pre-coated onto a microplate. Standards and samples were pipetted into the wells, and Trx present were bound by the immobilized antibody. After removing any unbound substances, Trx antibody conjugated with Horseradish Peroxidase (HRP) was added to the wells. After washing TMB substrate was added to the wells. The color developed is proportion to the amount of Trx bound in the initial step. The reaction was terminated by adding stop solution and the colour change was measured in a microplate reader at 450 nm. Trx concentration of the sample was quantitated by interpolating absorbance readings from a standard curve generated with the calibrated Trx protein standard provided.
HIF1α: This assay employs the quantitative sandwich enzyme immunoassay technique. Antibody specific for HIF1α was already pre-coated onto a microplate. Standards and samples were pipetted into the wells, and HIF1α present were bound by the immobilized antibody. After removing any unbound substances, a biotin-conjugated antibody specific for HIF1α was added to the wells. After washing, avidin conjugated Horseradish Peroxidase (HRP) was added to the wells. A substrate solution was added to the wells after washing and color developed in proportion to the amount of HIF1α bound in the initial step. The color development was stopped, and the intensity of the color was measured in a microplate reader at 450 nm. HIF1α concentrations from the sample were quantitated by interpolating absorbance readings from a standard curve generated with the calibrated HIF1α protein standard provided.
CYP1A2: The protein was diluted using buffer and plated on the 96 well plates along with the diluted recombinant CYP1A2 standard. After incubation for 2 hours at room temperature, the contents were removed and the well was incubated with detection reagent A for one hour at room temperature. The contents should be aspirated by washing with wash buffer for 3 times and incubated with detection reagent B at room temperature for 30 minutes. Following incubation, the wells were washed for 5 times with wash buffer. TMB substrate was added and the blue colour developed was in proportion to the amount of captured CYP1A2. The colour development was stopped with acid stop solution, which converted the endpoint colour to yellow, and the colour intensity was measured in a micro plate reader at 450nm. The concentration of CYP1A2 present in the sample was calculated by plotting CYP1A2 standard curve.
HSP70: This assay employs the competitive inhibition enzyme immunoassay technique. The microtiter plate provided in this kit was already pre-coated with an antibody specific to HSP70. Standards or samples were added to the appropriate microtiter plate wells with biotin-conjugated HSP70. A competitive inhibition reaction was launched between HSP70 (Standards or samples) and biotin-conjugated HSP70 with the pre-coated antibody specific for HSP70. The more amount of HSP70 in samples, the less antibody bound by biotin-conjugated HSP70. After washing, avidin conjugated Horseradish Peroxidase (HRP) was added to the wells. The substrate solution was added to the wells. Then the color development was stopped, and the intensity of the color was measured in a microplate reader at 450nm. HSP70 concentrations from the sample were quantitated by interpolating absorbance readings from a standard curve generated with the calibrated HSP70 protein standard provided.
ASK1: The microtiter plate provided in this kit was pre-coated with an antibody specific to ASK1. Standards or samples were then added to the appropriate microtiter plate wells with a biotinconjugated antibody specific to ASK1. Next, Avidin conjugated to Horseradish Peroxidase (HRP) was added to each microplate well and incubated. After TMB substrate solution was added, only those wells that contain ASK1, biotin-conjugated antibody, and enzyme-conjugated Avidin exhibit a change in color. The enzyme-substrate reaction was terminated by the addition of sulphuric acid solution, and the color change was measured. ASK1 concentrations from the sample were quantitated by interpolating absorbance readings from a standard curve generated with the calibrated ASK1 protein standard provided.
Statistical significance
Data were analyzed using statistical software package version 7.0. Student’s t-test was used to ascertain the significance of variations between unpolluted and polluted fish brain homogenate. All data were presented as mean ± SD of 20 samples. Differences were considered significant at p<0.01 and p<0.001.
Results
Figure 1 shows Level of Protein in brain homogenate of grey mullet inhabiting Kovalam and Ennore estuaries. Values are expressed as mean ± SD (n=20 fish per estuary). #p<0.001, significant decrease in the level of protein (56%) in test brain homogenate when compared with control brain homogenate of grey mullet, CB- Control brain homogenate; TB- Test brain homogenate.

Figure 1: Level of Protein in brain homogenate of grey mullet inhabiting Kovalam and Ennore estuaries.
Figure 2 shows Level of LHP in brain homogenate of grey mullet inhabiting Kovalam and Ennore estuaries. Values are expressed as mean ± SD (n=20 fish per estuary). #p<0.001, significant increase in the level of LHP in test brain homogenate (2 fold) when compared with control brain homogenate of grey mullet, CB-Control brain homogenate; TB-Test brain homogenate.
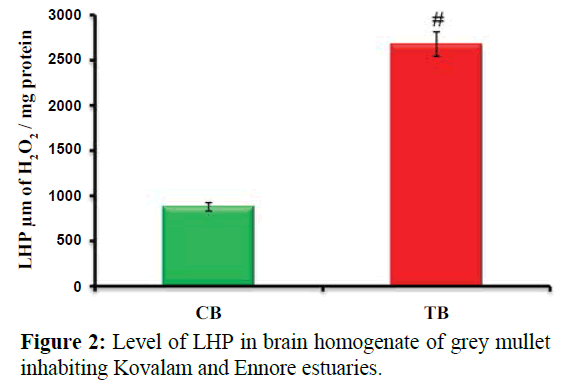
Figure 2: Level of LHP in brain homogenate of grey mullet inhabiting Kovalam and Ennore estuaries.
Figure 3 shows Immunoblot expression and quantification of Trx in brain homogenate of grey mullet inhabiting Kovalam and Ennore estuaries. Values are expressed as mean ± SD (n=20 fish per estuary). Blotting analysis showed significant increase in the expression of Trx (#p<0.001) in brain homogenate of M. cephalus inhabiting Ennore estuary with brain homogenate of M. cephalus inhabiting Kovalam estuary. β-actin has been used as the loading control. Lane 1: Trx (12 kDa), Lane 2: β-actin (44 kDa). #p<0.001, significant increase in the level of Trx in test brain homogenate (47%) when compared with control brain homogenate of grey mullet, CB- control brain homogenate; TB- test brain homogenate.

Figure 3: Immunoblot expression and quantification of Trx in brain homogenate of grey mullet inhabiting Kovalam and Ennore estuaries. β-actin has been used as the loading control. Lane 1: Trx (12 kDa), Lane 2: β-actin (44 kDa).
FTIR spectroscopic analysis
Comparative FTIR spectra of control and test brain of grey mullet inhabiting Kovalam and Ennore estuaries were noted in Figure 4 and the assignment of absorption band of FTIR spectral wave number of test adipocytes of grey mullet were presented in Table 1. The spectrum of test brain homogenate varies from the control brain homogenate in varying functional groups of protein, lipids and other biomolecules.
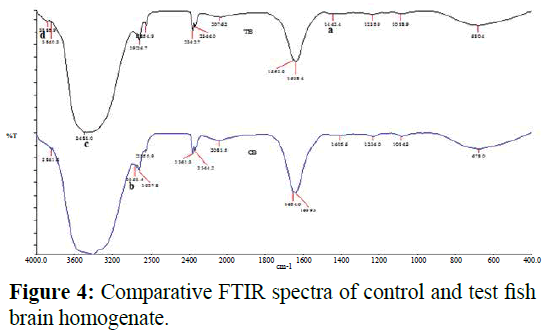
Figure 4: Comparative FTIR spectra of control and test fish brain homogenate.
| Wave Number (cm-1) |
Functional Group |
| 1442 (a) |
asymmetric CH3 bending modes of the methyl groups of protein |
| 2961 (b) |
asymmetric CH2 stretching mode of the methylene chain in the membrane lipids |
| 3488 (c) |
N-H stretching vibrations of amides |
| 3885 (d) |
O-H stretch |
Table 1: Assignment of absorption band of FTIR spectral wave number of grey mullet brain homogenate.
Figure 5 shows Level of HIF1α in brain homogenate of grey mullet inhabiting Kovalam and Ennore estuaries. Values are expressed as mean ± SD (n=20 fish per estuary). #p<0.001, significant increase in the level of HIF1α (37%) in test brain homogenate when compared with control brain homogenate of grey mullet. CB-control brain homogenate; TB- test brain homogenate.
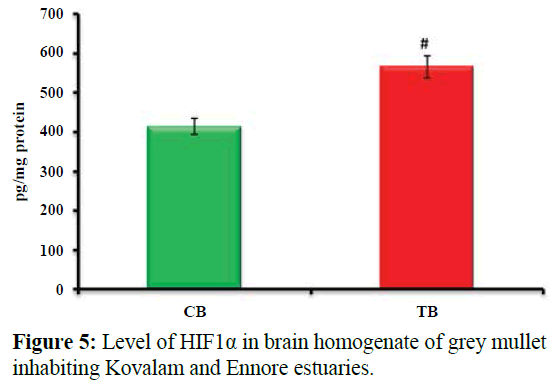
Figure 5: Level of HIF1α in brain homogenate of grey mullet inhabiting Kovalam and Ennore estuaries.
Figure 6 shows Level of CYP1A2 in brain homogenate of grey mullet inhabiting Kovalam and Ennore estuaries. Values are expressed as mean ± SD (n=20 fish per estuary). @p<0.01, significant decrease in test brain homogenate (24%) when compared with control brain homogenate of grey mullet. CBControl brain homogenate; TB- Test brain homogenate.
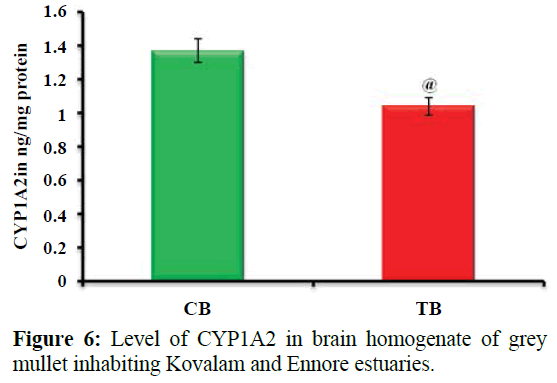
Figure 6: Level of CYP1A2 in brain homogenate of grey mullet inhabiting Kovalam and Ennore estuaries.
Figure 7 shows Immunoblot expression and quantification of HSP70 in brain homogenate of grey mullet inhabiting Kovalam and Ennore estuaries. Values are expressed as mean ± SD (n=20 fish per estuary). Blotting analysis showed significant increase in the expression of HSP70 (#p<0.001) in brain homogenate of M. cephalus inhabiting Ennore estuary with brain homogenate of M. cephalus inhabiting Kovalam estuary. β-actin has been used as the loading control. Lane 1: HSP70 (70 kDa), Lane 2: β-actin (44 kDa). #p<0.001, significant increase in test brain homogenate (1.3fold) when compared with control brain homogenate of grey mullet, CB- Control brain homogenate; TB- Test brain homogenate.
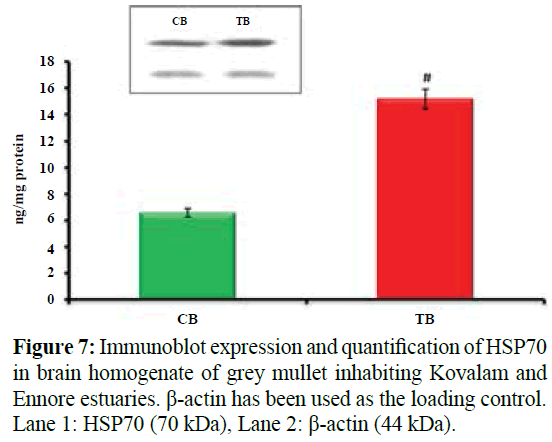
Figure 7: Immunoblot expression and quantification of HSP70 in brain homogenate of grey mullet inhabiting Kovalam and Ennore estuaries. β-actin has been used as the loading control. Lane 1: HSP70 (70 kDa), Lane 2: β-actin (44 kDa).
Figure 8 shows Immunoblot expression and quantification of ASK1 in brain homogenate of grey mullet inhabiting Kovalam and Ennore estuaries. Values are expressed as mean ± SD (n=20 fish per estuary). Blotting analysis showed significant increase in the expression of ASK1 (*p<0.05) in brain homogenate of M. cephalus inhabiting Ennore estuary with brain homogenate of M. cephalus inhabiting Kovalam estuary. β-actin has been used as the loading control. Lane 1: ASK1 (155 kDa), Lane 2: β-actin (44 kDa). *p<0.05, insignificant increase in test brain homogenate (18%) when compared with control brain homogenate of grey mullet, CB- control brain homogenate; TB- test brain homogenate.
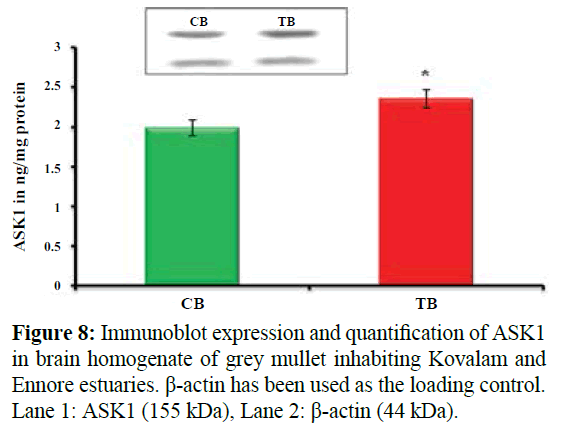
Figure 8: Immunoblot expression and quantification of ASK1 in brain homogenate of grey mullet inhabiting Kovalam and Ennore estuaries. β-actin has been used as the loading control. Lane 1: ASK1 (155 kDa), Lane 2: β-actin (44 kDa).
Discussion
Xenobiotics entering aquatic environment often retain their quality and cause oxidative stress in these organisms by activating the endogenous production of reactive oxygen species (ROS). Oxygen is mandatory for the aerobic organisms to lead a sustained life. Oxygen utilised during various metabolic reactions results in the production of free radicals which may play a role in physiological or pathophysiological processes. ROS, when produced in controlled amounts, can act as signalling molecules to regulate normal cellular functions but when its level exceeds the scavenging capacity they result in deleterious effects on the cell. Free radicals initiate lipid peroxidation leading to the production of lipid hydroperoxides (LHPs) that perturb cell membrane and lipid containing structures resulting in cell injury (Wijeratne and Cuppett, 2006). These LHPs trigger exacerbating rounds of free radical-mediated lipid peroxidation upon iron-mediated oneelectron reduction and oxygenation. A significant increase in the level of LHPs in the test fish brain when compared to control fish brain is due to the damage of membrane lipids by free radicals. A significant variation on comparing the histochemical staining of test fish brain with that of the control fish brain infers cell injury. Fish brain rich in PUFA, is prone to free radical attack resulting in an elevated level of LHPs which in turn causes damage to the cells is substantiated from our results. Thioredoxin (Trx), a small inhibitory redox protein is available at micromolar concentrations in the cell. Trx is one of the major antioxidant systems in cells that scavenge ROS which is attributed to the presence of highly reactive selenocysteine (Cenas et al. 2004). The presence of highly reactive selenocysteine in Trx can bring about two-electron reduction of LHPs to redox-inert alcohols (LOHs) representing a secondary level of cytoprotection (Mustacich and Powis, 2000). A significant elevation in the level of Trx in the test fish brain when compared to control fish brain depicts its role to scavenge LHPs and quench the propagation of lipid peroxidation. This results in maintenance of cell homeostasis directing the fish to survive in a polluted environment.
FTIR spectroscopy is an excellent tool for quantitative analysis where the composition and structure of molecular functional group can be determined by analyzing the position, width and intensity of acquired spectra in a complex biological system (Yee et al. 2004). FTIR could detect the initial response of cells to various stimuli even before physiological events are detected. It also provides structural information on biological molecules thus reflecting the extent of damages experienced by a cell to xenobiotics (Alvarez- Ordonez et al. 2010). The spectrum is characteristic of the organic molecules, which absorb infrared energy at specific frequencies so that the basic structure of compounds can be determined by the spectral locations of their IR absorptions (Klaypradit et al. 2011). Difference in molecular structure and inter-atomic bonds between chemical groups generates unique IR absorption spectra. The entire IR spectrum comprises of three non-overlapping regions namely the far-IR region (400-10 cm-1), the mid-IR region (4000-400 cm-1) and the near-IR region (12800-4000 cm-1). The mid-IR region is further, subdivided into the functional group region (4000-1500 cm-1) and the fingerprint region (1500-400 cm-1). O-H stretching produces a broad band in the range 3900-3600 cm-1 region which is sharper compared to the N-H stretching is usually at 3400 and 3300 cm-1. The bands between 3000 and 2800 cm-1 represent C-H stretching vibrations that are mainly generated by lipids (Wolkers et al. 1998). Lipids play a key role in the membrane fluidity. The frequencies of the CH2 stretching bands of the acyl chains infer the disordered state of lipids revealing the alteration in membrane fluidity (Toyran et al. 2008). The band observed at ~2961 cm-1 in the control sample is due to the asymmetric CH2 stretching mode of the methylene chain in the membrane lipids and its absence in the test sample reveals damage to membrane lipid altering the permease properties of membranes. The band observed at ~1442 cm-1 in test sample is mainly due to asymmetric CH3 bending modes of the methyl groups of protein. The band observed at ~3480 cm-1 in test sample is due to N-H stretching vibrations of amides. The band observed at ~3885 cm-1 is due to O-H stretching which could be used as indicators of the relative concentration of the protein to water of biological tissues. The amide absorptions are considered sensitive to protein conformation. The bands at ~1442 cm-1 (amide II) and ~3480 cm-1 could be attributed to a change in the composition of the whole protein pattern. These observations in the FTIR spectra reveal that biomolecules were sensitive to stress which is pronounced in the test site.
Hypoxia in estuarine ecosystems is an environmental stressor, caused by large temporal and spatial variations in oxygen content of water (Damotharan et al. 2010). The area of hypoxic zones have increased in recent decades due to eutrophication of coastal waters (Rabalais et al. 2007). A decrease in O2 availability evolves adaptive strategies to survive in the changed environment. HIF- 1α, the master regulator involved in the homeostasis of cells under hypoxic conditions and has been found to be up-regulated in fish exposed to hypoxia (Nikinmaa and Rees, 2005; Thomas and Rahman, 2009). Acute hypoxia can increase HIF-1α expression in brain and liver, whereas chronic hypoxia leads to a significant change in HIF-1α expression in muscle (Rimoldi et al. 2012). Elevation in the level of HIF-1α in the test fish brain reveals that apart from behavioural response, fish species have evolved the ability to survive under decreased oxygen tension by elevating the level of HIF-1α. Upon oxygen depletion, HIF1α is stabilised and heterodimerizes with HIF1β which inturn binds to hypoxia responsive element (HRE) in promoters of hypoxia-responsive genes (Semenza 2001) that modulates the expression of other signalling molecules like CYP1A2 and ASK1.
Aquatic environments become hypoxic due to heavy contamination with xenobiotics (Rahman and Thomas, 2012). Metabolism of the xenobiotics is imparted by the cytochrome P450, mixed function oxygenase that plays a major role in the biotransformation of many endogenous and exogenous compounds (Schlenk et al. 2008, Goldstone et al. 2007). For detection of pollution in the aquatic environment, the CYP1 family members have been so far proved to be the most sensitive indicators (Schlenk and Di Giulio 2002). CYP P450 1A (CYP1A) subfamily comprises two genes CYP1A1 and CYP1A2 (Goldstone and Stegeman, 2006). In fish, CYP1A2 is used as a marker to examine the toxicological effect elicited by environmental pollutants. Studies with zebrafish have already reported that several genes encoding Cytochrome P450 proteins are regulated at transcriptional level during hypoxia (Fradette et al. 2007). Availability of HIF-1β or aryl hydrocarbon receptor nuclear translocator (ARNT) is necessary for to heterodimerize with AHR or HIF-1α to elicit differential response. The association and activation of AHR-ARNT is essential for the expression of CYP1A2 (Minghua et al. 2001). During hypoxia HIF-1α is stabilised evading ubiquitination and this stabilized HIF-1α translocates to the nucleus where it dimerizes with HIF-1β or aryl hydrocarbon receptor nuclear translocator (ARNT). This may result in the decreased availability of ARNT to associate with AHR leading to down-regulation of CYP1A2 (Fradette and du Souich, 2003). In the present study, decrease in the level of CYP1A2 was observed in test fish brain compared to control, depicting the prevalence of hypoxia due to accumulation of contaminants and its mediated HIF-1α stabilization. Wu et al. (2006) also demonstrated that down regulation of CYP1A2 may be attributed to the reduced levels of AHR/ARNT under both in-vitro and in-vivo conditions. However, decreased expression of CYP1A2 observed, depicting the prevalence of hypoxia due to accumulation of contaminants and its mediated HIF-1α stabilization. Stabilized HIF-1α translocates to the nucleus where it dimerizes with HIF-1β or aryl hydrocarbon receptor nuclear translocator (ARNT) resulting in the decreased availability of ARNT that causes down-regulation of CYP1A2 (Fradette and du Souich, 2003).
Heat shock proteins (HSPs) also known as stress proteins are highly conserved cellular protein that play a pivotal role in the stress response (Basu et al. 2002). Under unstressed condition the Hsps, in particular the 70 kDa (Hsp70) family, are constitutively expressed in cells and function as molecular chaperones. Earlier studies have reported that exposure of organisms to such diverse stressors as extreme temperature, pollutants and hypoxia results in a reversible increases in Hsp70 expression implicating their protective role against cellular damage (Taleb et al. 2008; Padmini and Usha Rani, 2008, Padmini et al. 2015). Environmental contaminants such as heavy metals and β-naphthoflavone (BNF) have been shown to induce HSP70 in fish tissues, including hepatocytes (Boone et al. 2002). Juvenile rainbow trout exposed to metals in the water or feed showed significantly higher HSP70 levels in the gill tissue (Williams et al. 1996). The significant elevation in the level of HSP70 in the fish brain from test site ascertains the existence of xenobiotics and reduced oxygen tension. This upregulation of HSP70 depicts their cytoprotective role in response to stress. The significant correlation of Hsp70 mRNA levels with fish at higher salinities suggests that this gene may be a potential biomarker for survival of fish in estuarine environment (Mbaye et al. 2010).
ASK1 acts as a primary sensor of free radical generation. Its excessive activation or dysregulation may ultimately affect the survival of fish in the polluted environment (Mayumi et al. 2012). In the current study, insignificant increase in the expression of ASK1 was observed, depicting the influence of various signaling molecules like HIF-1α, HSP70 and Trx conferring cytoprotection. HIF-1 transcription complex also specifically down regulates ASK1 by controlling the expression of serine/ threonine protein phosphatase type 5 (PP5) (Zhou et al. 2004). The cytoprotective role of HSP70 is executed by diverse mechanisms of which inactivation of ASK1 is unique. The ubiquitin-dependent proteasomal degradation of ASK1 is brought about by interaction of HSP 70 with ASK1 (Gao et al. 2010). Apart from HIF-1α and HSP70, ASK1 is also negatively regulated by reduced form of Trx by its association at the N-terminal region of ASK1 which inhibits the activity of serine-threonine kinase of the MKKK family. Ching-Chyuan and John Papaconstantinou, (2006) reported that increased ROS evoke the dissociation of Trx from ASK1-Trx complex, resulting in the activation of ASK1 and its mediated cell disruption. Consistently, increased LOOH was observed. However ASK1 level is insignificant depicting its tight regulation by the elevated expression of HIF-1α, HSP70 and Trx in the test fish brain.
In conclusion, our present study reveals that the up regulation of HIF-1α, HSP70 and Trx regulates the expression of ASK1 to render cytoprotection under pollution induced stress in fish brain.
17325
References
- Akkas, S.B., Severcan, M., Yilmaz, O., Severcan, F. (2007) Effects of lipoic acid supplementation on rat brain tissue: An FTIR spectroscopic and neural network study. Food Chem105, 1281-1288.
- Alvarez-Ordonez, A., Halisch, J., Prieto, M. (2010) Changes in Fourier transform infrared spectra of Salmonella entericaserovarsTyphimurium and Enteritidis after adaptation to stressful growth conditions. Int J Food Microbiol142, 97-105.
- Basu, N., Todgham, A.E., Ackerman, P.A., Bibeau, M.R., Nakano, K. et al. (2002) Heat shock protein genes and their functional significance in fish. Gene 295, 173-183.
- Boone, A.N., Ducouret, B., Vijayan, M.M. (2002) Glucocorticoid-induced glucose release is abolished in trout hepatocytes with elevated HSP70 content. J Endocrinol172, R1-R6.
- Bradford, M.M. (1976) A rapid and sensitive method for the quantitation of microgram quantities of protein utilizing the principle of protein–dye binding.Anal Biochem72, 248-54.
- Cakmak, G., Togan, I., Severcan, F. (2006) 17β-Estradiol induced compositional, structural and functional changes in rainbow trout liver, revealed by FTIR spectroscopy: A comparative study with nonylphenol. AquatToxicol77, 53-63.
- Cenas, N., Nivinskas, H., Anusevicius, Z., Sarlauskas, J., Lederer, F. (2004) Interactions of quinones with thioredoxinreductase: a challenge to the antioxidant role of the mammalian selenoprotein, J BiolChem279, 2583- 2592.
- Ching-Chyuan, H., John, P. (2006) Thioredoxin-ASK1 complex levels regulate ROS-mediated p38 MAPK pathway activity in livers of aged and long-lived Snell dwarf mice Faseb J 20, 259-268.
- Corte, L., Rellini, P., Roscini, L., Fatichenti, F., Cardinali, G. (2010) Development of a novel, FTIR (Fourier transform infrared spectroscopy) based, yeast bioassay for toxicity testing and stress response study. Anal ChimicaActa659, 258-265.
- Damotharan, P., Perumal, N.V., Arumugam, M., Vijayalakshmi, S., Balasubramanian, T. (2010) Seasonal variation of physico-chemical characteristics in point calimere coastal waters south east coast of India. Middle East J Sci Res 64, 333-339.
- Elisabeth, L. P., Denise, A. C., Amato, J. G., Mark, L., Darren, E. R. (2008) Hypoxia- inducible factor-1α stabilisation in nonhypoxic conditions: Role of oxidation and intracellular ascorbate depletion. Mol Bio Cell 19, 86-94.
- Fischer, W., Bianchi, G. (1984) FAO Identification Sheets for Fishery Purposes. Western Indian Ocean, Rome, FAO.
- Fradette, C., Batonga, J., Teng ,S., Piquette-Miller, M., du Souich, P. (2007) Animal models of acute moderate hypoxia are associated with a down-regulation of CYP1A1, 1A2, 2B4, 2C5, and 2C16 and up-regulation of CYP3A6 and pglycoprotein in liver. Drug MetabDispos35, 765-771.
- Fradette C, du Souich P, (2003) Hypoxia-inducible factor-1 and activator protein-1 modulate the upregulation of CYP3A6 induced by hypoxia. Br J Pharmacol140, 1146-54.
- Gao, Y., Han, C., Huang, H., Xin, Y., Xu, Y. et al. (2010) Heat shock protein 70 together with its co-chaperone CHIP inhibits TNF-alpha induced apoptosis by promoting proteasomal degradation of apoptosis signal-regulating kinase 1. Apoptosis15,822-33.
- Genestra, M. (2007) Oxyl radicals, redox-sensitive signalling cascades and antioxidants.Cellular signalling19, 1807-1819.
- Goldstone, H.M., Stegeman, J.J. (2006) A revised evolutionary history of the CYP1A subfamily: gene duplication, gene conversion, and positive selection. J MolEvol62, 708-717.
- Goldstone, J.V., Goldstone, H,M,H., Morrison, A.M., Tarrant, A., Kern, S.E. et al.(2007) Cytochrome P4501 genes in early deuterostomes (tunicates and sea urchins) and vertebrates (chicken and frog): origin and diversification of the CYP1 gene family. MolBiolEvol, 24, 2619-2631.
- Havelkova, M., Randak, T., Zlabek, V., Krijt, J., Kroupova, H. (2007) Biochemical Markers for Assessing Aquatic Contamination. Sensors 7, 2599-2611.
- Jiang ZY, Hunt JV, Wolff SP (1992) Ferrous ion oxidation in the presence of xylenol orange for detection of lipid hydroperoxide in low density lipoprotein. Anal Biochem202, 384-389.
- Jyoti, R.M., Michael, A.H., Geanette, L., Carl, S. (2011) Thummel Transcriptional regulation of xenobiotic detoxification in Drosophila. Genes and Development25, 1796-1806.
- Klaypradit, W., Kerdpiboon, S., Singh, R.K. (2011) Application of Artificial Neural Networks to Predict the Oxidation of Menhaden Fish Oil Obtained from Fourier Transform Infrared Spectroscopy Method. Food Bioprocess Tech4,475-480.
- Mayumi, S., Atsushi,M., Hidenori, I. (2012) Oxidative Stress-Induced Diseases via the ASK1 Signaling Pathway. International J of Cell Biol p: 5.
- Mbaye, T., Francois, B., McKenzie. J.D., Jean-Dominique, D. (2010) Differential expression of the heat shock protein Hsp70 in natural populations of the tilapia, Sarotherodonmelanotheron, acclimatised to a range of environmental salinities. Bio Med Central Ecology 10,11.
- Minghua, N., Alan, L.B., John, P.G. (2001) Interactions between aryl hydrocarbon receptor (AhR) and hypoxia signaling pathways.Environmental toxicology and pharmacology10, 17-27.
- Mu, W., Wen, H., Li, J., He, F. (2013) Cloning and expression analysis of a HSP70 gene from Korean rockfish (Sebastesschlegeli) Fish & Shellfish Immunol35, 1111-1121.
- Mustacich, D., Powis, G. (2000) Thioredoxinreductase, Biochem J 346, 1-8.
- Nikinmaa, M., Rees, B.B. (2005) Oxygen-dependent gene expression in fishes. Am JPhysiolRegulIntegr Comp Physiol, 288,1079-1090.
- Padmini, E., Meenakshi, N., Parimala, P. (2015) HIF1α regulates survival proteins in fish brain under pollutants induced hypoxic condition. Journal of pharmacy research 9,491-499
- Padmini, E., Rani, M.U. (2008) Impact of seasonal variation on HSP70 expression quantitated in stressed fish hepatocytes. Comparative Biochemistry and Physiology 151,278-285.
- Padmini, E., VijayaGeetha, B. (2007a) A comparative seasonal pollution assessment study on estuary with respect to metal accumulation in Mugilcephalus. OceanolHydrobiol Studies 35,1-13.
- Padmini, E., VijayaGeetha, B. (2007b) Seasonal influences on water quality parameters and pollution status of the Ennore estuary, Tamilnadu.Ind J Environ Hydrol15, 1- 9.
- Powis, G., Mustacich, D., Coon, A. (2000) The role of the redox protein thioredoxin in cell growth and cancer. Free RadicBiol Med29, 312-322.
- Rabalais, N.N., Turner, E.R., Sen Gupta, B.K., Platon, E., Parsons, M.L. (2007) Sediments Tell the History of Eutrophication and Hypoxia in the Northern Gulf of Mexico. EcolAppl17,S129-S143.
- Rahman, M.S., Thomas, P. (2012) Effects of Hypoxia Exposure on Hepatic Cytochrome P450 1A (CYP1A) Expression in Atlantic Croaker: Molecular Mechanisms of CYP1A Down-Regulation. PLoS One 7, e40825.
- Rimoldi, S., Terova, G., Ceccuzzi, P., Marelli, S., Antonini, M. et al. (2012) HIF-1α mRNA levels in Eurasian perch (Percafluviatilis) exposed to acute and chronic hypoxia. MolBiol Rep 39, 4009-4015.
- Schlenk, D., Celander, M., Gallagher, E.P., George, S., James, M. et al. (2008) Biotransformation in fishes. In: Di Giulio RT, Hinton DE (eds) The Toxicology of Fishes, CRC Press, Boca Raton, FL, 153-234.
- Schlenk, D., Di Giulio, R.T. (2002) Biochemical responses as indicators of aquatic ecosystem health. In: ADAMS SM (ed.), Biological indicators of aquatic ecosystem stress. AFS, Bethesda pp: 14-17.
- Scoullos, M.J., Sakellari, A., Giannopoulou, K., Paraskevopoulou, V., Dassenakis, M. (2007) Dissolved and particulate trace metal levels in the Saronikos Gulf, Greece, in 2004. The impact of the primary Wastewater Treatment Plant of Psittalia. Desalination, 210,98-109.
- Semenza, G.L. (2001) HIF-1 and mechanisms of hypoxia sensing.CurrOpin CellBiol, 13,167-71.
- Taleb, M., Brandon, C.S., Lee, F.S., Lomax, M.I., Wolfgang, H. et al. (2008) Hsp70 inhibits aminoglycoside-induced hair cell death and is necessary for the protective effect of heat shock. J Assoc Res Oto9,277-289.
- Thomas, P., Rahman, M.S. (2009) Biomarkers of hypoxia exposure and reproductive function in Atlantic croaker: A review with some preliminary findings from the northern Gulf of Mexico hypoxic zone. J Exp Mar BiolEcol381, S38-S50.
- Toyran, N., Severcan, F., Severcan, M., Turan, B. (2008) Effects of selenium supplementation on rat heart apex and right ventricle myocardia by using FTIR spectroscopy: A cluster analysis and neural network approach.Food Chem110, 590-597.
- Vijayan, M.M., Pereira, C., Forsyth, R.B., Kennedy, C.J., Iwama, G.K. (1997) Handling stress does not affect the expression of hepatic heat shock protein 70 and conjugation enzymes in rainbow trout treated with beta-naphthoflavone, Life Sci61,117-27.
- Vlachos, N., Skopelitis, Y., Psaroudaki, M., Konstantinidou, V., Chatzilazarou, A. (2006) Applications of Fourier transform-infrared spectroscopy to edible oils.AnalyticaChimicaActa573,459-465.
- Wijeratne, S.S., Cuppett, S.L. (2006) Lipid hydroperoxide induced oxidative stress damage and antioxidant enzyme response in Caco-2 human colon cells. J Agric Food Chem54,4476-81.
- Williams, J.H., Farag, A.M., Stansbury, M.A., Young, P.A., Bergman, H.L., Petersen, N.S. (1996) Accumulation of hsp70 in juvenile and adult rainbow trout gill exposed to metal-contaminated water and/or diet. Environ ToxicolChem15, 1324-1328.
- Wolkers, W.F., Oldenhof, H., Alberda, M., Hoekstra, F.A. (1998) A Fourier transform infrared microspectroscopy study of sugar glasses: application to anhydrobiotic higher plant cells.BiochimBiophysActa1379,83-96.
- Wu, R., Cui, X., Dong, W., Zhou, M., Simms., H.H. (2006) Suppression of hepatocyte CYP1A2 expression by Kupffer cells via AhR pathway: The central role of proinflammatory cytokines. Int J Mol Med 18, 339-346.
- Xiao, H., Gu, Z., Wang, G., Zhao, T. (2013)The Possible Mechanisms Underlying the Impairment of HIF-1α Pathway Signaling in Hyperglycemia and the Beneficial Effects of Certain Therapies. Int J Med Sci10,1412-1421.
- Yee, N., Benning, L.G., Phoenix, V.R., Ferris, F.G. (2004) Characterization of metal-Cyanobacteria sorption reactions: A combined macroscopic and infrared spectroscopic investigation. Environ SciTechnol38, 775-82.
- Zhou, G., Golden, T., Aragon, I.V., Honkanen, R.E. (2004) Ser/Thr Protein Phosphatase 5 Inactivates Hypoxia-induced Activation of an Apoptosis Signalregulating Kinase 1/MKK-4/JNK Signaling Cascade.J Biolchem279,46595-46605.
